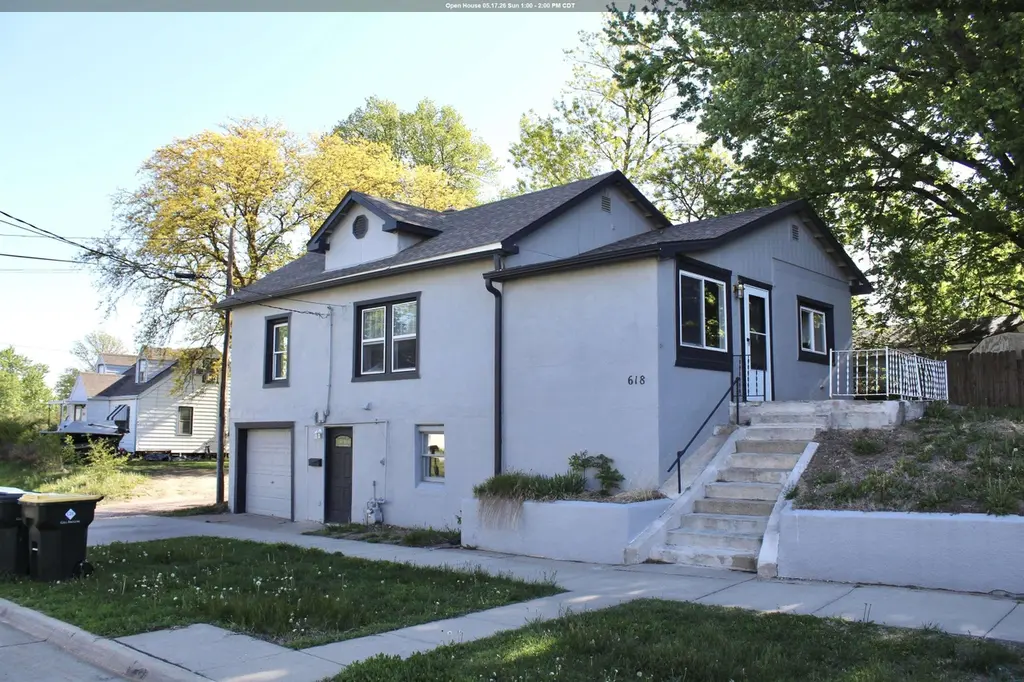
618 S Fairmount St · Sioux City, IA
Flood risk 1/10 · Minimal
- FEMA flood zone
- X (unshaded)
- Chance of flooding over 30 yrs
- 0.0%
- Est. flood insurance / yr
- $473 – $860
Fire risk 5/10 · Moderate
- Est. fire insurance / yr
- $902 – $1,676
Heat risk 3/10 · Minor
- Hot days now (above 101°F)
- 7 days/yr
- Hot days in 30 yrs
- 15 days/yr
Wind risk 2/10 · Minimal
- Chance of severe wind over 30 yrs
- —
Air-quality risk 1/10 · Minimal
- Unhealthy air days now
- 0 days/yr
- Unhealthy air days in 30 yrs
- 0 days/yr
Risk factors via First Street. Map © Google.
Why this score? — see what drove the D+ grade
The composite is a weighted blend of 9 inputs, each scored 0–100. Each bar is that input's sub-score; the figure is the points it added to the 100-point composite (weight × sub-score).
- Cash flow +13.5/30.0
- ARV discount +11.0/15.0
- Schools +4.7/10.0
- DSCR +4.1/10.0
- Livability +3.9/5.0
- 1% rule +3.1/10.0
- Rent growth +2.5/5.0
- Condition / age +2.5/5.0
- Appreciation +0.0/10.0
$189,949
🖨 Deal sheet 📄 Offer letter ✓ Due diligence
Listing remarks
Welcome home. This thoughtfully renovated 4-bedroom, 2-bath contemporary has been refreshed from top to bottom; new LVP floors, fresh carpet, crisp paint, and updated fixtures throughout. The kitchen is the heart of it all, with rich quartz countertops, a brand-new stainless steel sink, and cabinetry that actually gives you room to cook and store. The main floor offers two bedrooms including a primary suite with walk-in closet, a full bath, and a convenient laundry area just off the kitchen. On the lower-level, two additional bedrooms, a 3/4 bath, and walkout access to the garage make everyday living easy. 1,450 sq. ft. of refined, low-maintenance living with nothing to do but move in. Add
Key facts
- Crisp paint
- Quartz countertops
- Renovated
Tags
Property features AI
Exterior
- Parking: Attached concrete garage with 1 parking space
- Security: Smoke detector(s)
- Utilities: Public water; Public sewer
- Home design: Single family residence; Residential property
- Construction: Stucco exterior; Shingle roof; Below-grade finished area
- Exterior features: Deck; Patio; Few trees on the lot; In-ground pool
Interior
- Kitchen: Eat-in kitchen
- Flooring: Vinyl flooring
- Bathrooms: 1 full bathroom; 1 three-quarter bathroom
- Heating & cooling: Natural gas forced-air heating; Central air conditioning
- Interior features: Eat-in kitchen; Built-in features; Primary bedroom on main level; Finished basement with walk-out access
- Laundry & utility: Laundry on main level
Neighborhood map
What this means for you Summary
Snapshot
- This is a 3-bed/1.0-bath single-family listed at $190k.
Deal economics
- At list price, monthly cash flow is $7 ($82/yr) — positive.
- The deal already cash-flows at list — no discount required.
- To meet the 1% rule (rent ≥ 1% of price), the offer needs to be $153k (19.3% below list).
- Recommended offer: $153k (19.3% below list) — sets the bar for 1% rule.
- Cap rate 6.3% vs local median 3.7% in Sioux City — top-decile yield for the area; either an underpriced asset or a hidden risk that comps aren't pricing in. Stress-test before assuming the spread holds.
Location & tenants
- Location reads 78/100 on livability (#138 in IA, #2,544 nationally) — a middle-class / working-renter tenant base. Strengths: cost of living A+, housing A+, health & safety A+; Watch: crime F, commute F.
- Sioux City Community School District (urban): math 54% / reading 57% proficiency, ranked #264 of 289 in IA (top 91%) — acceptable for families but not a draw, mixed tenant base, ~2y average lease.
- Zoned schools: Spalding Park Elementary (math 59% / reading 55%, grade C+, #436 of 616 statewide, top 74%, 652 students, 69% FRL); East Middle School (math 60% / reading 67%, grade B+, #169 of 246 statewide, top 69%, 1,067 students, 65% FRL); East High School (math 53% / reading 63%, grade C, #275 of 336 statewide, top 83%, 1,495 students, 54% FRL).
- Market conditions: 204 active listings in the ZIP; 2 comparable units currently listed for rent nearby; solid renter incomes; 170 units permitted in Woodbury County in 2024 (90 in 5+ unit buildings).
Forward outlook
- Local home prices are declining (-3.0%/yr); year-one equity from $1k of loan paydown is wiped out by about $6k of value loss. Plan a longer hold.
Negotiation context
- It's been on market 41 days — a 3% lower offer ($184k) is reasonable based on typical stale-listing flexibility.
Risks & watch-outs
- Watch-outs: built in 1920 — expect roof / HVAC / electrical / plumbing capex.
- Climate carrying-cost: moderate wildfire risk — expect insurance premiums to compound above CPI over the hold.
Questions for the listing agent
- It's been on market 41 days. Have you received any prior offers? Is the seller open to a 19% concession, seller financing, or rate buy-down credit?
- Built in 1920 — when were the roof, HVAC, electrical panel, plumbing, and water heater last replaced?
- Is there a deadline driving the sale (1031 exchange, divorce, estate, relocation)? That informs how much negotiation room exists.
- Crime grade is F in this area — have there been break-ins, vandalism, or insurance claims at this property in the last 3 years? What carrier currently insures it and at what premium?
- The area grade is low — what's the realistic commute time and amenity access for the typical tenant pool here? Any planned neighborhood developments (good or bad) we should know about?
- What's the average days-on-market for RENTAL listings here right now (not sales)? A rising rental-DOM trend means longer vacancies and softer asking-rent achievability than the comps imply.
- What's the recent tenant-quality profile in this submarket — average credit score on applications, eviction rate, late-payment / NSF rate, and stable-employment percentage? A property-management company in the area should have these aggregated.
- How much new for-sale + rental construction is in the pipeline within 1–3 miles? Heavy new supply typically softens prices + rents 12–24 months out; constrained supply supports both.
Investment metrics
- 1% rule
- 0.81% ✗
- Cap rate
- 6.34%
- Cash-on-cash
- 0.15%
- DSCR
- 1.01
- GRM
- 10.3
CMA / ARV
- ARV (median comp)
- $206,081
- List price
- $189,949
- Delta
- -7.83%
- Verdict
- FAIR
- Comps
- 20 within 1.0 mi
Show comp detail 12 sales within ~0.75 mi
| Address | Dist | Beds/Ba | Sqft | Sold | Price | $/sf | Match |
|---|---|---|---|---|---|---|---|
| 817 S Fairmount St | 0.15mi | 3/1.0 | 1,404 (-3%) | 3mo | $144,400 | $103 | 85 |
| 723 S Rustin St | 0.15mi | 4/2.0 (+1) | 1,398 (-4%) | 3mo | $180,000 | $129 | 76 |
| 3031 Leech Ave | 0.36mi | 3/1.0 | 1,463 (+1%) | 8mo | $177,500 | $121 | 75 |
| 714 S Alice St | 0.32mi | 2/2.0 (-1) | 1,408 (-3%) | 0mo | $186,000 | $132 | 71 |
| 1005 S Paxton St | 0.48mi | 3/1.0 | 1,436 (-1%) | 7mo | $130,000 | $91 | 70 |
| 704 S Glass St | 0.59mi | 3/1.0 | 1,453 (+0%) | 4mo | $215,000 | $148 | 68 |
| 701 S Paxton | 0.43mi | 4/1.0 (+1) | 1,557 (+7%) | 2mo | $200,000 | $128 | 61 |
| 423 S Rustin St | 0.18mi | 4/3.0 (+1) | 1,301 (-10%) | 2mo | $290,000 | $223 | 60 |
| 425 S Rustin St | 0.18mi | 4/3.0 (+1) | 1,301 (-10%) | 3mo | $290,000 | $223 | 59 |
| 1021 S Cecelia St | 0.44mi | 3/1.0 | 1,254 (-14%) | 6mo | $225,000 | $179 | 52 |
| 1219 S Cornelia St | 0.66mi | 3/1.5 | 1,552 (+7%) | 7mo | $191,000 | $123 | 50 |
| 1127 S Cecelia St | 0.51mi | 3/1.5 | 1,246 (-14%) | 7mo | $206,000 | $165 | 45 |
Match score weights: distance 35% · size 25% · config 20% · recency 20%. Top-matched comps best support the ARV.
Projected returns pro-forma
-3.0% appreciation · 3.0% rent growth · sell at horizon
- IRR
- -16.1%
- Equity multiple
- 0.43×
- Total profit
- $-30,390
- Equity at exit
- $28,322
- IRR
- -7.8%
- Equity multiple
- 0.51×
- Total profit
- $-26,083
- Equity at exit
- $16,423
Cash invested: $53,186 (down + closing). Projections, not guarantees.
Landlord ↔ Tenant lean methodology
- Overall (STATE)
- 83 Strongly Landlord-Friendly
- State Iowa
- 83 Strongly Landlord-Friendly · R+6
- County
- — inherits STATE
- City
- — inherits STATE
ZIP-level market 51106
- Active inventory
- 204
- Price-to-rent
- 10.3×
Monthly cashflow live
- Estimated rent
- $1,533 medium interval (Pro) →
- Mortgage (P&I)
- −$996
- Tax from tax record
- −$129 /mo · $1,544/yr
- Insurance
- −$79
- HOA
- −$0
- Vacancy / Maint / Mgmt
- −$322
- Net cashflow
- $7
Break-even live
UW: 25.0% down · 7.5% · 30yr · 1.5% tax · 5.0% vac · 8.0% maint · 8.0% mgmt
Financing live
Cash to close
- Down payment
- $47,487
- Closing costs
- $5,698
- Reserves months
- —
- Total cash needed
- —
Loan-product check · same deal, 3 products live
Conventional
25% down · 7.5% · 30yr
- Down + closing
- —
- Monthly P&I
- —
- Monthly cashflow
- —
- DSCR
- —
- Eligible?
- —
Personal DTI + credit; lowest rate.
DSCR
20% down · 8.5% · 30yr
- Down + closing
- —
- Monthly P&I
- —
- Monthly cashflow
- —
- DSCR
- —
- Eligible?
- —
No personal income docs; deal must DSCR.
Hard money
10% down · 12.0% · 12mo
- Down + closing
- —
- Monthly P&I
- —
- Monthly cashflow
- —
- DSCR
- —
- Eligible?
- —
Short-term bridge; refi at stabilization.
Rent comps 2 comps
| Address | Beds | Baths | Sqft | Rent | $/sqft | DOM | Units | Dist |
|---|---|---|---|---|---|---|---|---|
| 700 S Linn St Sioux City, IA | 2.0 | 2.0 | 926 | $1,400 | $1.51 | 43d | 1 | 0.10mi |
| 860 River View Dr South Sioux City, NE | 1.0–2.0 | 1.0–2.0 | 867 | $1,252 | $1.44 | 43d | 1 | 1.36mi |
Listing history 17 events
-
2026-06-19days on market $189,949 Active 41 DOM
-
2026-06-18days on market $189,949 Active 40 DOM
-
2026-06-17days on market $189,949 Active 39 DOM
-
2026-06-16days on market $189,949 Active 38 DOM
-
2026-06-15days on market $189,949 Active 37 DOM
-
2026-06-14days on market $189,949 Active 35 DOM
-
2026-06-12pricedays on market $189,949 Active 34 DOM
-
2026-06-09days on market $195,000 Active 31 DOM
-
2026-06-08days on market $195,000 Active 30 DOM
-
2026-06-07days on market $195,000 Active 29 DOM
-
2026-06-05pricedays on market $195,000 Active 26 DOM
-
2026-06-02days on market $199,497 Active 24 DOM
-
2026-06-01days on market $199,497 Active 23 DOM
-
2026-05-31days on market $199,497 Active 22 DOM
-
2026-05-30days on market $199,497 Active 21 DOM
-
2026-05-09$206,450 Active 893-char remark
-
2022-10-24soldstatus $285,000
ⓘ Source: listings_history table (triggers on properties + properties_extension) + one-shot
backfill from property_details.listing_events for pre-trigger history.
Tax reassessment forecast IA · Partial reset (capped growth)
- Current annual tax
- $1,544 · $129/mo
- Projected year-2 tax
- $2,263 · $189/mo
- Expected delta
- +$719/yr (+$60/mo · 46.6%)
ⓘ Screening estimate from a state-policy table — verify with the county assessor before closing.
Climate risk First Street
- Flood 1/10 Low FEMA zone X (unshaded) · 0% chance over 30 yrs
- Wildfire 5/10 Major
- Heat 3/10 Moderate 7 d/yr ≥101°F today · 15 d/yr by 30 yrs out
- Wind 2/10 Low
- Air quality 1/10 Low 0 unhealthy d/yr today · 0 by 30 yrs out
Nearby sold comps map
Loading sold comps map…
Walkable amenities ~0.75 mi
Loading nearby amenities…
Taxation est. · year 1
- Rental income
- $18,391
- − Mortgage interest
- −$10,640
- − Property taxes
- −$1,544
- − Insurance
- −$950
- − Repairs & maintenance
- −$1,471
- − Management
- −$1,471
- − Depreciation
- −$5,526
- Taxable loss
- −$3,211
- Est. tax savings @ 24.0%
- +$771
- After-tax cash flow
- $852/yr
For passive investors: Depreciation is non-cash, so a rental often shows a tax loss while cash-flowing — sheltering income. Rental losses are passive: they offset passive income freely, and up to $25,000/yr can offset ordinary (W-2) income if you actively participate and your MAGI is under $100k (phasing out to $0 by $150k); unused losses carry forward. On sale, claimed depreciation is recaptured at up to 25%, and gains may owe capital-gains tax (a 1031 exchange can defer both). Figures are a year-1 estimate at your 24.0% rate — not tax advice; consult a CPA.
Schools (NCES district)
- District
- Sioux City Community School District
- NCES district ID
- 1926400
- Math proficiency
- 54% ▼ -7.00%
- Reading proficiency
- 57% ▼ -2.00%
- Median HH income
- $44,967
- Composite
- 46.86/100
- National rank
- #2371
- State rank
- #264 of 289 in IA
Livability — Sioux City
- Score
- 78/100
- State rank
- #138
- US rank
- #2544
Category grades
Schools grade is shown separately in the Schools card above.
Census & demographics
- Census place
- Sioux City, IA
- County
- Woodbury County · 51,789 people
- City population
- 51,789
- Metro
- Sioux City, IA-NE-SD
- Population (ZIP)
- 28,592
- Household income
- $78,434
- Rent vs Own
- Severe rent burden
- 891.0
Population outlook (Woodbury County) Hauer SSP2
- Today (2025)
- 103,226 people
- By 2030
- 103,060 · -0.2%
- By 2040
- 102,533 · -0.7%
- By 2050
- 102,788 · -0.4%
- By 2075
- 107,227 · +3.9%
- By 2100
- 113,980 · +10.4%
Race, ethnicity, and origin ACS 2023
- Neighborhood character
- Predominantly White (78%)
- Race & ethnicity
- White 78% Hispanic / Latino 10% Two or more races 8% Black 6% Asian 1%
- Hispanic origin (detail)
- Mexican 8%
- Common ancestry
- Portuguese 5% Iranian 4% Italian 2%
- Foreign-born
- 5% · Canada
- Languages at home
- 89% English-only · Spanish 8% German/W. Germanic 1% French/Haitian/Cajun 1%
Political lean MEDSL · Woodbury
- 2024 margin
- Strong R (+23.0) · D 37.8% · R 60.9% · Other 1.3%
- 2008→2024 swing
- -22.5pp toward R · 2008: -0.5pp · 2024: -23.0pp
- All cycles
- 2024: R+23.0 2020: R+15.5 2016: R+19.9 2012: R+0.2 2008: R+0.5
Not yet ingested
- Civics
- —
Market trends
- HPI YoY
- ▼ -127.61%
- Current HPI
- 229.6733
- Rent YoY
- —
- Metro
- Sioux City, IA-NE-SD
- State GDP YoY
- ▲ 2.48%
- F500 in state
- 4
Industry mix (Fortune 500 HQ in IA)
| Industry | F500 HQs | Revenue |
|---|---|---|
| Financial Services | 1 | $16B |
|
||
| Retail / Convenience | 1 | $15B |
|
||
Price history
-33.4% since first listed5 events — show timeline
- 2026-06-10 Price Changed $189,949 NWIA
- 2026-06-03 Price Changed $195,000 NWIA
- 2026-05-19 Price Changed $199,497 NWIA
- 2026-05-09 Listed $206,450 NWIA
- 2022-10-24 Sold (Public Records) $285,000 Public Records
Property tax history
+1.4%/yrLatest (2025): $1,544 · -3.3% YoY. Source: county tax records.
Cash-flow waterfall
monthlySold comps — $/sqft
last 12 mo · ≤1 miLoading sold comps…