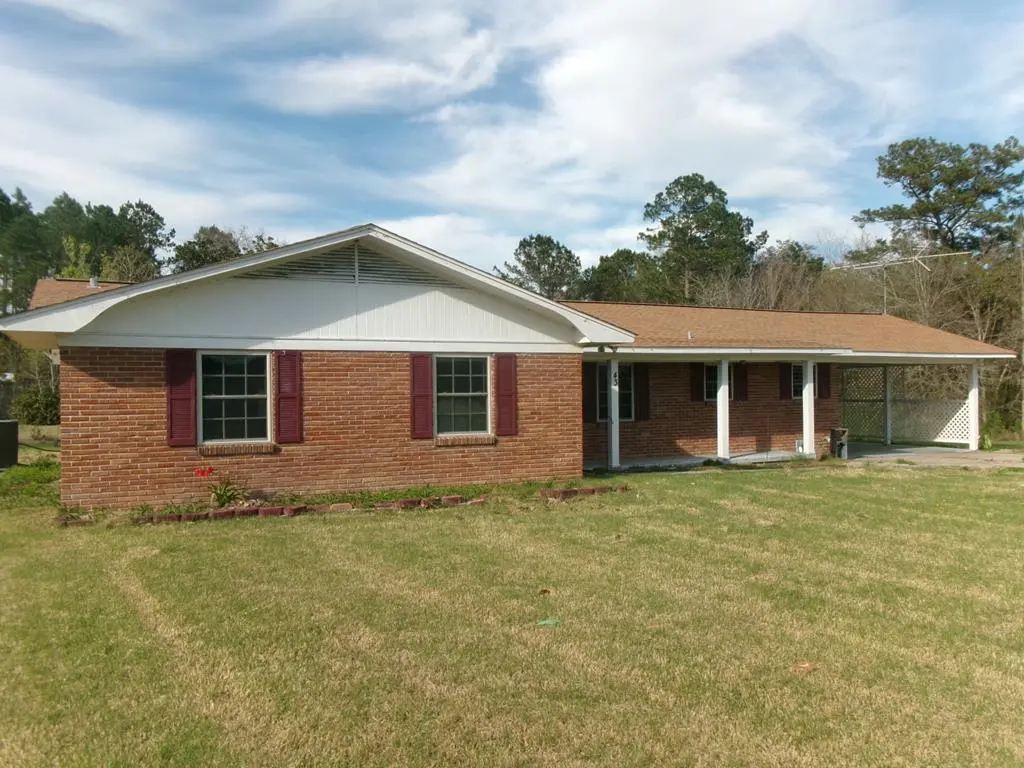
43 Beverly Hills Dr · Poplarville, MS
Flood risk 1/10 · Minimal
- FEMA flood zone
- X (unshaded)
- Chance of flooding over 30 yrs
- 0.0%
- Est. flood insurance / yr
- $507 – $1,088
Fire risk 9/10 · Severe
- Est. fire insurance / yr
- $1,241 – $2,305
Heat risk 8/10 · Major
- Hot days now (above 109°F)
- 7 days/yr
- Hot days in 30 yrs
- 19 days/yr
Wind risk 9/10 · Severe
- Chance of severe wind over 30 yrs
- 99.0%
Air-quality risk 1/10 · Minimal
- Unhealthy air days now
- 0 days/yr
- Unhealthy air days in 30 yrs
- 0 days/yr
Risk factors via First Street. Map © Google.
Why this score? — see what drove the C grade
The composite is a weighted blend of 9 inputs, each scored 0–100. Each bar is that input's sub-score; the figure is the points it added to the 100-point composite (weight × sub-score).
- Cash flow +21.1/30.0
- ARV discount +15.0/15.0
- DSCR +6.7/10.0
- 1% rule +4.5/10.0
- Livability +3.6/5.0
- Schools +3.0/10.0
- Rent growth +2.5/5.0
- Condition / age +2.5/5.0
- Appreciation +0.0/10.0
$137,000
🖨 Deal sheet 📄 Offer letter ✓ Due diligence
Listing remarks
This one checks all the boxes: it's close to town, on a large lot, has a workshop/RV storage and a lake view too! Features include a spacious den/dining room combo, primary bedroom with walk in closet, a 2 car carport with attached storage and more! A must see for the price.
Key facts
- Large lot
- Lake view
- Workshop rv storage
Tags
Neighborhood map
What this means for you Summary
Snapshot
- This is a 3-bed/1.0-bath single-family listed at $137k.
Deal economics
- At list price, monthly cash flow is $195 ($2k/yr) — positive.
- The deal already cash-flows at list — no discount required.
- To meet the 1% rule (rent ≥ 1% of price), the offer needs to be $130k (5.1% below list).
- Recommended offer: $130k (5.1% below list) — sets the bar for 1% rule.
- Cap rate 8.0% vs local median 2.8% in Poplarville — top-decile yield for the area; either an underpriced asset or a hidden risk that comps aren't pricing in. Stress-test before assuming the spread holds.
Location & tenants
- Location reads 72/100 on livability (#27 in MS) — a middle-class / working-renter tenant base. Strengths: cost of living A+, housing A+, health & safety A+; Watch: amenities F, commute F, employment D-.
- Poplarville Separate School District (rural): math 33% / reading 39% proficiency, ranked #52 of 130 in MS (top 40%) — families likely to look elsewhere, expect single-tenant / working-renter base with shorter leases; 63% free/reduced lunch — lower-income household profile, screen leases tightly.
- Market conditions: 190 active listings in the ZIP; 326 units permitted in Pearl River County in 2024 (0 in 5+ unit buildings).
Forward outlook
- Local home prices are declining (-3.0%/yr); year-one equity from $947 of loan paydown is wiped out by about $4k of value loss. Plan a longer hold.
- Pearl River County population projected at -19% by 2050 — secular population decline; favor cash flow + early exit over multi-decade hold.
Negotiation context
- Only 9 days on market — expect competitive offers; lowballing is unlikely to land.
Risks & watch-outs
- Climate carrying-cost: severe wind risk, 99% chance of damaging wind over 30y; severe wildfire risk; extreme-heat days projected 7→19/yr by 2055 (HVAC capex compounding) — expect insurance premiums to compound above CPI over the hold.
Questions for the listing agent
- Built in 1975 — when were the roof, HVAC, electrical panel, plumbing, and water heater last replaced?
- Is there a deadline driving the sale (1031 exchange, divorce, estate, relocation)? That informs how much negotiation room exists.
- What's the average days-on-market for RENTAL listings here right now (not sales)? A rising rental-DOM trend means longer vacancies and softer asking-rent achievability than the comps imply.
- What's the recent tenant-quality profile in this submarket — average credit score on applications, eviction rate, late-payment / NSF rate, and stable-employment percentage? A property-management company in the area should have these aggregated.
- How much new for-sale + rental construction is in the pipeline within 1–3 miles? Heavy new supply typically softens prices + rents 12–24 months out; constrained supply supports both.
Investment metrics
- 1% rule
- 0.95% ✗
- Cap rate
- 8.01%
- Cash-on-cash
- 6.11%
- DSCR
- 1.27
- GRM
- 8.8
CMA / ARV
- ARV (on-the-fly)
- $263,042
- Comps found
- 3
Show comp detail 3 sales within ~0.75 mi
| Address | Dist | Beds/Ba | Sqft | Sold | Price | $/sf | Match |
|---|---|---|---|---|---|---|---|
| 110 Bob Simpson Rd | 0.56mi | 3/2.0 | 1,645 (-6%) | 15mo | $290,000 | $176 | 48 |
| 464 Peters Rd | 0.25mi | 4/2.0 (+1) | 1,507 (-14%) | 15mo | $214,900 | $143 | 44 |
| 1250 Hwy 26 W | 0.32mi | 4/2.0 (+1) | 1,507 (-14%) | 22mo | $228,000 | $151 | 36 |
Match score weights: distance 35% · size 25% · config 20% · recency 20%. Top-matched comps best support the ARV.
Projected returns pro-forma
-3.0% appreciation · 3.0% rent growth · sell at horizon
- IRR
- -6.9%
- Equity multiple
- 0.74×
- Total profit
- $-9,801
- Equity at exit
- $20,427
- IRR
- 2.7%
- Equity multiple
- 1.19×
- Total profit
- $7,289
- Equity at exit
- $11,845
Cash invested: $38,360 (down + closing). Projections, not guarantees.
Landlord ↔ Tenant lean methodology
- Overall (STATE)
- 90 Strongly Landlord-Friendly
- State Mississippi
- 90 Strongly Landlord-Friendly · R+11
- County
- — inherits STATE
- City
- — inherits STATE
ZIP-level market 39470
- Home prices YoY
- -18.1%
- Active inventory
- 190
- Price-to-rent
- 8.8×
Monthly cashflow live
- Estimated rent
- $1,301 medium interval (Pro) →
- Mortgage (P&I)
- −$718
- Tax from tax record
- −$57 /mo · $680/yr
- Insurance
- −$57
- HOA
- −$0
- Vacancy / Maint / Mgmt
- −$273
- Net cashflow
- $195
Break-even live
UW: 25.0% down · 7.5% · 30yr · 1.5% tax · 5.0% vac · 8.0% maint · 8.0% mgmt
Financing live
Cash to close
- Down payment
- $34,250
- Closing costs
- $4,110
- Reserves months
- —
- Total cash needed
- —
Loan-product check · same deal, 3 products live
Conventional
25% down · 7.5% · 30yr
- Down + closing
- —
- Monthly P&I
- —
- Monthly cashflow
- —
- DSCR
- —
- Eligible?
- —
Personal DTI + credit; lowest rate.
DSCR
20% down · 8.5% · 30yr
- Down + closing
- —
- Monthly P&I
- —
- Monthly cashflow
- —
- DSCR
- —
- Eligible?
- —
No personal income docs; deal must DSCR.
Hard money
10% down · 12.0% · 12mo
- Down + closing
- —
- Monthly P&I
- —
- Monthly cashflow
- —
- DSCR
- —
- Eligible?
- —
Short-term bridge; refi at stabilization.
Listing history 3 events
-
2026-03-27status Pending
-
2026-03-17$137,000 Active
-
2022-11-01soldstatus
ⓘ Source: listings_history table (triggers on properties + properties_extension) + one-shot
backfill from property_details.listing_events for pre-trigger history.
Tax reassessment forecast MS · Resets to sale price
- Current annual tax
- $680 · $57/mo
- Projected year-2 tax
- $1,082 · $90/mo
- Expected delta
- +$403/yr (+$34/mo · 59.2%)
ⓘ Screening estimate from a state-policy table — verify with the county assessor before closing.
Climate risk First Street
- Flood 1/10 Low FEMA zone X (unshaded) · 0% chance over 30 yrs
- Wildfire 9/10 Extreme
- Heat 8/10 Severe 7 d/yr ≥109°F today · 19 d/yr by 30 yrs out
- Wind 9/10 Extreme 99% chance of damaging wind over 30 yrs
- Air quality 1/10 Low 0 unhealthy d/yr today · 0 by 30 yrs out
Nearby sold comps map
Loading sold comps map…
Walkable amenities ~0.75 mi
Loading nearby amenities…
Taxation est. · year 1
- Rental income
- $15,610
- − Mortgage interest
- −$7,674
- − Property taxes
- −$680
- − Insurance
- −$685
- − Repairs & maintenance
- −$1,249
- − Management
- −$1,249
- − Depreciation
- −$3,985
- Taxable income
- $88
- Est. tax owed @ 24.0%
- −$21
- After-tax cash flow
- $2,325/yr
For passive investors: Depreciation is non-cash, so a rental often shows a tax loss while cash-flowing — sheltering income. Rental losses are passive: they offset passive income freely, and up to $25,000/yr can offset ordinary (W-2) income if you actively participate and your MAGI is under $100k (phasing out to $0 by $150k); unused losses carry forward. On sale, claimed depreciation is recaptured at up to 25%, and gains may owe capital-gains tax (a 1031 exchange can defer both). Figures are a year-1 estimate at your 24.0% rate — not tax advice; consult a CPA.
Schools (NCES district)
- District
- Poplarville Separate School District
- NCES district ID
- 2803720
- Math proficiency
- 33% ▼ -12.00%
- Reading proficiency
- 39% ▼ -6.00%
- Median HH income
- $38,882
- Composite
- 30.1/100
- National rank
- #6339
- State rank
- #52 of 130 in MS
Livability — Poplarville
- Score
- 72/100
- State rank
- #27
- US rank
- #6434
Category grades
Schools grade is shown separately in the Schools card above.
Census & demographics
- Population (ZIP)
- 12,872
Population outlook (Pearl River County) Hauer SSP2
- Today (2025)
- 53,426 people
- By 2030
- 51,663 · -3.3%
- By 2040
- 47,611 · -10.9%
- By 2050
- 43,286 · -19.0%
- By 2075
- 32,859 · -38.5%
- By 2100
- 22,476 · -57.9%
Race, ethnicity, and origin ACS 2023
- Neighborhood character
- Predominantly White (81%)
- Race & ethnicity
- White 81% Black 12% Two or more races 4% Hispanic / Latino 2%
- Common ancestry
- Lithuanian 6% Italian 3% Serbian 1%
- Foreign-born
- 0%
- Languages at home
- 98% English-only · Spanish 1%
Political lean MEDSL · Pearl River
- 2024 margin
- Solid R (+66.7) · D 16.1% · R 82.8% · Other 1.0%
- 2008→2024 swing
- -6.3pp toward R · 2008: -60.4pp · 2024: -66.7pp
- All cycles
- 2024: R+66.7 2020: R+64.2 2016: R+66.8 2012: R+60.3 2008: R+60.4
Not yet ingested
- Civics
- —
Market trends
- HPI YoY
- ▼ -46.36%
- Current HPI
- 210.4161
- Rent YoY
- —
- Metro
- —
- State GDP YoY
- —
- F500 in state
- 0
Price history
3 events — show timeline
- 2026-03-27 Pending — PRCBOR
- 2026-03-17 Listed $137,000 PRCBOR
- 2022-11-01 Sold (Public Records) — Public Records
Property tax history
+5.7%/yrLatest (2025): $680 · -7.4% YoY. Source: county tax records.
Cash-flow waterfall
monthlySold comps — $/sqft
last 12 mo · ≤1 miLoading sold comps…