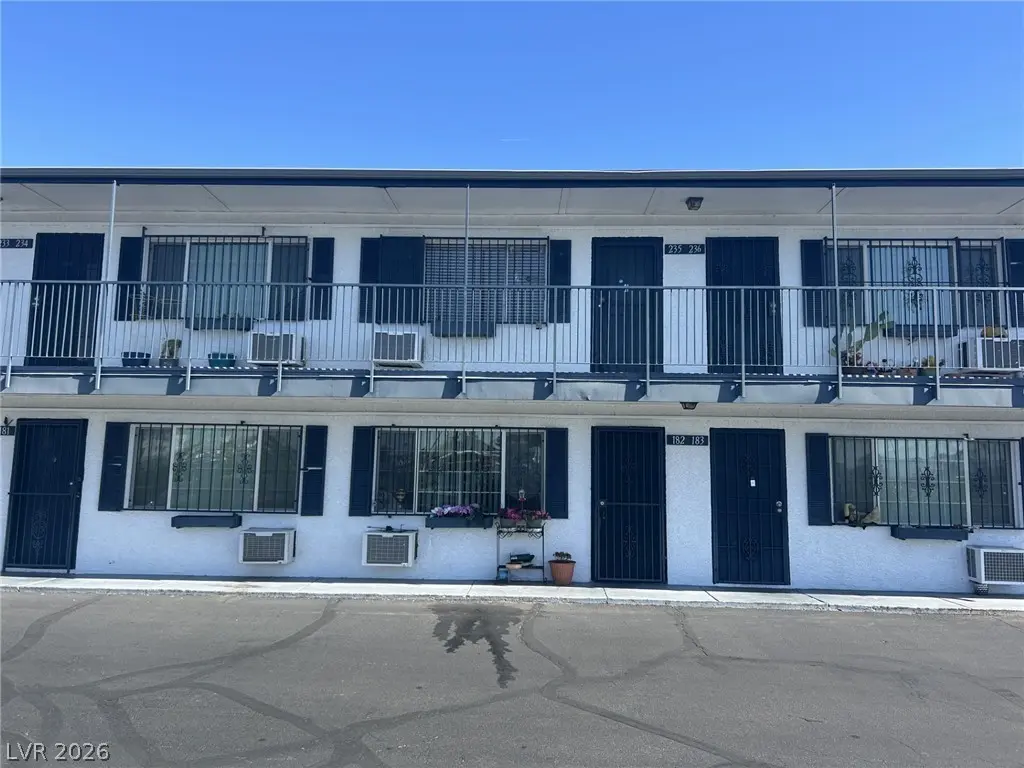
4600 University Center Dr #235 · Paradise, NV
Flood risk 1/10 · Minimal
- FEMA flood zone
- X (unshaded)
- Chance of flooding over 30 yrs
- 0.0%
- Est. flood insurance / yr
- $507 – $1,088
Fire risk 1/10 · Minimal
- Est. fire insurance / yr
- $490 – $910
Heat risk 8/10 · Major
- Hot days now (above 106°F)
- 7 days/yr
- Hot days in 30 yrs
- 17 days/yr
Wind risk 1/10 · Minimal
- Chance of severe wind over 30 yrs
- —
Air-quality risk 3/10 · Minor
- Unhealthy air days now
- 3 days/yr
- Unhealthy air days in 30 yrs
- 4 days/yr
Risk factors via First Street. Map © Google.
Why this score? — see what drove the D grade
The composite is a weighted blend of 9 inputs, each scored 0–100. Each bar is that input's sub-score; the figure is the points it added to the 100-point composite (weight × sub-score).
- Cash flow +14.5/30.0
- ARV discount +7.5/15.0
- 1% rule +4.8/10.0
- DSCR +4.4/10.0
- Livability +3.8/5.0
- Schools +2.6/10.0
- Condition / age +2.5/5.0
- Rent growth +2.0/5.0
- Appreciation +0.0/10.0
$120,000
🖨 Deal sheet (PDF) 📄 Offer letter ✓ Due diligence
Listing remarks MLS
Prime location!. .. Cozy condo, move-in ready!. .. 2nd floor studio/1BR. .. vinyl flooring. .. includes all appliances. .. community pool, laundry facility, assigned parking. .. Walk to UNLV, minutes to Strip, airport, shopping, dining, freeway!. .. Great investment!
Key facts
- Community pool
- Walk to unlv
- Laundry facility
Tags
Neighborhood map
What this means for you Summary
Snapshot
- This is a 1-bed/1.0-bath condo listed at $120k.
Deal economics
- At list price, monthly cash flow is $25 ($303/yr) — positive.
- The deal already cash-flows at list — no discount required.
- To meet the 1% rule (rent ≥ 1% of price), the offer needs to be $118k (1.9% below list).
- Recommended offer: $113k (6.0% below list) — sets the bar for market timing.
Location & tenants
- Location reads 76/100 on livability (#10 in NV, #3,494 nationally) — a middle-class / working-renter tenant base. Strengths: commute A+, housing A-, cost of living B; Watch: employment D+, crime D-.
- Clark County School District (urban): math 21% / reading 39% proficiency, ranked #11 of 17 in NV (top 65%) — families likely to look elsewhere, expect single-tenant / working-renter base with shorter leases.
- Zoned schools: Paradise Prof Dev Es (math 12% / reading 22%, grade F, #311 of 402 statewide, top 82%, 476 students, 100% FRL); Orr William E Ms (math 5% / reading 18%, grade F, #103 of 109 statewide, top 95%, 815 students, 100% FRL); Del Sol Academy of Performing Arts Hs (math 10% / reading 33%, grade F, #91 of 131 statewide, top 70%, 2,511 students, 100% FRL) — zoned schools average 100% FRL vs 52% district-wide (48 pts higher); higher-poverty schools than district average — tighter screening recommended.
- Zoned-school proficiency averages 17% at this address vs 30% district-wide (-13 pts) — the specific schools serving this property underperform the Clark County School District average; the district grade overstates school quality for this exact location.
- Market conditions: Rents soft (-1.8%/yr); 200 active listings in the ZIP; 1 comparable units currently listed for rent nearby; 14,754 units permitted in Clark County in 2024 (2,301 in 5+ unit buildings).
- This rent runs 30% of the median local income ($47k/yr) — at the standard rent-burdened threshold; future hikes will face affordability resistance.
Forward outlook
- Local home prices are declining (-3.0%/yr); year-one equity from $830 of loan paydown is wiped out by about $4k of value loss. Plan a longer hold.
- Clark County population projected at +36% by 2050 — long-run rental-demand tailwind backs the buy-and-hold thesis.
Negotiation context
- It's been on market 67 days — a 6% lower offer ($113k) is reasonable based on typical stale-listing flexibility.
- 13 sale attempts since 2y ago with the ask held roughly flat each time — persistent listings suggest the price (not the market) is what's stuck; bring a comps-based counter.
Risks & watch-outs
- Climate carrying-cost: extreme-heat days projected 7→17/yr by 2055 (HVAC capex compounding) — expect insurance premiums to compound above CPI over the hold.
Questions for the listing agent
- It's been on market 67 days. Have you received any prior offers? Is the seller open to a 6% concession, seller financing, or rate buy-down credit?
- Built in 1977 — when were the roof, HVAC, electrical panel, plumbing, and water heater last replaced?
- What does the HOA fee cover, when was the last increase, and are there any pending special assessments or reserve-fund shortfalls?
- Any open or pending special assessments — roof, HVAC, plumbing, elevator, façade? What's the per-unit balance and payoff schedule, and is the seller paying it off at close or rolling it to the buyer?
- Why hasn't it sold? Are there any deal-killer items the seller is aware of (foundation, flood, title, zoning, code violations)?
- Is there a deadline driving the sale (1031 exchange, divorce, estate, relocation)? That informs how much negotiation room exists.
- Schools are F-rated, which usually means shorter tenancies and higher turnover. Who's the typical renter profile here, and what's been the actual vacancy rate?
- Crime grade is D in this area — have there been break-ins, vandalism, or insurance claims at this property in the last 3 years? What carrier currently insures it and at what premium?
- The area grade is low — what's the realistic commute time and amenity access for the typical tenant pool here? Any planned neighborhood developments (good or bad) we should know about?
- What's the average days-on-market for RENTAL listings here right now (not sales)? A rising rental-DOM trend means longer vacancies and softer asking-rent achievability than the comps imply.
- What's the recent tenant-quality profile in this submarket — average credit score on applications, eviction rate, late-payment / NSF rate, and stable-employment percentage? A property-management company in the area should have these aggregated.
- How much new apartment / multifamily construction is in the pipeline within 1–3 miles? Heavy new supply (>2% of stock underway) typically softens rents 12–24 months out; light construction supports rent growth.
Investment metrics
- 1% rule
- 0.98% ✗
- Cap rate
- 6.55%
- Cash-on-cash
- 0.90%
- DSCR
- 1.04
- GRM
- 8.5
CMA / ARV
No comps found within radius.
Projected returns pro-forma
-3.0% appreciation · 0.0% rent growth · sell at horizon
- IRR
- -18.5%
- Equity multiple
- 0.37×
- Total profit
- $-21,221
- Equity at exit
- $17,892
- IRR
- -19.3%
- Equity multiple
- 0.12×
- Total profit
- $-29,477
- Equity at exit
- $10,375
Cash invested: $33,600 (down + closing). Projections, not guarantees.
Landlord ↔ Tenant lean methodology
- Overall (STATE)
- 71 Landlord-Friendly
- State Nevada
- 71 Landlord-Friendly · R+1
- County
- — inherits STATE
- City
- — inherits STATE
ZIP-level market 89119
- Rents YoY
- -1.8%
- Active inventory
- 200
- Price-to-rent
- 8.5×
Monthly cashflow live
- Estimated rent
- $1,177 medium interval (Pro) →
- Mortgage (P&I)
- −$629
- Tax from tax record
- −$26 /mo · $317/yr
- Insurance
- −$50
- HOA
- −$199
- Vacancy / Maint / Mgmt
- −$247
- Net cashflow
- $25
Break-even live
Sensitivity live
| Price | -10% $93 | -5% $59 | +0% $25 | +5% $-9 | +10% $-43 |
|---|---|---|---|---|---|
| Rent | -10% $-68 | -5% $-21 | +0% $25 | +5% $72 | +10% $118 |
| Rate | -1.0pp $86 | -0.5pp $56 | base $25 | +0.5pp $-6 | +1.0pp $-37 |
UW: 25.0% down · 7.5% · 30yr · 1.5% tax · 5.0% vac · 8.0% maint · 8.0% mgmt
Financing live
Cash to close
- Down payment
- $30,000
- Closing costs
- $3,600
- Reserves months
- —
- Total cash needed
- —
Loan-product check · same deal, 3 products live
Conventional
25% down · 7.5% · 30yr
- Down + closing
- —
- Monthly P&I
- —
- Monthly cashflow
- —
- DSCR
- —
- Eligible?
- —
Personal DTI + credit; lowest rate.
DSCR
20% down · 8.5% · 30yr
- Down + closing
- —
- Monthly P&I
- —
- Monthly cashflow
- —
- DSCR
- —
- Eligible?
- —
No personal income docs; deal must DSCR.
Hard money
10% down · 12.0% · 12mo
- Down + closing
- —
- Monthly P&I
- —
- Monthly cashflow
- —
- DSCR
- —
- Eligible?
- —
Short-term bridge; refi at stabilization.
Rent comps 1 comps
| Address | Beds | Baths | Sqft | Rent | $/sqft | DOM | Units | Dist |
|---|---|---|---|---|---|---|---|---|
| 4700 S Maryland Pkwy Las Vegas, NV | 1.0 | 1.0 | 409 | $1,382 | $3.37 | 45d | 48 | 0.59mi |
HOA detail condo
- Monthly dues
- $199 · $2,388/yr
- Likely covers
- poolparking
- Assessments
- None detected in remarks — confirm with the listing agent.
Listing history 50 events
-
2026-06-21days on market $120,000 Active 67 DOM
-
2026-06-18days on market $120,000 Active 64 DOM
-
2026-06-17days on market $120,000 Active 63 DOM
-
2026-06-16days on market $120,000 Active 62 DOM
-
2026-06-15days on market $120,000 Active 61 DOM
-
2026-06-13days on market $120,000 Active 59 DOM
-
2026-06-09days on market $120,000 Active 55 DOM
-
2026-06-08days on market $120,000 Active 54 DOM
-
2026-06-07days on market $120,000 Active 53 DOM
-
2026-06-03days on market $120,000 Active 49 DOM
-
2026-06-02days on market $120,000 Active 48 DOM
-
2026-06-01days on market $120,000 Active 47 DOM
-
2026-05-31days on market $120,000 Active 46 DOM
-
2026-04-15$120,000 Active 267-char remark
Show marketing remark (267 chars)
Prime location!. .. Cozy condo, move-in ready!. .. 2nd floor studio/1BR. .. vinyl flooring. .. includes all appliances. .. community pool, laundry facility, assigned parking. .. Walk to UNLV, minutes to Strip, airport, shopping, dining, freeway!. .. Great investment!
-
2026-04-14historical $855
-
2026-04-09historical $855
-
2026-03-17$855
-
2026-03-17$855
-
2025-10-10historical $700
-
2025-10-02historical $700
-
2025-09-30historical $700
-
2025-09-18price $700
-
2025-09-18$700
-
2025-09-08$800
-
2025-09-08historical $800
-
2025-09-03price $800
-
2025-09-03price $800
-
2025-08-19price $850
-
2025-08-19$850
-
2025-07-29historical $900
-
2025-06-21$900
-
2025-06-21historical $900
-
2025-06-19$900
-
2025-06-18$900
-
2025-06-09historical
-
2025-04-04$125,000 Active
-
2025-02-16historical $900
-
2025-02-14historical $900
-
2025-02-04$900
-
2025-02-04$900
-
2024-10-29soldstatus $110,000 Closed
-
2024-10-29soldstatus $110,000
-
2024-10-09historical Active Under Contract
-
2024-09-05$115,000 Active
-
2024-09-05historical $115,000
-
2021-12-23soldstatus $77,000
-
2017-03-30soldstatus $49,000
-
2016-12-15soldstatus $20,000
-
2006-08-16soldstatus $76,000
-
2004-12-29soldstatus $37,000
ⓘ Source: listings_history table (triggers on properties + properties_extension) + one-shot
backfill from property_details.listing_events for pre-trigger history.
Tax reassessment forecast NV · Resets to sale price
- Current annual tax
- $317 · $26/mo
- Projected year-2 tax
- $708 · $59/mo
- Expected delta
- +$391/yr (+$33/mo · 123.4%)
ⓘ Screening estimate from a state-policy table — verify with the county assessor before closing.
Climate risk First Street
- Flood 1/10 Low FEMA zone X (unshaded) · 0% chance over 30 yrs
- Wildfire 1/10 Low
- Heat 8/10 Severe 7 d/yr ≥106°F today · 17 d/yr by 30 yrs out
- Wind 1/10 Low
- Air quality 3/10 Moderate 3 unhealthy d/yr today · 4 by 30 yrs out
Nearby sold comps map
Loading sold comps map…
Walkable amenities ~0.75 mi
Loading nearby amenities…
Taxation est. · year 1
- Rental income
- $14,126
- − Mortgage interest
- −$6,722
- − Property taxes
- −$317
- − Insurance
- −$600
- − Repairs & maintenance
- −$1,130
- − Management
- −$1,130
- − HOA
- −$2,388
- − Depreciation
- −$3,491
- Taxable loss
- −$1,652
- Est. tax savings @ 24.0%
- +$396
- After-tax cash flow
- $700/yr
For passive investors: Depreciation is non-cash, so a rental often shows a tax loss while cash-flowing — sheltering income. Rental losses are passive: they offset passive income freely, and up to $25,000/yr can offset ordinary (W-2) income if you actively participate and your MAGI is under $100k (phasing out to $0 by $150k); unused losses carry forward. On sale, claimed depreciation is recaptured at up to 25%, and gains may owe capital-gains tax (a 1031 exchange can defer both). Figures are a year-1 estimate at your 24.0% rate — not tax advice; consult a CPA.
Schools (NCES district)
- District
- Clark County School District
- NCES district ID
- 3200060
- Math proficiency
- 21% ▼ -13.00%
- Reading proficiency
- 39% ▼ -8.00%
- Median HH income
- $53,611
- Composite
- 26.48/100
- National rank
- #7211
- State rank
- #11 of 17 in NV
Livability — Paradise
- Score
- 76/100
- State rank
- #10
- US rank
- #3494
Category grades
Schools grade is shown separately in the Schools card above.
Census & demographics
- Census place
- Paradise, NV
- County
- Clark County · 2,306,105 people
- City population
- 227,885
- Metro
- Las Vegas-Henderson-Paradise, NV
- Population (ZIP)
- 50,196
- Household income
- $46,960
- Rent vs Own
- Severe rent burden
- 4678.0
Population outlook (Clark County) Hauer SSP2
- Today (2025)
- 2,504,101 people
- By 2030
- 2,693,770 · +7.6%
- By 2040
- 3,061,208 · +22.2%
- By 2050
- 3,400,072 · +35.8%
- By 2075
- 4,139,522 · +65.3%
- By 2100
- 4,596,916 · +83.6%
Race, ethnicity, and origin ACS 2023
- Neighborhood character
- Highly diverse neighborhood (Simpson 0.74)
- Race & ethnicity
- Hispanic / Latino 38% White 29% Two or more races 18% Black 13% Asian 11%
- Hispanic origin (detail)
- Mexican 23% Puerto Rican 1% Cuban 4%
- Common ancestry
- Romanian 2% Lithuanian 1% Scotch-Irish 1%
- Foreign-born
- 31% · Canada, China, Jamaica
- Languages at home
- 57% English-only · Spanish 29% Tagalog/Filipino 6% Other Indo-European 3%
Political lean MEDSL · Clark
- 2024 margin
- Toss-up / Even · D 50.4% · R 47.8% · Other 1.7%
- 2008→2024 swing
- -16.5pp toward R · 2008: 19.1pp · 2024: 2.6pp
- All cycles
- 2024: D+2.6 2020: D+9.3 2016: D+10.7 2012: D+14.5 2008: D+19.1
Not yet ingested
- Civics
- —
Market trends
- HPI YoY
- ▼ -221.72%
- Current HPI
- 266.4892
- Rent YoY
- ▼ -1.81%
- Metro
- Las Vegas-Henderson-Paradise, NV
- State GDP YoY
- ▲ 3.08%
- F500 in state
- 6
Industry mix (Fortune 500 HQ in NV)
| Industry | F500 HQs | Revenue |
|---|---|---|
| Hotels / Casinos | 3 | $36B |
|
||
Price history
+300.0% since first listed41 events — show timeline
- 2026-04-15 Listed $120,000 GLVAR
- 2026-04-14 Rental Removed $855 GLVAR
- 2026-04-09 Rental Removed $855 APPFOLIO
- 2026-03-17 Listed for Rent $855 APPFOLIO
- 2026-03-17 Listed for Rent $855 GLVAR
- 2025-10-10 Rental Removed $700 TURBOTENANT
- 2025-10-02 Rental Removed $700 APPFOLIO
- 2025-09-30 Rental Removed $700 GLVAR
- 2025-09-18 Price Changed $700 GLVAR
- 2025-09-18 Listed for Rent $700 APPFOLIO
- 2025-09-08 Listed for Rent $800 TURBOTENANT
- 2025-09-08 Rental Removed $800 APPFOLIO
- 2025-09-03 Price Changed $800 GLVAR
- 2025-09-03 Price Changed $800 APPFOLIO
- 2025-08-19 Price Changed $850 APPFOLIO
- 2025-08-19 Listed for Rent $850 GLVAR
- 2025-07-29 Rental Removed $900 GLVAR
- 2025-06-21 Listed for Rent $900 APPFOLIO
- 2025-06-21 Rental Removed $900 TURBOTENANT
- 2025-06-19 Listed for Rent $900 TURBOTENANT
- 2025-06-18 Listed for Rent $900 GLVAR
- 2025-06-09 Listing Removed — GLVAR
- 2025-04-04 Listed $125,000 GLVAR
- 2025-02-16 Rental Removed $900 APPFOLIO
- 2025-02-14 Rental Removed $900 GLVAR
- 2025-02-04 Listed for Rent $900 APPFOLIO
- 2025-02-04 Listed for Rent $900 GLVAR
- 2024-10-29 Sold (Public Records) $110,000 Public Records
- 2024-10-29 Sold (MLS) $110,000 GLVAR
- 2024-10-09 Contingent — GLVAR
- 2024-09-05 Listed $115,000 GLVAR
- 2024-09-05 Coming Soon $115,000 GLVAR
- 2021-12-23 Sold (Public Records) $77,000 Public Records
- 2017-03-30 Sold (Public Records) $49,000 Public Records
- 2016-12-15 Sold (Public Records) $20,000 Public Records
- 2006-08-16 Sold (Public Records) $76,000 Public Records
- 2004-12-29 Sold (Public Records) $37,000 Public Records
- 2000-07-31 Sold (Public Records) $28,000 Public Records
- 1999-05-21 Sold (Public Records) $25,000 Public Records
- 1994-05-04 Sold (Public Records) $25,000 Public Records
- 1990-05-03 Sold (Public Records) $30,000 Public Records
Property tax history
+1.1%/yrLatest (2025): $317 · +7.1% YoY. Source: county tax records.
Cash-flow waterfall
monthlySold comps — $/sqft
last 12 mo · ≤1 miLoading sold comps…