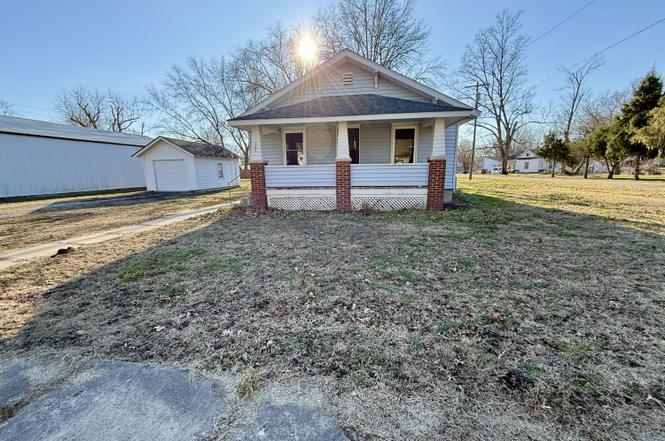
303 Trigg Ave · Blackwater, MO
Flood risk 1/10 · Minimal
- FEMA flood zone
- X (unshaded)
- Chance of flooding over 30 yrs
- 0.0%
- Est. flood insurance / yr
- $507 – $1,088
Fire risk 1/10 · Minimal
- Est. fire insurance / yr
- $1,054 – $1,958
Heat risk 4/10 · Minor
- Hot days now (above 106°F)
- 7 days/yr
- Hot days in 30 yrs
- 17 days/yr
Wind risk 2/10 · Minimal
- Chance of severe wind over 30 yrs
- —
Air-quality risk 2/10 · Minimal
- Unhealthy air days now
- 0 days/yr
- Unhealthy air days in 30 yrs
- 1 days/yr
Risk factors via First Street. Map © Google.
Why this score? — see what drove the D+ grade
The composite is a weighted blend of 9 inputs, each scored 0–100. Each bar is that input's sub-score; the figure is the points it added to the 100-point composite (weight × sub-score).
- Cash flow +14.2/30.0
- ARV discount +7.5/15.0
- Appreciation +5.3/10.0
- DSCR +4.3/10.0
- Schools +3.3/10.0
- Livability +3.0/5.0
- 1% rule +2.6/10.0
- Rent growth +2.5/5.0
- Condition / age +2.5/5.0
$124,900
🖨 Deal sheet (PDF) 📄 Offer letter ✓ Due diligence
Listing remarks
Check out these freshly finished hardwood floors in this cute bungalow close to the heart of Blackwater & its adorable downtown area. This home still has updated wiring, lighting, HVAC, and windows. Located on a huge lot with a shed & detached garage! It is also walking distance to the local bank, cafe, coffee shop, and the K-8th grade Blackwater School! Make your appointment today!
Key facts
- Updated wiring
- Updated windows
- Updated hvac
Tags
Neighborhood map
What this means for you Summary
Snapshot
- This is a 2-bed/1.0-bath other listed at $125k.
Deal economics
- At list price, monthly cash flow is $20 ($243/yr) — positive.
- The deal already cash-flows at list — no discount required.
- To meet the 1% rule (rent ≥ 1% of price), the offer needs to be $95k (23.8% below list).
- Recommended offer: $95k (23.8% below list) — sets the bar for 1% rule.
Location & tenants
- Location reads 59/100 on livability (#559 in MO) — a working-class tenant base; expect higher turnover. Strengths: cost of living A+, housing A+; Watch: employment C-, schools D, crime F.
- Blackwater R-II (rural): math 35% / reading 35% proficiency, ranked #381 of 535 in MO (top 71%) — families likely to look elsewhere, expect single-tenant / working-renter base with shorter leases.
- Market conditions: 4 active listings in the ZIP; 10 units permitted in Cooper County in 2024 (0 in 5+ unit buildings).
Forward outlook
- In year one you build about $2k of equity ($864 loan paydown + $766 appreciation (0.6% local appreciation)).
- Cooper County population projected to shrink 4% by 2050 — rents likely to lag national; underwrite the cash flow, not the appreciation.
Negotiation context
- It's been on market 103 days — a 9% lower offer ($114k) is reasonable based on typical stale-listing flexibility.
- Current owner paid $25k; list at $125k implies a 400% gain — meaningful room to come down on a strong offer.
Risks & watch-outs
- Watch-outs: built in 1930 — expect roof / HVAC / electrical / plumbing capex.
Questions for the listing agent
- It's been on market 103 days. Have you received any prior offers? Is the seller open to a 24% concession, seller financing, or rate buy-down credit?
- Built in 1930 — when were the roof, HVAC, electrical panel, plumbing, and water heater last replaced?
- Why hasn't it sold? Are there any deal-killer items the seller is aware of (foundation, flood, title, zoning, code violations)?
- Is there a deadline driving the sale (1031 exchange, divorce, estate, relocation)? That informs how much negotiation room exists.
- Schools are D-rated, which usually means shorter tenancies and higher turnover. Who's the typical renter profile here, and what's been the actual vacancy rate?
- Crime grade is F in this area — have there been break-ins, vandalism, or insurance claims at this property in the last 3 years? What carrier currently insures it and at what premium?
- The area grade is low — what's the realistic commute time and amenity access for the typical tenant pool here? Any planned neighborhood developments (good or bad) we should know about?
- What's the average days-on-market for RENTAL listings here right now (not sales)? A rising rental-DOM trend means longer vacancies and softer asking-rent achievability than the comps imply.
- What's the recent tenant-quality profile in this submarket — average credit score on applications, eviction rate, late-payment / NSF rate, and stable-employment percentage? A property-management company in the area should have these aggregated.
- How much new for-sale + rental construction is in the pipeline within 1–3 miles? Heavy new supply typically softens prices + rents 12–24 months out; constrained supply supports both.
Investment metrics
- 1% rule
- 0.76% ✗
- Cap rate
- 6.49%
- Cash-on-cash
- 0.69%
- DSCR
- 1.03
- GRM
- 10.9
CMA / ARV
No comps found within radius.
Projected returns pro-forma
0.61% appreciation · 3.0% rent growth · sell at horizon
- IRR
- 0.7%
- Equity multiple
- 1.03×
- Total profit
- $1,214
- Equity at exit
- $40,146
- IRR
- 5.7%
- Equity multiple
- 1.66×
- Total profit
- $23,063
- Equity at exit
- $51,472
Cash invested: $34,972 (down + closing). Projections, not guarantees.
Landlord ↔ Tenant lean methodology
- Overall (STATE)
- 81 Strongly Landlord-Friendly
- State Missouri
- 81 Strongly Landlord-Friendly · R+10
- County
- — inherits STATE
- City
- — inherits STATE
ZIP-level market 65322
- Home prices YoY
- 0.6%
- Active inventory
- 4
- Price-to-rent
- 10.9×
Monthly cashflow live
- Estimated rent
- $952 medium interval (Pro) →
- Mortgage (P&I)
- −$655
- Tax from tax record
- −$25 /mo · $296/yr
- Insurance
- −$52
- HOA
- −$0
- Vacancy / Maint / Mgmt
- −$200
- Net cashflow
- $20
Break-even live
Sensitivity live
| Price | -10% $91 | -5% $56 | +0% $20 | +5% $-15 | +10% $-50 |
|---|---|---|---|---|---|
| Rent | -10% $-55 | -5% $-17 | +0% $20 | +5% $58 | +10% $95 |
| Rate | -1.0pp $83 | -0.5pp $52 | base $20 | +0.5pp $-12 | +1.0pp $-45 |
UW: 25.0% down · 7.5% · 30yr · 1.5% tax · 5.0% vac · 8.0% maint · 8.0% mgmt
Financing live
Cash to close
- Down payment
- $31,225
- Closing costs
- $3,747
- Reserves months
- —
- Total cash needed
- —
Loan-product check · same deal, 3 products live
Conventional
25% down · 7.5% · 30yr
- Down + closing
- —
- Monthly P&I
- —
- Monthly cashflow
- —
- DSCR
- —
- Eligible?
- —
Personal DTI + credit; lowest rate.
DSCR
20% down · 8.5% · 30yr
- Down + closing
- —
- Monthly P&I
- —
- Monthly cashflow
- —
- DSCR
- —
- Eligible?
- —
No personal income docs; deal must DSCR.
Hard money
10% down · 12.0% · 12mo
- Down + closing
- —
- Monthly P&I
- —
- Monthly cashflow
- —
- DSCR
- —
- Eligible?
- —
Short-term bridge; refi at stabilization.
Listing history 9 events
-
2026-04-22status Pending
-
2026-04-14price $124,900
-
2026-02-25price $136,000
-
2026-01-08$145,000 Active
-
2023-10-16soldstatus
-
2007-04-18soldstatus $25,000
-
2007-01-23soldstatus
-
2000-01-22soldstatus
-
1982-05-17soldstatus
ⓘ Source: listings_history table (triggers on properties + properties_extension) + one-shot
backfill from property_details.listing_events for pre-trigger history.
Tax reassessment forecast MO · Resets to sale price
- Current annual tax
- $296 · $25/mo
- Projected year-2 tax
- $1,212 · $101/mo
- Expected delta
- +$915/yr (+$76/mo · 309.0%)
ⓘ Screening estimate from a state-policy table — verify with the county assessor before closing.
Climate risk First Street
- Flood 1/10 Low FEMA zone X (unshaded) · 0% chance over 30 yrs
- Wildfire 1/10 Low
- Heat 4/10 Moderate 7 d/yr ≥106°F today · 17 d/yr by 30 yrs out
- Wind 2/10 Low
- Air quality 2/10 Low 0 unhealthy d/yr today · 1 by 30 yrs out
Nearby sold comps map
Loading sold comps map…
Walkable amenities ~0.75 mi
Loading nearby amenities…
Taxation est. · year 1
- Rental income
- $11,422
- − Mortgage interest
- −$6,996
- − Property taxes
- −$296
- − Insurance
- −$624
- − Repairs & maintenance
- −$914
- − Management
- −$914
- − Depreciation
- −$3,633
- Taxable loss
- −$1,956
- Est. tax savings @ 24.0%
- +$469
- After-tax cash flow
- $712/yr
For passive investors: Depreciation is non-cash, so a rental often shows a tax loss while cash-flowing — sheltering income. Rental losses are passive: they offset passive income freely, and up to $25,000/yr can offset ordinary (W-2) income if you actively participate and your MAGI is under $100k (phasing out to $0 by $150k); unused losses carry forward. On sale, claimed depreciation is recaptured at up to 25%, and gains may owe capital-gains tax (a 1031 exchange can defer both). Figures are a year-1 estimate at your 24.0% rate — not tax advice; consult a CPA.
Schools (NCES district)
- District
- Blackwater R-II
- NCES district ID
- 2905190
- Math proficiency
- 35% ▬ 0.00%
- Reading proficiency
- 35% ▼ -15.00%
- Median HH income
- $45,694
- Composite
- 32.57/100
- National rank
- #10820
- State rank
- #381 of 535 in MO
Livability — Blackwater
- Score
- 59/100
- State rank
- #559
- US rank
- #20358
Category grades
Schools grade is shown separately in the Schools card above.
Census & demographics
- Census place
- Blackwater, MO
- Population (ZIP)
- 704
Population outlook (Cooper County) Hauer SSP2
- Today (2025)
- 17,611 people
- By 2030
- 17,665 · +0.3%
- By 2040
- 17,445 · -0.9%
- By 2050
- 16,916 · -3.9%
- By 2075
- 15,807 · -10.2%
- By 2100
- 13,148 · -25.3%
Race, ethnicity, and origin ACS 2023
- Neighborhood character
- Predominantly White (94%)
- Race & ethnicity
- White 94% Two or more races 3% Black 3%
- Common ancestry
- Lithuanian 2% Portuguese 2% Italian 2%
Political lean MEDSL · Cooper
- 2024 margin
- Solid R (+45.8) · D 26.6% · R 72.4% · Other 1.1%
- 2008→2024 swing
- -22.1pp toward R · 2008: -23.8pp · 2024: -45.8pp
- All cycles
- 2024: R+45.8 2020: R+46.3 2016: R+46.3 2012: R+32.1 2008: R+23.8
Not yet ingested
- Civics
- —
Market trends
- HPI YoY
- ▲ 0.61%
- Current HPI
- 101.747
- Rent YoY
- —
- Metro
- —
- State GDP YoY
- ▲ 1.84%
- F500 in state
- 20
Industry mix (Fortune 500 HQ in MO)
| Industry | F500 HQs | Revenue |
|---|---|---|
| Healthcare | 1 | $163B |
|
||
| Insurance | 1 | $21B |
|
||
| Industrial Technology | 1 | $17B |
|
||
| Retail | 1 | $16B |
|
||
| Industrial Distribution | 1 | $10B |
|
||
| Utilities | 1 | $9B |
|
||
Price history
+399.6% since first listed9 events — show timeline
- 2026-04-22 Pending — CMBR
- 2026-04-14 Price Changed $124,900 CMBR
- 2026-02-25 Price Changed $136,000 CMBR
- 2026-01-08 Listed $145,000 CMBR
- 2023-10-16 Sold (Public Records) — Public Records
- 2007-04-18 Sold (Public Records) $25,000 Public Records
- 2007-01-23 Sold (Public Records) — Public Records
- 2000-01-22 Sold (Public Records) — Public Records
- 1982-05-17 Sold (Public Records) — Public Records
Property tax history
+4.1%/yrLatest (2025): $296 · +7.9% YoY. Source: county tax records.
Cash-flow waterfall
monthlySold comps — $/sqft
last 12 mo · ≤1 miLoading sold comps…