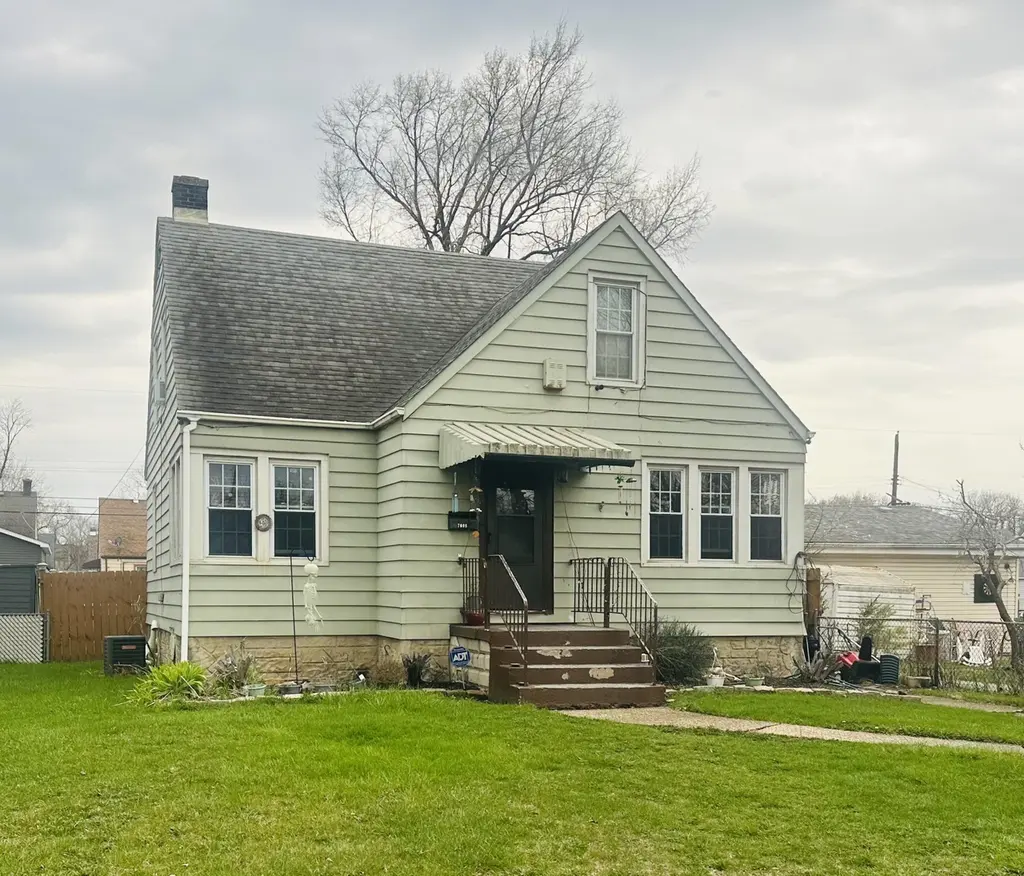
7608 Jackson Ave · Hammond, IN
Flood risk 6/10 · Moderate
- FEMA flood zone
- X (shaded)
- Chance of flooding over 30 yrs
- 0.72%
- Est. flood insurance / yr
- $473 – $860
Fire risk 1/10 · Minimal
- Est. fire insurance / yr
- $717 – $1,331
Heat risk 3/10 · Minor
- Hot days now (above 102°F)
- 7 days/yr
- Hot days in 30 yrs
- 15 days/yr
Wind risk 2/10 · Minimal
- Chance of severe wind over 30 yrs
- 0.0%
Air-quality risk 4/10 · Minor
- Unhealthy air days now
- 5 days/yr
- Unhealthy air days in 30 yrs
- 6 days/yr
Risk factors via First Street. Map © Google.
Why this score? — see what drove the B- grade
The composite is a weighted blend of 9 inputs, each scored 0–100. Each bar is that input's sub-score; the figure is the points it added to the 100-point composite (weight × sub-score).
- Cash flow +28.5/30.0
- DSCR +10.0/10.0
- ARV discount +9.7/15.0
- 1% rule +7.7/10.0
- Rent growth +3.9/5.0
- Livability +3.5/5.0
- Condition / age +2.5/5.0
- Schools +1.1/10.0
- Appreciation +0.0/10.0
$240,000
🖨 Deal sheet 📄 Offer letter ✓ Due diligence
Listing remarks MLS
3 Bedroom South Hammond Cape Cod! Main floor features include living room with hardwood floors, dining room, kitchen, 2 bedrooms and full bath. Upper level master bedroom with hardwood floors, full basement. Home has a detached garage and fenced yard; home is in good condition, being sold as is. Home is currently tenant occupied with a month to month lease. NOTE: Real Estate Taxes based on no exemptions; taxes will be significantly reduced for an owner occupancy. New Central Air installed in 2020.
Key facts
- 4,960 sq ft lot
- Garage
- Built 1941
Neighborhood map
What this means for you Summary
Snapshot
- This is a 3-bed/1.0-bath single-family listed at $240k.
Deal economics
- At list price, monthly cash flow is $787 ($9k/yr) — positive.
- The deal already cash-flows at list — no discount required.
- Meets the 1% rule at list price ($3k rent vs $240k).
- Cap rate 10.2% vs local median 5.8% in Hammond — top-decile yield for the area; either an underpriced asset or a hidden risk that comps aren't pricing in. Stress-test before assuming the spread holds.
Location & tenants
- Location reads 70/100 on livability (#143 in IN) — a middle-class / working-renter tenant base. Strengths: cost of living A+, housing A+, commute A; Watch: health & safety D+, employment D, schools F.
- School City Of Hammond (suburban): math 8% / reading 18% proficiency, ranked #289 of 301 in IN (top 96%) — low school quality limits family demand, transient renter base, plan for 1-2y turnover; 74% free/reduced lunch — lower-income household profile, screen leases tightly.
- Market conditions: Rents rising fast (+5.5%/yr); 63 active listings in the ZIP; 10 comparable units currently listed for rent nearby; rentals leasing fast (median 2d on market — plan ~1-2 weeks tenant-placement turnaround); 1,642 units permitted in Lake County in 2024 (14 in 5+ unit buildings).
- At $3,041/mo this rent would consume 58% of the median local household income ($63k/yr) (locally 507% of renters already pay >50% of income on rent) — very limited rent-growth headroom before tenants either downsize or default.
Forward outlook
- Local home prices are declining (-3.0%/yr); year-one equity from $2k of loan paydown is wiped out by about $7k of value loss. Plan a longer hold.
- Lake County population projected to shrink 7% by 2050 — rents likely to lag national; underwrite the cash flow, not the appreciation.
- At projected returns (-3.0% appreciation + 5.5% rent growth), your $67k cash investment doubles in ~7 years — after that, you're playing with house money.
Negotiation context
- Only 1 days on market — expect competitive offers; lowballing is unlikely to land.
- 9 sale attempts since 27y ago; this cycle's ask is 12% above the opening price — seller raised mid-cycle; expect resistance to lowballs.
- Current owner paid $86k; list at $240k implies a 179% gain — meaningful room to come down on a strong offer.
Risks & watch-outs
- Watch-outs: built in 1941 — expect roof / HVAC / electrical / plumbing capex.
- Climate carrying-cost: major flood risk — expect insurance premiums to compound above CPI over the hold.
Questions for the listing agent
- Built in 1941 — when were the roof, HVAC, electrical panel, plumbing, and water heater last replaced?
- Is there a deadline driving the sale (1031 exchange, divorce, estate, relocation)? That informs how much negotiation room exists.
- Schools are F-rated, which usually means shorter tenancies and higher turnover. Who's the typical renter profile here, and what's been the actual vacancy rate?
- Crime grade is F in this area — have there been break-ins, vandalism, or insurance claims at this property in the last 3 years? What carrier currently insures it and at what premium?
- What's the average days-on-market for RENTAL listings here right now (not sales)? A rising rental-DOM trend means longer vacancies and softer asking-rent achievability than the comps imply.
- What's the recent tenant-quality profile in this submarket — average credit score on applications, eviction rate, late-payment / NSF rate, and stable-employment percentage? A property-management company in the area should have these aggregated.
- How much new for-sale + rental construction is in the pipeline within 1–3 miles? Heavy new supply typically softens prices + rents 12–24 months out; constrained supply supports both.
Investment metrics
- 1% rule
- 1.27% ✓
- Cap rate
- 10.23%
- Cash-on-cash
- 14.06%
- DSCR
- 1.63
- GRM
- 6.6
CMA / ARV
- ARV (on-the-fly)
- $252,324
- Comps found
- 12
Show comp detail 12 sales within ~0.75 mi
| Address | Dist | Beds/Ba | Sqft | Sold | Price | $/sf | Match |
|---|---|---|---|---|---|---|---|
| 7623 Monroe Ave | 0.10mi | 3/1.0 | 1,460 (-6%) | 2mo | $197,000 | $135 | 84 |
| 7911 Jackson Ave | 0.38mi | 4/2.0 (+1) | 1,506 (-3%) | 1mo | $334,000 | $222 | 68 |
| 7613 Monroe Ave | 0.09mi | 4/1.0 (+1) | 1,330 (-14%) | 1mo | $196,000 | $147 | 66 |
| 7840 Monroe Ave | 0.35mi | 3/1.0 | 1,379 (-11%) | 1mo | $320,000 | $232 | 65 |
| 17541 Maple Ave | 0.64mi | 3/1.5 | 1,500 (-3%) | 1mo | $245,000 | $163 | 62 |
| 3645 177th Pl | 0.73mi | 3/2.0 | 1,550 (+0%) | 1mo | $246,000 | $159 | 61 |
| 611 Broadmoor Ave | 0.59mi | 2/1.5 (-1) | 1,608 (+4%) | 0mo | $270,000 | $168 | 59 |
| 7341 Harrison Ave | 0.31mi | 4/2.0 (+1) | 1,365 (-12%) | 2mo | $201,995 | $148 | 55 |
| 1125 177th Pl | 0.67mi | 2/1.0 (-1) | 1,652 (+7%) | 2mo | $169,000 | $102 | 51 |
| 7208 Monroe Ave | 0.50mi | 3/2.0 | 1,750 (+13%) | 1mo | $289,999 | $166 | 50 |
| 921 173rd St | 0.59mi | 4/2.0 (+1) | 1,763 (+14%) | 0mo | $238,500 | $135 | 40 |
| 17759 Maple St | 0.67mi | 4/2.0 (+1) | 1,328 (-14%) | 4mo | $276,999 | $209 | 33 |
Match score weights: distance 35% · size 25% · config 20% · recency 20%. Top-matched comps best support the ARV.
Projected returns pro-forma
-3.0% appreciation · 5.51% rent growth · sell at horizon
- IRR
- 7.1%
- Equity multiple
- 1.28×
- Total profit
- $19,144
- Equity at exit
- $35,785
- IRR
- 18.5%
- Equity multiple
- 2.72×
- Total profit
- $115,327
- Equity at exit
- $20,751
Cash invested: $67,200 (down + closing). Projections, not guarantees.
Landlord ↔ Tenant lean methodology
- Overall (STATE)
- 90 Strongly Landlord-Friendly
- State Indiana
- 90 Strongly Landlord-Friendly · R+11
- County
- — inherits STATE
- City
- — inherits STATE
ZIP-level market 46324
- Home prices YoY
- -9.6%
- Rents YoY
- 5.5%
- Active inventory
- 63
- Price-to-rent
- 6.6×
Monthly cashflow live
- Estimated rent
- $3,041 high interval (Pro) →
- Mortgage (P&I)
- −$1,259
- Tax from tax record
- −$257 /mo · $3,079/yr
- Insurance
- −$100
- HOA
- −$0
- Vacancy / Maint / Mgmt
- −$639
- Net cashflow
- $787
Break-even live
UW: 25.0% down · 7.5% · 30yr · 1.5% tax · 5.0% vac · 8.0% maint · 8.0% mgmt
Financing live
Cash to close
- Down payment
- $60,000
- Closing costs
- $7,200
- Reserves months
- —
- Total cash needed
- —
Loan-product check · same deal, 3 products live
Conventional
25% down · 7.5% · 30yr
- Down + closing
- —
- Monthly P&I
- —
- Monthly cashflow
- —
- DSCR
- —
- Eligible?
- —
Personal DTI + credit; lowest rate.
DSCR
20% down · 8.5% · 30yr
- Down + closing
- —
- Monthly P&I
- —
- Monthly cashflow
- —
- DSCR
- —
- Eligible?
- —
No personal income docs; deal must DSCR.
Hard money
10% down · 12.0% · 12mo
- Down + closing
- —
- Monthly P&I
- —
- Monthly cashflow
- —
- DSCR
- —
- Eligible?
- —
Short-term bridge; refi at stabilization.
Rent comps 10 comps
| Address | Beds | Baths | Sqft | Rent | $/sqft | DOM | Units | Dist |
|---|---|---|---|---|---|---|---|---|
| 7610 Manor Ave Munster, IN | 3.0 | 2.0 | 1700 | $4,750 | $2.79 | 1d | 1 | 0.32mi |
| 7611 Kinsley Pl Munster, IN | 3.0 | 2.0 | 1700 | $4,700 | $2.76 | 1d | 1 | 0.36mi |
| 232 Gregory Ave Munster, IN | 3.0 | 1.5 | 1600 | $2,450 | $1.53 | 1d | 1 | 0.39mi |
| 7741 Hohman Ave Munster, IN | 4.0 | 2.0 | 2200 | $3,200 | $1.45 | 10d | 1 | 0.45mi |
| 8016 Monaldi Dr Munster, IN | 4.0 | 2.0 | 2000 | $2,999 | $1.50 | 10d | 1 | 0.71mi |
| 252 Lawndale St Hammond, IN | 4.0 | 3.0 | 2016 | $2,600 | $1.29 | 1d | 1 | 0.89mi |
| 18006 Wentworth Ave #3553 Lansing, IL | 2.0 | 1.0 | 1900 | $1,950 | $1.03 | 1d | 1 | 0.96mi |
| 7202 Chestnut Ave Hammond, IN | 3.0 | 2.0 | 2178 | $1,900 | $0.87 | 1d | 1 | 1.10mi |
| 7019 Chestnut Ave Hammond, IN | 3.0 | 1.5 | 1440 | $1,895 | $1.32 | 20d | 1 | 1.24mi |
| 1539 Wentworth Ave Unit 3W Calumet City, IL | 3.0 | 1.0 | 1100 | $1,700 | $1.55 | 12d | 1 | 1.24mi |
Listing history 17 events
-
2026-04-09historical
-
2026-04-09$215,000
-
2020-09-10historical
-
2020-08-12soldstatus $86,000 502-char remark
Show marketing remark (502 chars)
3 Bedroom South Hammond Cape Cod! Main floor features include living room with hardwood floors, dining room, kitchen, 2 bedrooms and full bath. Upper level master bedroom with hardwood floors, full basement. Home has a detached garage and fenced yard; home is in good condition, being sold as is. Home is currently tenant occupied with a month to month lease. NOTE: Real Estate Taxes based on no exemptions; taxes will be significantly reduced for an owner occupancy. New Central Air installed in 2020.
-
2020-05-14$99,900 502-char remark
Show marketing remark (502 chars)
3 Bedroom South Hammond Cape Cod! Main floor features include living room with hardwood floors, dining room, kitchen, 2 bedrooms and full bath. Upper level master bedroom with hardwood floors, full basement. Home has a detached garage and fenced yard; home is in good condition, being sold as is. Home is currently tenant occupied with a month to month lease. NOTE: Real Estate Taxes based on no exemptions; taxes will be significantly reduced for an owner occupancy. New Central Air installed in 2020.
-
2020-03-11$104,900
-
2015-09-28soldstatus $49,000
-
2015-02-13$49,900
-
2011-09-23historical
-
2011-03-21$115,000
-
2010-08-26historical
-
2009-09-09$123,000
-
2008-08-01$122,900
-
1999-11-17historical
-
1999-07-19$83,500
-
1999-06-22historical
-
1999-03-22$87,500
ⓘ Source: listings_history table (triggers on properties + properties_extension) + one-shot
backfill from property_details.listing_events for pre-trigger history.
Tax reassessment forecast IN · Partial reset (capped growth)
- Current annual tax
- $3,079 · $257/mo
- Projected year-2 tax
- $3,079 · $257/mo
- Expected delta
- $0/yr ($0/mo · 0.0%)
ⓘ Screening estimate from a state-policy table — verify with the county assessor before closing.
Climate risk First Street
- Flood 6/10 Major FEMA zone X (shaded) · 72% chance over 30 yrs
- Wildfire 1/10 Low
- Heat 3/10 Moderate 7 d/yr ≥102°F today · 15 d/yr by 30 yrs out
- Wind 2/10 Low 0% chance of damaging wind over 30 yrs
- Air quality 4/10 Moderate 5 unhealthy d/yr today · 6 by 30 yrs out
Nearby sold comps map
Loading sold comps map…
Walkable amenities ~0.75 mi
Loading nearby amenities…
Taxation est. · year 1
- Rental income
- $36,493
- − Mortgage interest
- −$13,444
- − Property taxes
- −$3,079
- − Insurance
- −$1,200
- − Repairs & maintenance
- −$2,919
- − Management
- −$2,919
- − Depreciation
- −$6,982
- Taxable income
- $5,950
- Est. tax owed @ 24.0%
- −$1,428
- After-tax cash flow
- $8,020/yr
For passive investors: Depreciation is non-cash, so a rental often shows a tax loss while cash-flowing — sheltering income. Rental losses are passive: they offset passive income freely, and up to $25,000/yr can offset ordinary (W-2) income if you actively participate and your MAGI is under $100k (phasing out to $0 by $150k); unused losses carry forward. On sale, claimed depreciation is recaptured at up to 25%, and gains may owe capital-gains tax (a 1031 exchange can defer both). Figures are a year-1 estimate at your 24.0% rate — not tax advice; consult a CPA.
Schools (NCES district)
- District
- School City Of Hammond
- NCES district ID
- 1804320
- Math proficiency
- 8% ▼ -18.00%
- Reading proficiency
- 18% ▼ -15.00%
- Median HH income
- $39,970
- Composite
- 11.11/100
- National rank
- #9730
- State rank
- #289 of 301 in IN
Livability — Hammond
- Score
- 70/100
- State rank
- #143
- US rank
- #7343
Category grades
Schools grade is shown separately in the Schools card above.
Census & demographics
- Census place
- Hammond, IN
- County
- Lake County · 422,878 people
- City population
- 58,809
- Metro
- Chicago-Naperville-Elgin, IL-IN-WI
- Population (ZIP)
- 21,409
- Household income
- $63,052
- Rent vs Own
- Severe rent burden
- 507.0
Population outlook (Lake County) Hauer SSP2
- Today (2025)
- 484,026 people
- By 2030
- 478,091 · -1.2%
- By 2040
- 462,974 · -4.3%
- By 2050
- 449,894 · -7.1%
- By 2075
- 436,169 · -9.9%
- By 2100
- 426,607 · -11.9%
Race, ethnicity, and origin ACS 2023
- Neighborhood character
- Diverse neighborhood (Simpson 0.69)
- Race & ethnicity
- Hispanic / Latino 39% White 34% Black 22% Two or more races 14% Asian 1% Native American 1%
- Hispanic origin (detail)
- Mexican 31% Puerto Rican 5%
- Common ancestry
- Romanian 5% Lithuanian 1% Italian 1%
- Foreign-born
- 10% · Canada
- Languages at home
- 79% English-only · Spanish 20%
Political lean MEDSL · Lake
- 2024 margin
- Lean D (+5.6) · D 52.1% · R 46.5% · Other 1.5%
- 2008→2024 swing
- -28.6pp toward R · 2008: 34.3pp · 2024: 5.6pp
- All cycles
- 2024: D+5.6 2020: D+15.1 2016: D+20.6 2012: D+31.0 2008: D+34.3
Not yet ingested
- Civics
- —
Market trends
- HPI YoY
- ▼ -37.65%
- Current HPI
- 352.8678
- Rent YoY
- ▲ 5.51%
- Metro
- Chicago-Naperville-Elgin, IL-IN-WI
- State GDP YoY
- ▲ 2.90%
- F500 in state
- 18
Industry mix (Fortune 500 HQ in IN)
| Industry | F500 HQs | Revenue |
|---|---|---|
| Industrial Machinery | 2 | $37B |
|
||
| Healthcare | 1 | $177B |
|
||
| Pharmaceuticals | 1 | $45B |
|
||
| Metals / Steel | 1 | $18B |
|
||
| Agriculture | 1 | $17B |
|
||
| Packaging | 1 | $12B |
|
||
Price history
+145.7% since first listed17 events — show timeline
- 2026-04-09 Listing Removed — NIRA MLS as Distributed by MLS Grid
- 2026-04-09 Listed $215,000 NIRA MLS as Distributed by MLS Grid
- 2020-09-10 Listing Removed — NIRA MLS as Distributed by MLS Grid
- 2020-08-12 Sold (MLS) $86,000 NIRA MLS as Distributed by MLS Grid
- 2020-05-14 Listed $99,900 NIRA MLS as Distributed by MLS Grid
- 2020-03-11 Listed $104,900 NIRA MLS as Distributed by MLS Grid
- 2015-09-28 Sold (MLS) $49,000 NIRA MLS as Distributed by MLS Grid
- 2015-02-13 Listed $49,900 NIRA MLS as Distributed by MLS Grid
- 2011-09-23 Listing Removed — NIRA MLS as Distributed by MLS Grid
- 2011-03-21 Listed $115,000 NIRA MLS as Distributed by MLS Grid
- 2010-08-26 Listing Removed — NIRA MLS as Distributed by MLS Grid
- 2009-09-09 Listed $123,000 NIRA MLS as Distributed by MLS Grid
- 2008-08-01 Listed $122,900 NIRA MLS as Distributed by MLS Grid
- 1999-11-17 Listing Removed — NIRA MLS as Distributed by MLS Grid
- 1999-07-19 Listed $83,500 NIRA MLS as Distributed by MLS Grid
- 1999-06-22 Listing Removed — NIRA MLS as Distributed by MLS Grid
- 1999-03-22 Listed $87,500 NIRA MLS as Distributed by MLS Grid
Property tax history
+12.5%/yrLatest (2024): $3,079 · -11.1% YoY. Source: county tax records.
Cash-flow waterfall
monthlySold comps — $/sqft
last 12 mo · ≤1 miLoading sold comps…