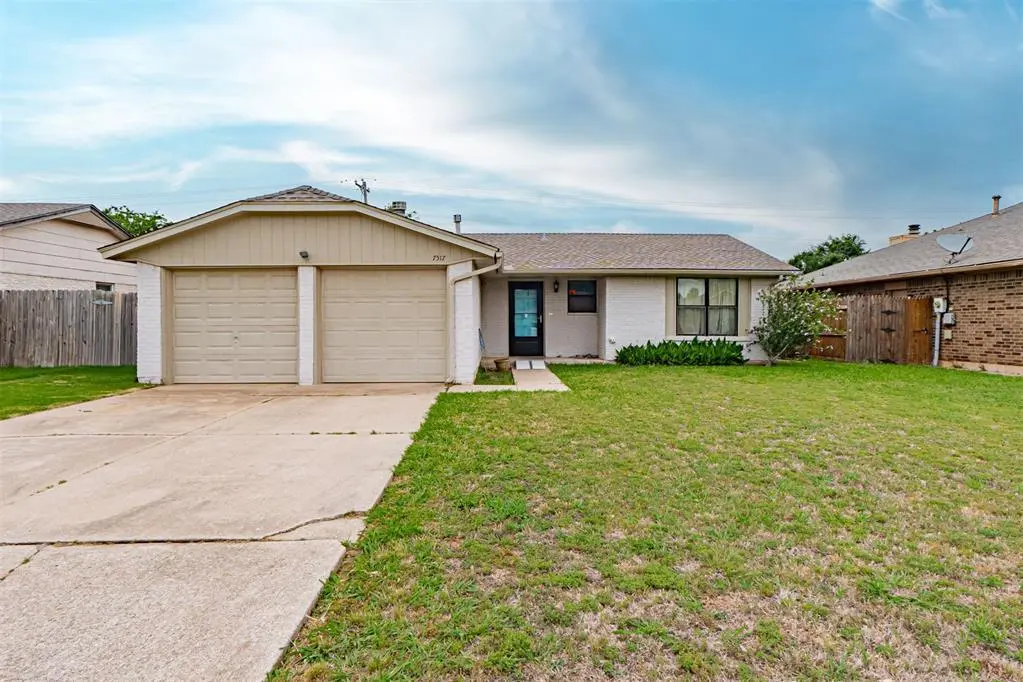
7517 NW 116th St · Oklahoma City, OK
Flood risk 1/10 · Minimal
- FEMA flood zone
- X (unshaded)
- Chance of flooding over 30 yrs
- 0.0%
- Est. flood insurance / yr
- $507 – $1,088
Fire risk 2/10 · Minimal
- Est. fire insurance / yr
- $2,463 – $4,575
Heat risk 6/10 · Moderate
- Hot days now (above 107°F)
- 7 days/yr
- Hot days in 30 yrs
- 19 days/yr
Wind risk 2/10 · Minimal
- Chance of severe wind over 30 yrs
- 2.0%
Air-quality risk 2/10 · Minimal
- Unhealthy air days now
- 1 days/yr
- Unhealthy air days in 30 yrs
- 1 days/yr
Risk factors via First Street. Map © Google.
Why this score? — see what drove the C+ grade
The composite is a weighted blend of 9 inputs, each scored 0–100. Each bar is that input's sub-score; the figure is the points it added to the 100-point composite (weight × sub-score).
- Cash flow +23.7/30.0
- ARV discount +13.4/15.0
- DSCR +7.6/10.0
- 1% rule +5.5/10.0
- Livability +4.0/5.0
- Rent growth +3.9/5.0
- Condition / age +2.5/5.0
- Schools +1.3/10.0
- Appreciation +0.0/10.0
$155,000
🖨 Deal sheet 📄 Offer letter ✓ Due diligence
Listing remarks MLS
PRICE REDUCED!!! Completely remodeled 3 bedroom home. New: Air conditioner, Interior & Exterior paint,ext trim and siding,flower beds,lighting,kitchen and bathroom flooring,master bathroom sink & toilet.
Key facts
- Tile throughout
- Laminate flooring
- Stainless appliances
Tags
Property features AI
Finance
- Other: Homestead exemption applied; Located in Roxboro Sec 1
- Financial info: Loan qualification: Yes
- HOA & community: No mandatory association dues
Exterior
- Parking: 2-car garage
- Home design: Single family residence; One level; Faces south; Residential property; Existing property
- Construction: Brick construction; Composition roof; Slab foundation; Built (existing)
- Exterior features: Covered porch; Open patio; Interior lot
Interior
- Bedrooms: 3 bedrooms
- Bathrooms: 1 full bath; 1 half bath
- Interior features: One living area; Wood-burning fireplace
Neighborhood map
What this means for you Summary
Snapshot
- This is a 3-bed/2.0-bath single-family listed at $155k.
Deal economics
- At list price, monthly cash flow is $296 ($4k/yr) — positive.
- The deal already cash-flows at list — no discount required.
- Meets the 1% rule at list price ($2k rent vs $155k).
- Cap rate 8.6% vs local median 3.7% in Oklahoma City — top-decile yield for the area; either an underpriced asset or a hidden risk that comps aren't pricing in. Stress-test before assuming the spread holds.
Location & tenants
- Location reads 80/100 on livability (#3 in OK, #1,635 nationally) — a professional / high-income tenant draw. Strengths: amenities A+, commute A+, cost of living A+; Watch: crime F.
- Putnam City (urban): math 12% / reading 16% proficiency, ranked #227 of 270 in OK (top 84%) — low school quality limits family demand, transient renter base, plan for 1-2y turnover; 65% free/reduced lunch — lower-income household profile, screen leases tightly.
- Zoned schools: Ralph Downs Es (math 32% / reading 32%, grade F, #213 of 845 statewide, top 28%, 416 students, 0% FRL); Putnam City North Hs (math 18% / reading 29%, grade F, #218 of 447 statewide, top 49%, 1,579 students, 0% FRL) — zoned schools average 0% FRL vs 65% district-wide (65 pts lower); this property's tenant base skews higher-income than the district average.
- Zoned-school proficiency averages 28% at this address vs 14% district-wide (+14 pts) — the actual schools serving this property are materially stronger than the Putnam City average implies; a family-tenant draw the district grade alone would hide.
- Market conditions: Rents rising fast (+5.6%/yr); 166 active listings in the ZIP; 25 comparable units currently listed for rent nearby; rentals at typical pace (median 17d on market — plan ~3-4 weeks tenant-placement turnaround); solid renter incomes; 5,365 units permitted in Oklahoma County in 2024 (569 in 5+ unit buildings).
Forward outlook
- Local home prices are declining (-3.0%/yr); year-one equity from $1k of loan paydown is wiped out by about $5k of value loss. Plan a longer hold.
- Oklahoma County population projected at +41% by 2050 — long-run rental-demand tailwind backs the buy-and-hold thesis.
- At projected returns (-3.0% appreciation + 5.6% rent growth), your $43k cash investment doubles in ~10 years — after that, you're playing with house money.
Negotiation context
- Only 3 days on market — expect competitive offers; lowballing is unlikely to land.
- 3 sale attempts since 23y ago with the ask held roughly flat each time — persistent listings suggest the price (not the market) is what's stuck; bring a comps-based counter.
- Current owner paid $90k; list at $155k implies a 71% gain — meaningful room to come down on a strong offer.
Risks & watch-outs
- Climate carrying-cost: extreme-heat days projected 7→19/yr by 2055 (HVAC capex compounding) — expect insurance premiums to compound above CPI over the hold.
Questions for the listing agent
- Is there a deadline driving the sale (1031 exchange, divorce, estate, relocation)? That informs how much negotiation room exists.
- Schools are F-rated, which usually means shorter tenancies and higher turnover. Who's the typical renter profile here, and what's been the actual vacancy rate?
- Crime grade is F in this area — have there been break-ins, vandalism, or insurance claims at this property in the last 3 years? What carrier currently insures it and at what premium?
- What's the average days-on-market for RENTAL listings here right now (not sales)? A rising rental-DOM trend means longer vacancies and softer asking-rent achievability than the comps imply.
- What's the recent tenant-quality profile in this submarket — average credit score on applications, eviction rate, late-payment / NSF rate, and stable-employment percentage? A property-management company in the area should have these aggregated.
- How much new for-sale + rental construction is in the pipeline within 1–3 miles? Heavy new supply typically softens prices + rents 12–24 months out; constrained supply supports both.
Investment metrics
- 1% rule
- 1.05% ✓
- Cap rate
- 8.58%
- Cash-on-cash
- 8.18%
- DSCR
- 1.36
- GRM
- 7.9
CMA / ARV
- ARV (on-the-fly)
- $178,500
- Comps found
- 3
Show comp detail 3 sales within ~0.75 mi
| Address | Dist | Beds/Ba | Sqft | Sold | Price | $/sf | Match |
|---|---|---|---|---|---|---|---|
| 7524 NW 114th St | 0.14mi | 3/2.0 | 1,055 (+0%) | 2mo | $185,300 | $176 | 91 |
| 7536 NW 115th St | 0.09mi | 3/2.0 | 1,160 (+10%) | 2mo | $197,000 | $170 | 77 |
| 11412 Matthews Ave | 0.17mi | 3/2.0 | 1,186 (+13%) | 8mo | $140,000 | $118 | 64 |
Match score weights: distance 35% · size 25% · config 20% · recency 20%. Top-matched comps best support the ARV.
Projected returns pro-forma
-3.0% appreciation · 5.59% rent growth · sell at horizon
- IRR
- -1.1%
- Equity multiple
- 0.96×
- Total profit
- $-1,933
- Equity at exit
- $23,111
- IRR
- 11.0%
- Equity multiple
- 1.95×
- Total profit
- $41,355
- Equity at exit
- $13,402
Cash invested: $43,400 (down + closing). Projections, not guarantees.
Landlord ↔ Tenant lean methodology
- Overall (STATE)
- 83 Strongly Landlord-Friendly
- State Oklahoma
- 83 Strongly Landlord-Friendly · R+20
- County
- — inherits STATE
- City
- — inherits STATE
ZIP-level market 73162
- Rents YoY
- 5.6%
- Active inventory
- 166
- Price-to-rent
- 7.9×
Monthly cashflow live
- Estimated rent
- $1,631 high interval (Pro) →
- Mortgage (P&I)
- −$813
- Tax from tax record
- −$115 /mo · $1,380/yr
- Insurance
- −$65
- HOA
- −$0
- Vacancy / Maint / Mgmt
- −$342
- Net cashflow
- $296
Break-even live
UW: 25.0% down · 7.5% · 30yr · 1.5% tax · 5.0% vac · 8.0% maint · 8.0% mgmt
Financing live
Cash to close
- Down payment
- $38,750
- Closing costs
- $4,650
- Reserves months
- —
- Total cash needed
- —
Loan-product check · same deal, 3 products live
Conventional
25% down · 7.5% · 30yr
- Down + closing
- —
- Monthly P&I
- —
- Monthly cashflow
- —
- DSCR
- —
- Eligible?
- —
Personal DTI + credit; lowest rate.
DSCR
20% down · 8.5% · 30yr
- Down + closing
- —
- Monthly P&I
- —
- Monthly cashflow
- —
- DSCR
- —
- Eligible?
- —
No personal income docs; deal must DSCR.
Hard money
10% down · 12.0% · 12mo
- Down + closing
- —
- Monthly P&I
- —
- Monthly cashflow
- —
- DSCR
- —
- Eligible?
- —
Short-term bridge; refi at stabilization.
Rent comps 25 comps
| Address | Beds | Baths | Sqft | Rent | $/sqft | DOM | Units | Dist |
|---|---|---|---|---|---|---|---|---|
| 7501 NW 115th St Oklahoma City, OK | 3.0 | 2.0 | 1387 | $1,560 | $1.12 | 2d | 1 | 0.08mi |
| 7137 NW 116th St Unit 7137 Oklahoma City, OK | 3.0 | 2.0 | 1465 | $1,350 | $0.92 | 24d | 1 | 0.51mi |
| 7136 NW 115th St Unit 7138 Oklahoma City, OK | 3.0 | 2.0 | 1489 | $1,325 | $0.89 | 24d | 1 | 0.54mi |
| 24 Redstone Blvd Oklahoma City, OK | 2.0 | 1.0–2.0 | 857 | $1,950 | $2.27 | 2d | 11 | 0.70mi |
| 8000 NW 110th Dr Oklahoma City, OK | 3.0 | 2.0 | 1445 | $1,745 | $1.21 | 15d | 1 | 0.79mi |
| 8016 NW 110th Dr Oklahoma City, OK | 3.0 | 2.0 | 1445 | $1,695 | $1.17 | 12d | 1 | 0.80mi |
| 8024 NW 110th Dr Oklahoma City, OK | 3.0 | 2.0 | 1445 | $1,695 | $1.17 | 24d | 1 | 0.81mi |
| 6801 NW 122nd St Oklahoma City, OK | 1.0–3.0 | 1.0–2.0 | 952 | $1,350 | $1.42 | 2d | 7 | 0.84mi |
| 10800 N Council Rd Oklahoma City, OK | 2.0 | 2.0 | 900 | $899 | $1.00 | 15d | 1 | 0.92mi |
| 10723 Lawson Place Rd Oklahoma City, OK | 3.0 | 2.0 | 1200 | $1,495 | $1.25 | 24d | 1 | 0.93mi |
| 10526 Utica Dr Oklahoma City, OK | 3.0 | 2.0 | 1200 | $1,545 | $1.29 | 24d | 1 | 1.01mi |
| 6701 NW 124th Ter Oklahoma City, OK | 4.0 | 2.0 | 1384 | $1,650 | $1.19 | 2d | 1 | 1.02mi |
| 8012 NW 105th St Oklahoma City, OK | 3.0 | 2.0 | 1200 | $1,495 | $1.25 | 12d | 1 | 1.04mi |
| 8002 NW 105th Ter Unit A Oklahoma City, OK | 3.0 | 2.0 | 1200 | $1,495 | $1.25 | 15d | 1 | 1.07mi |
| 10522 Harvest Moon Ave Oklahoma City, OK | 3.0 | 2.5 | 1500 | $1,395 | $0.93 | 24d | 1 | 1.11mi |
| 10400 N Council Rd Apt 323 Oklahoma City, OK | 2.0 | 2.0 | 962 | $1,000 | $1.04 | 20d | 1 | 1.12mi |
| 10400 N Council Rd Unit 315 Oklahoma City, OK | 2.0 | 2.0 | 962 | $1,000 | $1.04 | 24d | 1 | 1.12mi |
| 10400 N Council Rd Unit 321 Oklahoma City, OK | 2.0 | 2.0 | 885 | $949 | $1.07 | 24d | 1 | 1.12mi |
| 10411 White Oak Canyon Rd Oklahoma City, OK | 2.0 | 2.0 | 1158 | $1,225 | $1.06 | 4d | 1 | 1.24mi |
| 7028 Elk Canyon Rd Oklahoma City, OK | 3.0 | 2.0 | 1404 | $1,495 | $1.06 | 17d | 1 | 1.33mi |
| 12008 Brinley Reign Dr Yukon, OK | 3.0 | 2.0 | 1382 | $1,850 | $1.34 | 24d | 1 | 1.44mi |
| 11608 Mackenzie Way Yukon, OK | 3.0 | 2.5 | 1259 | $1,545 | $1.23 | 15d | 1 | 1.45mi |
| 11608 Mackenzie Way Yukon, OK | 3.0 | 2.5 | 1259 | $1,495 | $1.19 | 11d | 1 | 1.45mi |
| 11606 Mackenzie Way Yukon, OK | 3.0 | 2.0 | 1215 | $2,850 | $2.35 | 24d | 1 | 1.45mi |
| 11505 Mackenzie Way Yukon, OK | 3.0 | 2.0 | 1200 | $1,495 | $1.25 | 20d | 1 | 1.49mi |
Listing history 3 events
-
2026-06-08status $155,000 Pending 3 DOM
-
2026-06-07remarks 699-char remark
-
2026-06-07$155,000 Active 3 DOM
ⓘ Source: listings_history table (triggers on properties + properties_extension) + one-shot
backfill from property_details.listing_events for pre-trigger history.
Tax reassessment forecast OK · Resets to sale price
- Current annual tax
- $1,380 · $115/mo
- Projected year-2 tax
- $1,395 · $116/mo
- Expected delta
- +$16/yr (+$1/mo · 1.1%)
ⓘ Screening estimate from a state-policy table — verify with the county assessor before closing.
Climate risk First Street
- Flood 1/10 Low FEMA zone X (unshaded) · 0% chance over 30 yrs
- Wildfire 2/10 Low
- Heat 6/10 Major 7 d/yr ≥107°F today · 19 d/yr by 30 yrs out
- Wind 2/10 Low 2% chance of damaging wind over 30 yrs
- Air quality 2/10 Low 1 unhealthy d/yr today · 1 by 30 yrs out
Nearby sold comps map
Loading sold comps map…
Walkable amenities ~0.75 mi
Loading nearby amenities…
Taxation est. · year 1
- Rental income
- $19,569
- − Mortgage interest
- −$8,682
- − Property taxes
- −$1,380
- − Insurance
- −$775
- − Repairs & maintenance
- −$1,566
- − Management
- −$1,566
- − Depreciation
- −$4,509
- Taxable income
- $1,092
- Est. tax owed @ 24.0%
- −$262
- After-tax cash flow
- $3,289/yr
For passive investors: Depreciation is non-cash, so a rental often shows a tax loss while cash-flowing — sheltering income. Rental losses are passive: they offset passive income freely, and up to $25,000/yr can offset ordinary (W-2) income if you actively participate and your MAGI is under $100k (phasing out to $0 by $150k); unused losses carry forward. On sale, claimed depreciation is recaptured at up to 25%, and gains may owe capital-gains tax (a 1031 exchange can defer both). Figures are a year-1 estimate at your 24.0% rate — not tax advice; consult a CPA.
Schools (NCES district)
- District
- Putnam City
- NCES district ID
- 4025290
- Math proficiency
- 12% ▼ -18.00%
- Reading proficiency
- 16% ▼ -14.00%
- Median HH income
- $46,657
- Composite
- 12.61/100
- National rank
- #9614
- State rank
- #227 of 270 in OK
Livability — Oklahoma City
- Score
- 80/100
- State rank
- #3
- US rank
- #1635
Category grades
Schools grade is shown separately in the Schools card above.
Census & demographics
- Census place
- Oklahoma City, OK
- County
- Oklahoma County · 771,644 people
- City population
- 498,656
- Metro
- Oklahoma City, OK
- Population (ZIP)
- 28,728
- Household income
- $88,031
- Rent vs Own
- Severe rent burden
- 913.0
Population outlook (Oklahoma County) Hauer SSP2
- Today (2025)
- 911,875 people
- By 2030
- 982,413 · +7.7%
- By 2040
- 1,130,468 · +24.0%
- By 2050
- 1,288,422 · +41.3%
- By 2075
- 1,711,482 · +87.7%
- By 2100
- 2,088,448 · +129.0%
Race, ethnicity, and origin ACS 2023
- Neighborhood character
- Diverse neighborhood (Simpson 0.59)
- Race & ethnicity
- White 62% Black 14% Two or more races 11% Hispanic / Latino 8% Asian 6% Native American 2%
- Hispanic origin (detail)
- Mexican 5%
- Common ancestry
- Slovak 4% Italian 2% Serbian 1%
- Foreign-born
- 8% · Vietnam, Canada, China
- Languages at home
- 90% English-only · Spanish 4% Vietnamese 2% Other Asian/Pacific 1%
Political lean MEDSL · Oklahoma
- 2024 margin
- Toss-up / Even · D 48.0% · R 49.7% · Other 2.3%
- 2008→2024 swing
- +15.1pp toward D · 2008: -16.8pp · 2024: -1.7pp
- All cycles
- 2024: R+1.7 2020: R+1.1 2016: R+10.5 2012: R+16.7 2008: R+16.8
Not yet ingested
- Civics
- —
Market trends
- HPI YoY
- ▼ -172.35%
- Current HPI
- 205.6639
- Rent YoY
- ▲ 5.59%
- Metro
- Oklahoma City, OK
- State GDP YoY
- ▲ 1.55%
- F500 in state
- 6
Industry mix (Fortune 500 HQ in OK)
| Industry | F500 HQs | Revenue |
|---|---|---|
| Energy | 3 | $48B |
|
||
Price history
+244.4% since first listed9 events — show timeline
- 2026-06-04 Listed $155,000 MLSOK
- 2007-02-06 Sold (Public Records) $90,500 Public Records
- 2007-02-02 Sold (MLS) $90,500 MLSOK
- 2006-10-05 Listed $94,900 MLSOK
- 2003-09-08 Sold (Public Records) $76,500 Public Records
- 2003-08-29 Sold (MLS) $76,500 MLSOK
- 2003-07-27 Listed $74,900 MLSOK
- 1997-12-30 Sold (Public Records) $62,000 Public Records
- 1992-12-28 Sold (Public Records) $45,000 Public Records
Property tax history
+2.1%/yrLatest (2025): $1,380 · +0.7% YoY. Source: county tax records.
Cash-flow waterfall
monthlySold comps — $/sqft
last 12 mo · ≤1 miLoading sold comps…