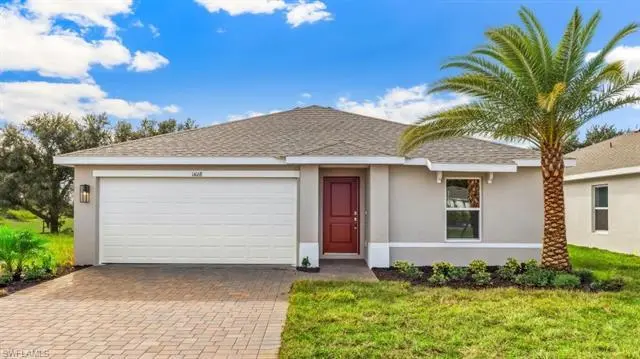
383 Radiant Sun Ln · Lehigh Acres, FL
Flood risk No data
- FEMA flood zone
- —
- Chance of flooding over 30 yrs
- —
- Est. flood insurance / yr
- —
Fire risk No data
- Est. fire insurance / yr
- —
Heat risk No data
- Hot days now (above threshold)
- —
- Hot days in 30 yrs
- —
Wind risk No data
- Chance of severe wind over 30 yrs
- —
Air-quality risk No data
- Unhealthy air days now
- —
- Unhealthy air days in 30 yrs
- —
Risk factors via First Street. Map © Google.
Why this score? — see what drove the F grade
The composite is a weighted blend of 9 inputs, each scored 0–100. Each bar is that input's sub-score; the figure is the points it added to the 100-point composite (weight × sub-score).
- Cash flow +7.5/30.0
- ARV discount +7.5/15.0
- Schools +4.1/10.0
- Livability +3.0/5.0
- 1% rule +2.6/10.0
- Condition / age +2.5/5.0
- Rent growth +2.3/5.0
- DSCR +1.6/10.0
- Appreciation +0.0/10.0
$274,990
🖨 Deal sheet 📄 Offer letter ✓ Due diligence
Listing remarks
Discover this spacious 4-bedroom, 2-bath home with a 2-car garage, offering modern design and comfortable living. The thoughtfully designed floor plan provides generous living space, ideal for families or guests. Conveniently located near Mirror Lakes Elementary School, Harns Marsh Middle School, and East Lee County High School, with close proximity to a neighborhood park and green space perfect for outdoor enjoyment and daily walks, as well as Veterans Park and Recreation Center, featuring sports courts, walking trails, and family amenities. Residents also benefit from easy access to shopping and dining along Lee Blvd and the beaches, offering a balance of peaceful residential living and S
Key facts
- Green space
- Modern design
- Sports courts
Tags
Property features AI
Finance
- HOA & community: Mandatory HOA (professional management); Monthly HOA fee; HOA amenities include streetlights and underground utilities; One-time fee due: $1,950; Total annual recurring HOA fees: $1,068
Exterior
- Parking: Attached 2-car garage; Paved driveway
- Security: Gated community
- Utilities: Central water; Central sewer; Cable available
- Home design: Residential single-family home; 1-story / ranch; Rear exposure faces east; Located in the Avalon development
- Construction: Concrete block and poured concrete construction; Stucco exterior; Shingle roof; Year built 2025
- Exterior features: Private road; Room for a pool; Automatic sprinkler system; Shutters (manual); Landscaped view
Interior
- Kitchen: Walk-in pantry; Dishwasher; Disposal; Microwave; Range; Self-cleaning oven; Refrigerator
- Bedrooms: 4 bedrooms; Split bedroom layout
- Flooring: Vinyl flooring
- Bathrooms: 2 full bathrooms; Master bathroom with dual sinks and shower (no tub)
- Heating & cooling: Central electric heat; Central electric cooling
- Interior features: Built-in cabinets; Cable prewire; High-speed internet available; Pantry; Smoke detectors; Walk-in closet; Laundry in residence; Home automation; Unfurnished
- Laundry & utility: Washer/dryer hookup; Auto garage door
Neighborhood map
What this means for you Summary
Snapshot
- This is a 4-bed/2.0-bath land listed at $275k.
Deal economics
- At list price, monthly cash flow is $-345 ($-4k/yr) — negative.
- To cash-flow at today's rent, offer at most $225k (18.1% below list).
- To meet the 1% rule (rent ≥ 1% of price), the offer needs to be $208k (24.3% below list).
- Recommended offer: $208k (24.3% below list) — sets the bar for 1% rule.
Location & tenants
- Location reads 59/100 on livability (#826 in FL) — a working-class tenant base; expect higher turnover. Strengths: cost of living A+, housing A+; Watch: crime C-, employment D+, amenities F.
- Lee (suburban): math 47% / reading 50% proficiency, ranked #42 of 73 in FL (top 58%) — families likely to look elsewhere, expect single-tenant / working-renter base with shorter leases.
- Zoned schools: Mirror Lakes Elementary School (math 48% / reading 45%, grade D-, #1,223 of 2,144 statewide, top 57%, 1,228 students, 68% FRL); East Lee County High School (math 18% / reading 29%, grade F, #533 of 667 statewide, top 80%, 1,896 students, 61% FRL).
- Zoned-school proficiency averages 35% at this address vs 48% district-wide (-14 pts) — the specific schools serving this property underperform the Lee average; the district grade overstates school quality for this exact location.
- Market conditions: Rents soft (-0.8%/yr); 641 active listings in the ZIP; 40 comparable units currently listed for rent nearby; rentals at typical pace (median 24d on market — plan ~3-4 weeks tenant-placement turnaround); 15,411 units permitted in Lee County in 2024 (4,686 in 5+ unit buildings).
- At $2,081/mo this rent would consume 49% of the median local household income ($51k/yr) (locally 1027% of renters already pay >50% of income on rent) — very limited rent-growth headroom before tenants either downsize or default.
Forward outlook
- Local home prices are declining (-3.0%/yr); year-one equity from $2k of loan paydown is wiped out by about $8k of value loss. Plan a longer hold.
- Lee County population projected at +44% by 2050 — long-run rental-demand tailwind backs the buy-and-hold thesis.
Negotiation context
- Only 10 days on market — expect competitive offers; lowballing is unlikely to land.
Questions for the listing agent
- What do current leases actually rent for vs. the listed asking? Can we see a recent rent roll and the last 12 months of T-12 income?
- What does the HOA fee cover, when was the last increase, and are there any pending special assessments or reserve-fund shortfalls?
- Is there a deadline driving the sale (1031 exchange, divorce, estate, relocation)? That informs how much negotiation room exists.
- Schools are D-rated, which usually means shorter tenancies and higher turnover. Who's the typical renter profile here, and what's been the actual vacancy rate?
- The area grade is low — what's the realistic commute time and amenity access for the typical tenant pool here? Any planned neighborhood developments (good or bad) we should know about?
- What's the average days-on-market for RENTAL listings here right now (not sales)? A rising rental-DOM trend means longer vacancies and softer asking-rent achievability than the comps imply.
- What's the recent tenant-quality profile in this submarket — average credit score on applications, eviction rate, late-payment / NSF rate, and stable-employment percentage? A property-management company in the area should have these aggregated.
- How much new for-sale + rental construction is in the pipeline within 1–3 miles? Heavy new supply typically softens prices + rents 12–24 months out; constrained supply supports both.
Investment metrics
- 1% rule
- 0.76% ✗
- Cap rate
- 4.79%
- Cash-on-cash
- -5.37%
- DSCR
- 0.76
- GRM
- 11.0
CMA / ARV
No comps found within radius.
Projected returns pro-forma
-3.0% appreciation · 0.0% rent growth · sell at horizon
- IRR
- -29.0%
- Equity multiple
- 0.06×
- Total profit
- $-72,516
- Equity at exit
- $41,002
- IRR
- -48.3%
- Equity multiple
- -0.49×
- Total profit
- $-114,621
- Equity at exit
- $23,776
Cash invested: $76,997 (down + closing). Projections, not guarantees.
Landlord ↔ Tenant lean methodology
- Overall (STATE)
- 87 Strongly Landlord-Friendly
- State Florida
- 87 Strongly Landlord-Friendly · R+3
- County
- — inherits STATE
- City
- — inherits STATE
ZIP-level market 33936
- Home prices YoY
- -19.9%
- Rents YoY
- -0.8%
- Active inventory
- 641
- Price-to-rent
- 11.0×
Monthly cashflow live
- Estimated rent
- $2,081 high interval (Pro) →
- Mortgage (P&I)
- −$1,442
- Tax est. 1.5%
- −$344 /mo · $4,125/yr
- Insurance
- −$115
- HOA
- −$88
- Vacancy / Maint / Mgmt
- −$437
- Net cashflow
- $-345
Break-even live
UW: 25.0% down · 7.5% · 30yr · 1.5% tax · 5.0% vac · 8.0% maint · 8.0% mgmt
Financing live
Cash to close
- Down payment
- $68,748
- Closing costs
- $8,250
- Reserves months
- —
- Total cash needed
- —
Loan-product check · same deal, 3 products live
Conventional
25% down · 7.5% · 30yr
- Down + closing
- —
- Monthly P&I
- —
- Monthly cashflow
- —
- DSCR
- —
- Eligible?
- —
Personal DTI + credit; lowest rate.
DSCR
20% down · 8.5% · 30yr
- Down + closing
- —
- Monthly P&I
- —
- Monthly cashflow
- —
- DSCR
- —
- Eligible?
- —
No personal income docs; deal must DSCR.
Hard money
10% down · 12.0% · 12mo
- Down + closing
- —
- Monthly P&I
- —
- Monthly cashflow
- —
- DSCR
- —
- Eligible?
- —
Short-term bridge; refi at stabilization.
Rent comps 40 comps
| Address | Beds | Baths | Sqft | Rent | $/sqft | DOM | Units | Dist |
|---|---|---|---|---|---|---|---|---|
| 532 Ilaria Ct Lehigh Acres, FL | 4.0 | 2.0 | 1598 | $2,300 | $1.44 | 15d | 1 | 0.12mi |
| 477 Rayford St Lehigh Acres, FL | 4.0 | 3.0 | 1715 | $2,000 | $1.17 | 23d | 1 | 0.29mi |
| 472 Rajah St Lehigh Acres, FL | 3.0 | 2.0 | 1715 | $2,200 | $1.28 | 3d | 1 | 0.32mi |
| 351 Ranchito Ave Lehigh Acres, FL | 3.0 | 2.5 | 1500 | $2,000 | $1.33 | 23d | 1 | 0.34mi |
| 337 Rancho Ave Lehigh Acres, FL | 3.0 | 2.0 | 1723 | $2,150 | $1.25 | 23d | 1 | 0.36mi |
| 20055 Lake Vista Cir N Lehigh Acres, FL | 3.0 | 2.0 | 1442 | $1,700 | $1.18 | 23d | 1 | 0.36mi |
| 467 Raymer St Lehigh Acres, FL | 4.0 | 2.0 | 1833 | $1,850 | $1.01 | 10d | 1 | 0.36mi |
| 19933 Lake Vista Cir Lehigh Acres, FL | 3.0 | 2.0 | 1776 | $1,750 | $0.99 | 19d | 1 | 0.42mi |
| 286 Justene Cir Lehigh Acres, FL | 3.0 | 2.0 | 1839 | $1,900 | $1.03 | 23d | 1 | 0.44mi |
| 334 Ranch Ave Lehigh Acres, FL | 3.0 | 2.0 | 1645 | $2,150 | $1.31 | 3d | 1 | 0.45mi |
| 19949 Lake Vista Cir Unit 16C Lehigh Acres, FL | 3.0 | 2.0 | 1517 | $1,600 | $1.05 | 23d | 1 | 0.46mi |
| 19949 Lake Vista Cir N #1 Lehigh Acres, FL | 3.0 | 2.0 | 1442 | $1,800 | $1.25 | 23d | 1 | 0.47mi |
| 374 Compese Ave S Lehigh Acres, FL | 3.0 | 2.0 | 1200 | $1,750 | $1.46 | 15d | 1 | 0.48mi |
| 448 Reading St Lehigh Acres, FL | 3.0 | 2.0 | 1100 | $1,890 | $1.72 | 3d | 1 | 0.56mi |
| 506 Corinne Dr Unit 506 Lehigh Acres, FL | 3.0 | 2.0 | 1706 | $2,300 | $1.35 | 23d | 1 | 0.61mi |
| 397 Carrillon Ave S Lehigh Acres, FL | 3.0 | 2.0 | 1200 | $1,550 | $1.29 | 3d | 1 | 0.62mi |
| 20012 Petrucka Cir N Unit D Lehigh Acres, FL | 3.0 | 2.0 | 1517 | $1,750 | $1.15 | 23d | 1 | 0.62mi |
| 270 Silent Lake Dr Lehigh Acres, FL | 4.0 | 2.0 | 1800 | $1,895 | $1.05 | 11d | 1 | 0.64mi |
| 437 Reading St Lehigh Acres, FL | 4.0 | 2.0 | 1833 | $1,795 | $0.98 | 1d | 1 | 0.67mi |
| 438 Poplar St Lehigh Acres, FL | 3.0 | 2.0 | 1640 | $2,150 | $1.31 | 3d | 1 | 0.71mi |
| 10507 Crossback Ln Lehigh Acres, FL | 3.0 | 2.0 | 1672 | $1,800 | $1.08 | 23d | 1 | 0.79mi |
| 264 Ground Dove Cir Lehigh Acres, FL | 4.0 | 2.0 | 1683 | $2,300 | $1.37 | 23d | 1 | 0.79mi |
| 463 Piedmont St Unit 463 Lehigh Acres, FL | 3.0 | 2.0 | 1200 | $1,350 | $1.12 | 3d | 1 | 0.82mi |
| 19931 Green Pasture Rd Lehigh Acres, FL | 4.0 | 2.0 | 1817 | $2,248 | $1.24 | 23d | 1 | 0.84mi |
| 202 Eaglesmere Dr Lehigh Acres, FL | 3.0 | 2.0 | 1443 | $1,600 | $1.11 | 3d | 1 | 0.84mi |
| 202 Eaglesmere Dr Lehigh Acres, FL | 3.0 | 2.0 | 1443 | $1,695 | $1.17 | 23d | 1 | 0.84mi |
| 713 Cardinal St E Lehigh Acres, FL | 3.0 | 2.0 | 1100 | $1,635 | $1.49 | 3d | 1 | 0.85mi |
| 333 Pinehurst Ave Lehigh Acres, FL | 3.0 | 2.0 | 1545 | $2,100 | $1.36 | 23d | 1 | 0.85mi |
| 404 Chalet Ave S Lehigh Acres, FL | 3.0 | 2.0 | 1200 | $1,850 | $1.54 | 23d | 1 | 0.86mi |
| 448 Grant Blvd Unit 1 Lehigh Acres, FL | 3.0 | 2.0 | 1244 | $1,650 | $1.33 | 21d | 1 | 0.87mi |
| 406 Chalet Ave S Lehigh Acres, FL | 3.0 | 2.0 | 1200 | $1,850 | $1.54 | 23d | 1 | 0.87mi |
| 510 Caywood Ave S Lehigh Acres, FL | 3.0 | 2.0 | 1582 | $2,664 | $1.68 | 23d | 1 | 0.87mi |
| 10353 Canal Brook Ln Lehigh Acres, FL | 3.0 | 2.0 | 1541 | $2,049 | $1.33 | 23d | 1 | 0.88mi |
| 442 Grant Blvd Lehigh Acres, FL | 3.0 | 2.0 | 1199 | $1,625 | $1.36 | 13d | 1 | 0.89mi |
| 20190 Caroline Creek Pl Unit 250 Lehigh Acres, FL | 3.0 | 2.0 | 1448 | $2,200 | $1.52 | 23d | 1 | 0.89mi |
| 20190 Caroline Creek Pl Unit 250 Lehigh Acres, FL | 3.0 | 2.0 | 1448 | $1,900 | $1.31 | 3d | 1 | 0.89mi |
| 10531 Canal Brook Ln Lehigh Acres, FL | 4.0 | 2.0 | 1828 | $2,300 | $1.26 | 15d | 1 | 0.94mi |
| 515 Croydon Ave S Lehigh Acres, FL | 3.0 | 3.0 | 1253 | $2,200 | $1.76 | 3d | 1 | 0.95mi |
| 727 Cane St E Lehigh Acres, FL | 3.0 | 2.0 | 1582 | $2,000 | $1.26 | 23d | 1 | 0.95mi |
| 242 S Lake Dr Lehigh Acres, FL | 3.0 | 2.0 | 1572 | $1,600 | $1.02 | 23d | 1 | 0.97mi |
HOA detail
- Monthly dues
- $88 · $1,056/yr
Listing history 2 events
-
2026-05-04status Pending
-
2026-04-24$274,990 Active
ⓘ Source: listings_history table (triggers on properties + properties_extension) + one-shot
backfill from property_details.listing_events for pre-trigger history.
Nearby sold comps map
Loading sold comps map…
Walkable amenities ~0.75 mi
Loading nearby amenities…
Taxation est. · year 1
- Rental income
- $24,970
- − Mortgage interest
- −$15,404
- − Property taxes
- −$4,125
- − Insurance
- −$1,375
- − Repairs & maintenance
- −$1,998
- − Management
- −$1,998
- − HOA
- −$1,056
- − Depreciation
- −$8,000
- Taxable loss
- −$8,984
- Est. tax savings @ 24.0%
- +$2,156
- After-tax cash flow
- $-1,978/yr
For passive investors: Depreciation is non-cash, so a rental often shows a tax loss while cash-flowing — sheltering income. Rental losses are passive: they offset passive income freely, and up to $25,000/yr can offset ordinary (W-2) income if you actively participate and your MAGI is under $100k (phasing out to $0 by $150k); unused losses carry forward. On sale, claimed depreciation is recaptured at up to 25%, and gains may owe capital-gains tax (a 1031 exchange can defer both). Figures are a year-1 estimate at your 24.0% rate — not tax advice; consult a CPA.
Schools (NCES district)
- District
- Lee
- NCES district ID
- 1201080
- Math proficiency
- 47% ▼ -11.00%
- Reading proficiency
- 50% ▼ -4.00%
- Median HH income
- $49,518
- Composite
- 41.49/100
- National rank
- #3458
- State rank
- #42 of 73 in FL
Livability — Lehigh Acres
- Score
- 59/100
- State rank
- #826
- US rank
- #20055
Category grades
Schools grade is shown separately in the Schools card above.
Census & demographics
- Census place
- Lehigh Acres, FL
- County
- Lee County · 788,662 people
- City population
- 130,638
- Metro
- Cape Coral-Fort Myers, FL
- Population (ZIP)
- 27,967
- Household income
- $51,417
- Rent vs Own
- Severe rent burden
- 1027.0
Population outlook (Lee County) Hauer SSP2
- Today (2025)
- 871,946 people
- By 2030
- 955,468 · +9.6%
- By 2040
- 1,113,587 · +27.7%
- By 2050
- 1,256,891 · +44.1%
- By 2075
- 1,560,270 · +78.9%
- By 2100
- 1,726,848 · +98.0%
Race, ethnicity, and origin ACS 2023
- Neighborhood character
- Diverse neighborhood (Simpson 0.63)
- Race & ethnicity
- Hispanic / Latino 44% White 41% Two or more races 21% Black 9% Asian 1%
- Hispanic origin (detail)
- Mexican 7% Puerto Rican 9% Cuban 18% Dominican 2%
- Common ancestry
- Hispanic 3% Romanian 2% Lithuanian 1%
- Foreign-born
- 28% · Canada, Jamaica
- Languages at home
- 59% English-only · Spanish 36% French/Haitian/Cajun 3% Tagalog/Filipino 1%
Political lean MEDSL · Lee
- 2024 margin
- Strong R (+28.4) · D 35.5% · R 63.9%
- 2008→2024 swing
- -18.0pp toward R · 2008: -10.4pp · 2024: -28.4pp
- All cycles
- 2024: R+28.4 2020: R+19.2 2016: R+20.4 2012: R+16.6 2008: R+10.4
Not yet ingested
- Civics
- —
Market trends
- HPI YoY
- ▼ -86.78%
- Current HPI
- 348.8631
- Rent YoY
- ▼ -0.77%
- Metro
- Cape Coral-Fort Myers, FL
- State GDP YoY
- ▲ 3.28%
- F500 in state
- 36
Industry mix (Fortune 500 HQ in FL)
| Industry | F500 HQs | Revenue |
|---|---|---|
| Industrial Technology | 2 | $29B |
|
||
| Insurance | 2 | $17B |
|
||
| Retail | 1 | $60B |
|
||
| Technology Distribution | 1 | $58B |
|
||
| Homebuilding | 1 | $35B |
|
||
| Technology Manufacturing | 1 | $35B |
|
||
Price history
2 events — show timeline
- 2026-05-04 Pending — NAPLESMLS
- 2026-04-24 Listed $274,990 NAPLESMLS
Property tax history
+120.1%/yrLatest (2025): $382 · +120.1% YoY. Source: county tax records.
Cash-flow waterfall
monthlySold comps — $/sqft
last 12 mo · ≤1 miLoading sold comps…