 Duplex
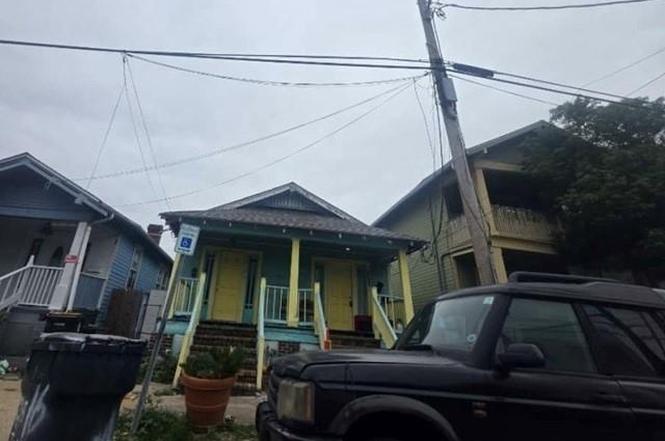
2520 Jena St · New Orleans, LA
Flood risk 8/10 · Major
- FEMA flood zone
- X (shaded)
- Chance of flooding over 30 yrs
- 0.6%
- Est. flood insurance / yr
- $507 – $1,088
Fire risk 1/10 · Minimal
- Est. fire insurance / yr
- $1,269 – $2,357
Heat risk 10/10 · Severe
- Hot days now (above 109°F)
- 7 days/yr
- Hot days in 30 yrs
- 21 days/yr
Wind risk 10/10 · Severe
- Chance of severe wind over 30 yrs
- 99.0%
Air-quality risk 3/10 · Minor
- Unhealthy air days now
- 3 days/yr
- Unhealthy air days in 30 yrs
- 4 days/yr
Risk factors via First Street. Map © Google.
Why this score? — see what drove the B- grade
The composite is a weighted blend of 9 inputs, each scored 0–100. Each bar is that input's sub-score; the figure is the points it added to the 100-point composite (weight × sub-score).
- Cash flow +30.0/30.0
- DSCR +10.0/10.0
- 1% rule +8.7/10.0
- ARV discount +7.8/15.0
- Livability +4.0/5.0
- Condition / age +2.5/5.0
- Rent growth +2.1/5.0
- Schools +1.6/10.0
- Appreciation +0.0/10.0
$256,600
🖨 Deal sheet 📄 Offer letter ✓ Due diligence
Multi-family units
County records classify this as Multi-Family (2-4 Unit). Listing-text estimate: 2 units. confirmed
Listing remarks MLS
NO ACCESS OR VIEWINGS of this property. Please DO NOT DISTURB the occupant.Take a drive by this duplex that offers a total of four bedrooms and two baths and see if it may be your next investment. "As is" cash only sale with no contingencies or inspections. Buyer will be responsible for obtaining possession of the property upon closing.
Key facts
- 3,720 sq ft lot
- Built 1940
- Listed 7 days
Property features AI
Finance
- Financial info: Duplex (2 total units)
Exterior
- Utilities: Public water; Public sewer
- Home design: Single-story building
- Construction: Frame construction; Shingle roof
- Exterior features: Outside city limits; Rectangular lot
Interior
- Bedrooms: Two 2-bedroom units (Unit 1: 2 bedrooms, Unit 2: 2 bedrooms)
- Bathrooms: Two full bathrooms total (each unit has 1 full bathroom)
- Heating & cooling: Central heating; Central air conditioning
- Interior features: Average condition
Neighborhood map
What this means for you Summary
Snapshot
- This is a 2 × 2-bed/1.0-bath units multifamily listed at $257k.
Deal economics
- At list price, monthly cash flow is $1k ($13k/yr) — positive. Per door: $535/mo.
- The deal already cash-flows at list — no discount required.
- Meets the 1% rule at list price ($4k rent vs $257k).
- Cap rate 11.6% vs local median 4.4% in New Orleans — top-decile yield for the area; either an underpriced asset or a hidden risk that comps aren't pricing in. Stress-test before assuming the spread holds.
Location & tenants
- Location reads 81/100 on livability (#3 in LA, #1,383 nationally) — a professional / high-income tenant draw. Strengths: amenities A+, commute A+, health & safety A+; Watch: crime C-, employment D.
- Orleans Parish (urban): math 11% / reading 27% proficiency, ranked #69 of 98 in LA (top 70%) — low school quality limits family demand, transient renter base, plan for 1-2y turnover; 68% free/reduced lunch — lower-income household profile, screen leases tightly.
- Market conditions: Rents soft (-1.4%/yr); 278 active listings in the ZIP; 40 comparable units currently listed for rent nearby; rentals at typical pace (median 20d on market — plan ~3-4 weeks tenant-placement turnaround); solid renter incomes; 710 units permitted in Orleans Parish in 2024 (244 in 5+ unit buildings).
- At $3,507/mo this rent would consume 47% of the median local household income ($90k/yr) (locally 1756% of renters already pay >50% of income on rent) — very limited rent-growth headroom before tenants either downsize or default.
Forward outlook
- Local home prices are declining (-3.0%/yr); year-one equity from $2k of loan paydown is wiped out by about $8k of value loss. Plan a longer hold.
- Orleans County population projected at +61% by 2050 — long-run rental-demand tailwind backs the buy-and-hold thesis.
- At projected returns (-3.0% appreciation + 0.0% rent growth), your $72k cash investment doubles in ~10 years — after that, you're playing with house money.
Negotiation context
- Only 7 days on market — expect competitive offers; lowballing is unlikely to land.
- 2 sale attempts with the ask held roughly flat each time — persistent listings suggest the price (not the market) is what's stuck; bring a comps-based counter.
- Current owner paid $197k; 31% above their basis — modest negotiation headroom, anchor on the comps not their cost.
Risks & watch-outs
- Watch-outs: flood insurance adds $66/mo; built in 1940 — expect roof / HVAC / electrical / plumbing capex.
- Climate carrying-cost: severe flood risk; severe wind risk, 99% chance of damaging wind over 30y; extreme-heat days projected 7→21/yr by 2055 (HVAC capex compounding) — expect insurance premiums to compound above CPI over the hold.
Questions for the listing agent
- Can we see the unit-by-unit rent roll, current vacancy, and any below-market leases? What's the average tenancy length?
- What capital expenditures (roof, boiler, parking lot, exteriors) have been made in the last 5 years, and what's planned in the next 2?
- Built in 1940 — when were the roof, HVAC, electrical panel, plumbing, and water heater last replaced?
- What's the actual annual flood-insurance premium (NFIP or private), and is the property in a SFHA with mandatory coverage?
- Is there a deadline driving the sale (1031 exchange, divorce, estate, relocation)? That informs how much negotiation room exists.
- What's the average days-on-market for RENTAL listings here right now (not sales)? A rising rental-DOM trend means longer vacancies and softer asking-rent achievability than the comps imply.
- What's the recent tenant-quality profile in this submarket — average credit score on applications, eviction rate, late-payment / NSF rate, and stable-employment percentage? A property-management company in the area should have these aggregated.
- How much new apartment / multifamily construction is in the pipeline within 1–3 miles? Heavy new supply (>2% of stock underway) typically softens rents 12–24 months out; light construction supports rent growth.
Investment metrics
- 1% rule
- 1.37% ✓
- Cap rate
- 11.61%
- Cash-on-cash
- 18.97%
- DSCR
- 1.84
- GRM
- 6.1
CMA / ARV
- ARV (on-the-fly)
- $258,336
- Comps found
- 12
Show comp detail 12 sales within ~0.75 mi
| Address | Dist | Beds/Ba | Sqft | Sold | Price | $/sf | Match |
|---|---|---|---|---|---|---|---|
| 1917 Jena St | 0.41mi | 4/2.0 | 1,857 (-1%) | 1mo | $215,000 | $116 | 79 |
| 4522 S Liberty St | 0.19mi | 5/3.0 (+1) | 1,831 (-2%) | 8mo | $253,000 | $138 | 72 |
| 2820-22 Milan St | 0.30mi | 4/2.0 | 1,704 (-9%) | 0mo | $305,000 | $179 | 71 |
| 2215 17 Cadiz St | 0.21mi | 4/2.0 | 1,698 (-9%) | 13mo | $298,000 | $176 | 64 |
| 3112 14 General Taylor St | 0.49mi | 4/2.0 | 1,930 (+3%) | 11mo | $265,000 | $137 | 63 |
| 4911 13 Willow St | 0.28mi | 4/4.0 | 1,769 (-6%) | 11mo | $375,000 | $212 | 60 |
| 3020 22 Gen Taylor St | 0.46mi | 4/2.0 | 1,717 (-8%) | 6mo | $190,000 | $111 | 60 |
| 2315 Peniston St | 0.45mi | 4/2.0 | 2,115 (+13%) | 7mo | $275,000 | $130 | 52 |
| 3034 36 Upperline St | 0.55mi | 3/2.0 (-1) | 2,000 (+7%) | 14mo | $211,000 | $106 | 46 |
| 2219 21 Toledano St | 0.70mi | 4/2.0 | 1,640 (-12%) | 4mo | $232,000 | $141 | 44 |
| 4510 12 Pitt St | 0.74mi | 4/2.0 | 2,130 (+14%) | 3mo | $416,000 | $195 | 40 |
| 3717 S Johnson St | 0.66mi | 4/2.0 | 1,605 (-14%) | 7mo | $145,000 | $90 | 40 |
Match score weights: distance 35% · size 25% · config 20% · recency 20%. Top-matched comps best support the ARV.
Projected returns pro-forma
-3.0% appreciation · 0.0% rent growth · sell at horizon
- IRR
- 6.0%
- Equity multiple
- 1.23×
- Total profit
- $16,265
- Equity at exit
- $38,260
- IRR
- 12.6%
- Equity multiple
- 1.87×
- Total profit
- $62,188
- Equity at exit
- $22,186
Cash invested: $71,848 (down + closing). Projections, not guarantees.
Landlord ↔ Tenant lean methodology
- Overall (STATE)
- 90 Strongly Landlord-Friendly
- State Louisiana
- 90 Strongly Landlord-Friendly · R+12
- County
- — inherits STATE
- City
- — inherits STATE
ZIP-level market 70115
- Rents YoY
- -1.4%
- Active inventory
- 278
- Price-to-rent
- 12.2×
Monthly cashflow live
- Estimated rent
- $3,507 high interval (Pro) →
- Mortgage (P&I)
- −$1,346
- Tax from tax record
- −$182 /mo · $2,185/yr
- Insurance
- −$107
- Flood insurance flood zone
- −$66 /mo · $798/yr
- HOA
- −$0
- Vacancy / Maint / Mgmt
- −$736
- Net cashflow
- $1,069
Break-even live
2-unit breakdown (identical units grouped — click to expand)
| Units | Beds | Baths | Est. rent |
|---|---|---|---|
| 2× units | 2 | 1 | $3,508 |
| #1 | 2 | 1 | $1,754 |
| #2 | 2 | 1 | $1,754 |
| Total (2 units) | $3,507 | ||
UW: 25.0% down · 7.5% · 30yr · 1.5% tax · 5.0% vac · 8.0% maint · 8.0% mgmt
Financing live
Cash to close
- Down payment
- $64,150
- Closing costs
- $7,698
- Reserves months
- —
- Total cash needed
- —
Loan-product check · same deal, 3 products live
Conventional
25% down · 7.5% · 30yr
- Down + closing
- —
- Monthly P&I
- —
- Monthly cashflow
- —
- DSCR
- —
- Eligible?
- —
Personal DTI + credit; lowest rate.
DSCR
20% down · 8.5% · 30yr
- Down + closing
- —
- Monthly P&I
- —
- Monthly cashflow
- —
- DSCR
- —
- Eligible?
- —
No personal income docs; deal must DSCR.
Hard money
10% down · 12.0% · 12mo
- Down + closing
- —
- Monthly P&I
- —
- Monthly cashflow
- —
- DSCR
- —
- Eligible?
- —
Short-term bridge; refi at stabilization.
Rent comps 40 comps
| Address | Beds | Baths | Sqft | Rent | $/sqft | DOM | Units | Dist |
|---|---|---|---|---|---|---|---|---|
| 2308 Jena St New Orleans, LA | 3.0 | 2.5 | 2550 | $3,300 | $1.29 | 43d | 1 | 0.18mi |
| 2806 Upperline St Unit Lower New Orleans, LA | 3.0 | 2.0 | 1250 | $2,500 | $2.00 | 19d | 1 | 0.20mi |
| 2427 Soniat St New Orleans, LA | 3.0 | 2.0 | 1500 | $2,750 | $1.83 | 16d | 1 | 0.25mi |
| 2425 Soniat St New Orleans, LA | 3.0 | 2.5 | 1500 | $2,850 | $1.90 | 11d | 1 | 0.25mi |
| 4435 Loyola Ave New Orleans, LA | 3.0 | 2.0 | 1973 | $2,900 | $1.47 | 15d | 1 | 0.25mi |
| 4223 S Liberty St New Orleans, LA | 3.0 | 1.5 | 1509 | $2,400 | $1.59 | 2d | 1 | 0.28mi |
| 2717 Milan St New Orleans, LA | 3.0 | 1.5 | 1850 | $1,650 | $0.89 | 14d | 1 | 0.30mi |
| 2535 Marengo St New Orleans, LA | 3.0 | 1.0 | 1300 | $1,200 | $0.92 | 14d | 1 | 0.35mi |
| 2625 Jefferson Ave New Orleans, LA | 4.0 | 2.0 | 2000 | $2,600 | $1.30 | 43d | 1 | 0.35mi |
| 2217 Jefferson Ave Unit none New Orleans, LA | 3.0 | 2.0 | 2500 | $2,500 | $1.00 | 43d | 1 | 0.38mi |
| 2209 Jefferson Ave New Orleans, LA | 3.0 | 2.0 | 1600 | $1,800 | $1.12 | 15d | 1 | 0.38mi |
| 2205 Jefferson Ave New Orleans, LA | 3.0 | 2.0 | 1800 | $2,100 | $1.17 | 10d | 1 | 0.39mi |
| 2211 Jefferson Ave New Orleans, LA | 3.0 | 2.0 | 1600 | $1,800 | $1.12 | 16d | 1 | 0.39mi |
| 2429 Octavia St New Orleans, LA | 3.0 | 2.0 | 1640 | $2,350 | $1.43 | 23d | 1 | 0.40mi |
| 2600 Peniston St New Orleans, LA | 4.0 | 2.0 | 2342 | $3,500 | $1.49 | 43d | 1 | 0.40mi |
| 2519 Octavia St New Orleans, LA | 4.0 | 2.0 | 1600 | $3,900 | $2.44 | 43d | 1 | 0.40mi |
| 4206 S Derbigny St New Orleans, LA | 3.0 | 1.0 | 1300 | $1,600 | $1.23 | 23d | 1 | 0.42mi |
| 2306 Octavia St New Orleans, LA | 3.0 | 2.0 | 2254 | $2,650 | $1.18 | 3d | 1 | 0.45mi |
| 2539 Amelia St New Orleans, LA | 3.0 | 2.0 | 1296 | $2,200 | $1.70 | 23d | 1 | 0.47mi |
| 2229 Joseph St New Orleans, LA | 4.0 | 2.0 | 1830 | $4,000 | $2.19 | 16d | 1 | 0.47mi |
| 1907 Napoleon Ave New Orleans, LA | 4.0 | 2.0 | 2500 | $2,800 | $1.12 | 16d | 1 | 0.47mi |
| 3429 Clara St New Orleans, LA | 3.0 | 2.0 | 1620 | $2,350 | $1.45 | 14d | 1 | 0.49mi |
| 5417 Loyola Ave New Orleans, LA | 3.0 | 1.5 | 1700 | $2,100 | $1.24 | 3d | 1 | 0.51mi |
| 4213 Dryades St New Orleans, LA | 4.0 | 2.0 | 2000 | $2,800 | $1.40 | 23d | 1 | 0.51mi |
| 5519 S Liberty St New Orleans, LA | 3.0 | 2.0 | 1800 | $2,490 | $1.38 | 23d | 1 | 0.51mi |
| 5718 Cucullu St New Orleans, LA | 4.0 | 3.0 | 1873 | $2,500 | $1.33 | 16d | 1 | 0.52mi |
| 3350 Jena St New Orleans, LA | 3.0 | 2.5 | 2200 | $2,500 | $1.14 | 43d | 1 | 0.53mi |
| 3035 Delachaise St New Orleans, LA | 3.0 | 1.0 | 1968 | $1,750 | $0.89 | 1d | 1 | 0.54mi |
| 5819 Clara St New Orleans, LA | 4.0 | 2.0 | 1596 | $2,500 | $1.57 | 43d | 1 | 0.57mi |
| 2322 Nashville Ave New Orleans, LA | 4.0 | 2.0 | 2249 | $2,750 | $1.22 | 43d | 1 | 0.57mi |
| 3044 Louisiana Avenue Pkwy New Orleans, LA | 3.0 | 2.0 | 1800 | $1,900 | $1.06 | 23d | 1 | 0.58mi |
| 5417 S Johnson St New Orleans, LA | 3.0 | 3.0 | 1739 | $2,900 | $1.67 | 16d | 1 | 0.59mi |
| 5830 Clara St Unit 1 New Orleans, LA | 4.0 | 2.0 | 2100 | $4,500 | $2.14 | 43d | 1 | 0.60mi |
| 5830 Willow St New Orleans, LA | 3.0 | 3.5 | 1400 | $2,500 | $1.79 | 21d | 1 | 0.60mi |
| 5832 Willow St New Orleans, LA | 4.0 | 3.5 | 1400 | $3,295 | $2.35 | 43d | 1 | 0.60mi |
| 5838 Willow St New Orleans, LA | 3.0 | 3.0 | 1400 | $2,500 | $1.79 | 43d | 1 | 0.61mi |
| 2325 State St New Orleans, LA | 5.0 | 3.0 | 1800 | $4,000 | $2.22 | 23d | 1 | 0.62mi |
| 2211 State St New Orleans, LA | 4.0 | 4.0 | 1650 | $4,200 | $2.55 | 16d | 1 | 0.63mi |
| 3208 Louisiana Avenue Pkwy New Orleans, LA | 3.0 | 2.0 | 1391 | $1,900 | $1.37 | 16d | 1 | 0.63mi |
| 5330 Dryades St New Orleans, LA | 3.0 | 2.5 | 1750 | $3,800 | $2.17 | 3d | 1 | 0.64mi |
Listing history 6 events
-
2026-06-18days on market $256,600 Active 7 DOM
-
2026-06-17days on market $256,600 Active 6 DOM
-
2026-06-16days on market $256,600 Active 5 DOM
-
2026-06-15days on market $256,600 Active 4 DOM
-
2026-06-13remarks 342-char remark
-
2026-06-13$256,600 Active 2 DOM
ⓘ Source: listings_history table (triggers on properties + properties_extension) + one-shot
backfill from property_details.listing_events for pre-trigger history.
Tax reassessment forecast LA · Resets to sale price
- Current annual tax
- $2,185 · $182/mo
- Projected year-2 tax
- $2,185 · $182/mo
- Expected delta
- $0/yr ($0/mo · 0.0%)
ⓘ Screening estimate from a state-policy table — verify with the county assessor before closing.
Climate risk First Street
- Flood 8/10 Severe FEMA zone X (shaded) · 60% chance over 30 yrs
- Wildfire 1/10 Low
- Heat 10/10 Extreme 7 d/yr ≥109°F today · 21 d/yr by 30 yrs out
- Wind 10/10 Extreme 99% chance of damaging wind over 30 yrs
- Air quality 3/10 Moderate 3 unhealthy d/yr today · 4 by 30 yrs out
Nearby sold comps map
Loading sold comps map…
Walkable amenities ~0.75 mi
Loading nearby amenities…
Taxation est. · year 1
- Rental income
- $42,084
- − Mortgage interest
- −$14,374
- − Property taxes
- −$2,185
- − Insurance
- −$2,080
- − Repairs & maintenance
- −$3,367
- − Management
- −$3,367
- − Depreciation
- −$7,465
- Taxable income
- $9,247
- Est. tax owed @ 24.0%
- −$2,219
- After-tax cash flow
- $10,614/yr
For passive investors: Depreciation is non-cash, so a rental often shows a tax loss while cash-flowing — sheltering income. Rental losses are passive: they offset passive income freely, and up to $25,000/yr can offset ordinary (W-2) income if you actively participate and your MAGI is under $100k (phasing out to $0 by $150k); unused losses carry forward. On sale, claimed depreciation is recaptured at up to 25%, and gains may owe capital-gains tax (a 1031 exchange can defer both). Figures are a year-1 estimate at your 24.0% rate — not tax advice; consult a CPA.
Schools (NCES district)
- District
- Orleans Parish
- NCES district ID
- 2201170
- Math proficiency
- 11% ▼ -52.00%
- Reading proficiency
- 27% ▼ -46.00%
- Median HH income
- $37,011
- Composite
- 15.78/100
- National rank
- #9271
- State rank
- #69 of 98 in LA
Livability — New Orleans
- Score
- 81/100
- State rank
- #3
- US rank
- #1383
Category grades
Schools grade is shown separately in the Schools card above.
Census & demographics
- Census place
- New Orleans, LA
- County
- Orleans Parish · 338,817 people
- City population
- 338,817
- Metro
- New Orleans-Metairie, LA
- Population (ZIP)
- 31,183
- Household income
- $90,182
- Rent vs Own
- Severe rent burden
- 1756.0
Population outlook (Orleans County) Hauer SSP2
- Today (2025)
- 513,025 people
- By 2030
- 575,781 · +12.2%
- By 2040
- 700,174 · +36.5%
- By 2050
- 826,541 · +61.1%
- By 2075
- 1,123,374 · +119.0%
- By 2100
- 1,355,609 · +164.2%
Race, ethnicity, and origin ACS 2023
- Neighborhood character
- Diverse neighborhood (Simpson 0.58)
- Race & ethnicity
- White 59% Black 26% Two or more races 8% Hispanic / Latino 7% Asian 3%
- Hispanic origin (detail)
- Mexican 1%
- Common ancestry
- Lithuanian 8% Italian 3% Slovak 3%
- Foreign-born
- 5% · Canada, China
- Languages at home
- 91% English-only · Spanish 4% French/Haitian/Cajun 2% Other Indo-European 1%
Political lean MEDSL · Orleans
- 2024 margin
- Solid D (+67.0) · D 82.2% · R 15.2% · Other 2.7%
- 2008→2024 swing
- +6.7pp toward D · 2008: 60.3pp · 2024: 67.0pp
- All cycles
- 2024: D+67.0 2020: D+68.2 2016: D+66.2 2012: D+62.5 2008: D+60.3
Not yet ingested
- Civics
- —
Market trends
- HPI YoY
- ▼ -272.08%
- Current HPI
- 287.2138
- Rent YoY
- ▼ -1.42%
- Metro
- New Orleans-Metairie, LA
- State GDP YoY
- ▲ 3.29%
- F500 in state
- 10
Industry mix (Fortune 500 HQ in LA)
| Industry | F500 HQs | Revenue |
|---|---|---|
| Telecommunications | 2 | $23B |
|
||
| Utilities | 1 | $12B |
|
||
| Wholesale / Distribution | 1 | $5B |
|
||
| Advertising | 1 | $2B |
|
||
Price history
+30.6% since first listed3 events — show timeline
- 2026-06-11 Listed $256,600 AcadianaMLS
- 2026-06-11 Listed $256,600 GSREIN
- 2001-02-06 Sold (Public Records) $196,514 Public Records
Property tax history
+5.6%/yrLatest (2026): $2,185 · +38.2% YoY. Source: county tax records.
Cash-flow waterfall
monthlySold comps — $/sqft
last 12 mo · ≤1 miLoading sold comps…