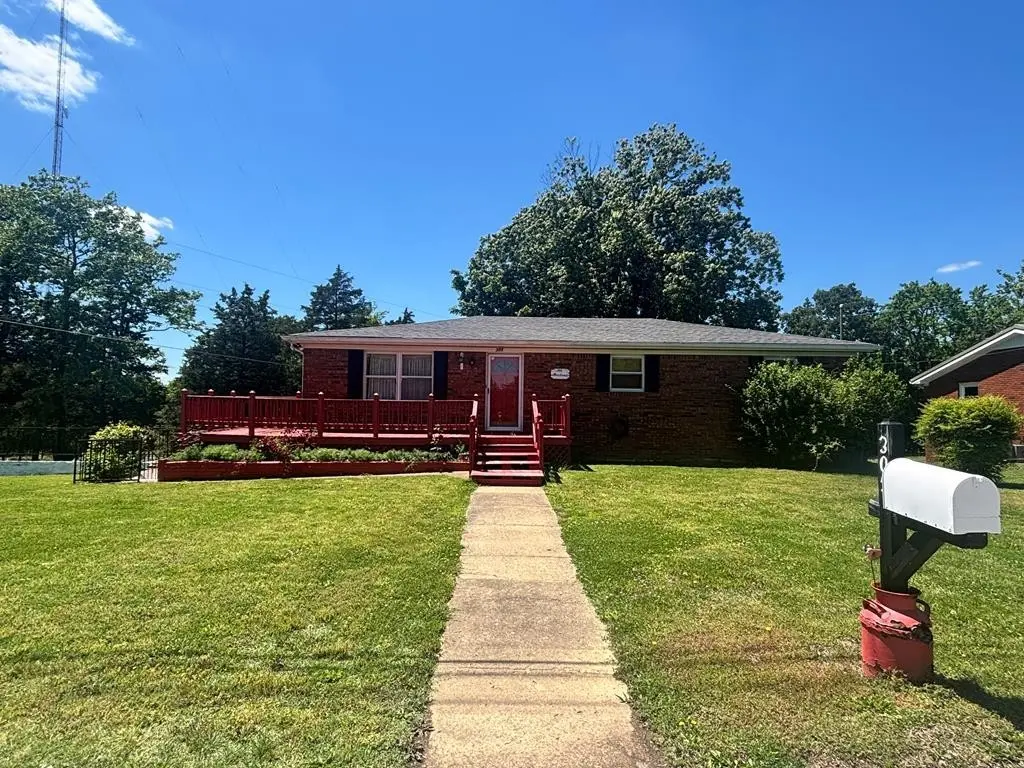
305 Dink Embrys Buttermilk Rd · Hopkinsville, KY
Flood risk 1/10 · Minimal
- FEMA flood zone
- X (unshaded)
- Chance of flooding over 30 yrs
- 0.0%
- Est. flood insurance / yr
- $473 – $860
Fire risk 3/10 · Minor
- Est. fire insurance / yr
- $839 – $1,559
Heat risk 5/10 · Moderate
- Hot days now (above 108°F)
- 7 days/yr
- Hot days in 30 yrs
- 20 days/yr
Wind risk 3/10 · Minor
- Chance of severe wind over 30 yrs
- 8.0%
Air-quality risk 2/10 · Minimal
- Unhealthy air days now
- 0 days/yr
- Unhealthy air days in 30 yrs
- 1 days/yr
Risk factors via First Street. Map © Google.
Why this score? — see what drove the D+ grade
The composite is a weighted blend of 9 inputs, each scored 0–100. Each bar is that input's sub-score; the figure is the points it added to the 100-point composite (weight × sub-score).
- Cash flow +14.6/30.0
- ARV discount +12.8/15.0
- DSCR +4.5/10.0
- Rent growth +4.2/5.0
- Livability +3.2/5.0
- 1% rule +2.8/10.0
- Schools +2.7/10.0
- Condition / age +2.5/5.0
- Appreciation +0.0/10.0
$155,000
🖨 Deal sheet (PDF) 📄 Offer letter ✓ Due diligence
Listing remarks MLS
"SOLD AS IS" Nice Lot, attractive home with a basement/garage. 2 Large decks in the front and back. 1314 sqft of living space. Structurally sound brick home with newer roof and HVAC system, ready to make it everything you want.
Key facts
- Basement garage
- Newer roof
- Large decks
Tags
Property features AI
Finance
- Financial info: Annual tax amount reported (not included per instructions)
Exterior
- Parking: Attached 2-car garage (2 covered spaces, 2 total parking spaces)
- Utilities: Public water; Public sewer
- Home design: Single-family residence; One level
- Construction: Brick construction; Shingle roof; Block foundation; Existing (year built not specified)
- Exterior features: Public water; Public sewer; Water available
Interior
- Kitchen: Cooktop; Dishwasher; Microwave; Kitchen approximately 17 x 11
- Bedrooms: Three bedrooms (all on the main level); Bedroom sizes include approximately 12 x 12 and 12 x 11
- Flooring: Carpet; Vinyl
- Bathrooms: Two full bathrooms
- Heating & cooling: Central heating; Central air conditioning
- Interior features: Unfinished basement; Cooktop, Dishwasher, Microwave
Neighborhood map
What this means for you Summary
Snapshot
- This is a 3-bed/2.0-bath single-family listed at $155k.
Deal economics
- At list price, monthly cash flow is $38 ($452/yr) — positive.
- The deal already cash-flows at list — no discount required.
- To meet the 1% rule (rent ≥ 1% of price), the offer needs to be $121k (22.0% below list).
- Recommended offer: $121k (22.0% below list) — sets the bar for 1% rule.
- Cap rate 6.6% vs local median 4.3% in Hopkinsville — top-decile yield for the area; either an underpriced asset or a hidden risk that comps aren't pricing in. Stress-test before assuming the spread holds.
Location & tenants
- Location reads 64/100 on livability (#305 in KY) — a middle-class / working-renter tenant base. Strengths: cost of living A+, housing A, health & safety B+; Watch: crime F, amenities F, commute F.
- Christian County (town): math 30% / reading 34% proficiency, ranked #93 of 165 in KY (top 56%) — families likely to look elsewhere, expect single-tenant / working-renter base with shorter leases; 61% free/reduced lunch — lower-income household profile, screen leases tightly.
- Zoned schools: Freedom Elementary School (math 9% / reading 13%, grade F, #645 of 676 statewide, top 96%, 547 students, 84% FRL); Christian County Middle School (math 21% / reading 40%, grade F, #143 of 217 statewide, top 67%, 650 students, 69% FRL); Christian County High School (math 20% / reading 36%, grade F, #151 of 254 statewide, top 61%, 1,187 students, 67% FRL).
- Market conditions: Rents rising fast (+6.6%/yr); 255 active listings in the ZIP; 13 comparable units currently listed for rent nearby; rentals at typical pace (median 23d on market — plan ~3-4 weeks tenant-placement turnaround); 46% of comp listings sitting > 30 days — soft ceiling on asking rent; 193 units permitted in Christian County in 2024 (66 in 5+ unit buildings).
Forward outlook
- Local home prices are declining (-3.0%/yr); year-one equity from $1k of loan paydown is wiped out by about $5k of value loss. Plan a longer hold.
- Christian County population projected at -20% by 2050 — secular population decline; favor cash flow + early exit over multi-decade hold.
Negotiation context
- Only 6 days on market — expect competitive offers; lowballing is unlikely to land.
- 2 sale attempts with the ask held roughly flat each time — persistent listings suggest the price (not the market) is what's stuck; bring a comps-based counter.
Risks & watch-outs
- Climate carrying-cost: extreme-heat days projected 7→20/yr by 2055 (HVAC capex compounding) — expect insurance premiums to compound above CPI over the hold.
Questions for the listing agent
- Built in 1979 — when were the roof, HVAC, electrical panel, plumbing, and water heater last replaced?
- Is there a deadline driving the sale (1031 exchange, divorce, estate, relocation)? That informs how much negotiation room exists.
- Schools are D-rated, which usually means shorter tenancies and higher turnover. Who's the typical renter profile here, and what's been the actual vacancy rate?
- Crime grade is F in this area — have there been break-ins, vandalism, or insurance claims at this property in the last 3 years? What carrier currently insures it and at what premium?
- The area grade is low — what's the realistic commute time and amenity access for the typical tenant pool here? Any planned neighborhood developments (good or bad) we should know about?
- What's the average days-on-market for RENTAL listings here right now (not sales)? A rising rental-DOM trend means longer vacancies and softer asking-rent achievability than the comps imply.
- What's the recent tenant-quality profile in this submarket — average credit score on applications, eviction rate, late-payment / NSF rate, and stable-employment percentage? A property-management company in the area should have these aggregated.
- How much new for-sale + rental construction is in the pipeline within 1–3 miles? Heavy new supply typically softens prices + rents 12–24 months out; constrained supply supports both.
Investment metrics
- 1% rule
- 0.78% ✗
- Cap rate
- 6.58%
- Cash-on-cash
- 1.04%
- DSCR
- 1.05
- GRM
- 10.7
CMA / ARV
- ARV (on-the-fly)
- $175,840
- Comps found
- 12
Show comp detail 12 sales within ~0.75 mi
| Address | Dist | Beds/Ba | Sqft | Sold | Price | $/sf | Match |
|---|---|---|---|---|---|---|---|
| 208 N Edgewood Dr | 0.33mi | 3/1.5 | 1,060 (-5%) | 4mo | $163,000 | $154 | 70 |
| 525 Highpoint Dr | 0.27mi | 3/1.0 | 1,200 (+7%) | 5mo | $144,900 | $121 | 67 |
| 329 Pine Hill Dr | 0.58mi | 3/2.0 | 1,132 (+1%) | 6mo | $198,000 | $175 | 66 |
| 112 N Saltsman Dr | 0.40mi | 3/1.0 | 1,146 (+2%) | 10mo | $179,999 | $157 | 66 |
| 709 Pineridge Dr | 0.69mi | 3/2.0 | 1,139 (+2%) | 0mo | $189,900 | $167 | 65 |
| 314 Pine Hill Dr | 0.47mi | 3/2.0 | 1,131 (+1%) | 15mo | $194,400 | $172 | 64 |
| 617 Evergreen Park Dr | 0.57mi | 3/2.0 | 1,041 (-7%) | 12mo | $187,000 | $180 | 52 |
| 1401 Barberry Pl | 0.74mi | 3/2.0 | 1,016 (-9%) | 1mo | $195,000 | $192 | 49 |
| 704 Rose Dr | 0.52mi | 4/1.5 (+1) | 1,242 (+11%) | 8mo | $144,500 | $116 | 44 |
| 138 Boxwood Dr | 0.63mi | 3/2.0 | 1,236 (+10%) | 15mo | $135,000 | $109 | 41 |
| 923 Rose Dr | 0.69mi | 3/1.0 | 1,000 (-11%) | 10mo | $149,000 | $149 | 37 |
| 1407 Barberry Pl | 0.70mi | 3/1.0 | 1,000 (-11%) | 15mo | $132,000 | $132 | 33 |
Match score weights: distance 35% · size 25% · config 20% · recency 20%. Top-matched comps best support the ARV.
Projected returns pro-forma
-3.0% appreciation · 6.61% rent growth · sell at horizon
- IRR
- -11.2%
- Equity multiple
- 0.58×
- Total profit
- $-18,242
- Equity at exit
- $23,111
- IRR
- 2.0%
- Equity multiple
- 1.16×
- Total profit
- $7,015
- Equity at exit
- $13,402
Cash invested: $43,400 (down + closing). Projections, not guarantees.
Landlord ↔ Tenant lean methodology
- Overall (STATE)
- 83 Strongly Landlord-Friendly
- State Kentucky
- 83 Strongly Landlord-Friendly · R+16
- County
- — inherits STATE
- City
- — inherits STATE
ZIP-level market 42240
- Home prices YoY
- -17.5%
- Rents YoY
- 6.6%
- Active inventory
- 255
- Price-to-rent
- 10.7×
Monthly cashflow live
- Estimated rent
- $1,209 high interval (Pro) →
- Mortgage (P&I)
- −$813
- Tax from tax record
- −$40 /mo · $484/yr
- Insurance
- −$65
- HOA
- −$0
- Vacancy / Maint / Mgmt
- −$254
- Net cashflow
- $38
Break-even live
Sensitivity live
| Price | -10% $125 | -5% $82 | +0% $38 | +5% $-6 | +10% $-50 |
|---|---|---|---|---|---|
| Rent | -10% $-58 | -5% $-10 | +0% $38 | +5% $85 | +10% $133 |
| Rate | -1.0pp $116 | -0.5pp $77 | base $38 | +0.5pp $-3 | +1.0pp $-43 |
UW: 25.0% down · 7.5% · 30yr · 1.5% tax · 5.0% vac · 8.0% maint · 8.0% mgmt
Financing live
Cash to close
- Down payment
- $38,750
- Closing costs
- $4,650
- Reserves months
- —
- Total cash needed
- —
Loan-product check · same deal, 3 products live
Conventional
25% down · 7.5% · 30yr
- Down + closing
- —
- Monthly P&I
- —
- Monthly cashflow
- —
- DSCR
- —
- Eligible?
- —
Personal DTI + credit; lowest rate.
DSCR
20% down · 8.5% · 30yr
- Down + closing
- —
- Monthly P&I
- —
- Monthly cashflow
- —
- DSCR
- —
- Eligible?
- —
No personal income docs; deal must DSCR.
Hard money
10% down · 12.0% · 12mo
- Down + closing
- —
- Monthly P&I
- —
- Monthly cashflow
- —
- DSCR
- —
- Eligible?
- —
Short-term bridge; refi at stabilization.
Rent comps 13 comps
| Address | Beds | Baths | Sqft | Rent | $/sqft | DOM | Units | Dist |
|---|---|---|---|---|---|---|---|---|
| 115 A Holley Dr Unit B Hopkinsville, KY | 3.0 | 2.0 | 1235 | $1,195 | $0.97 | 23d | 1 | 0.39mi |
| 115 A Holley Dr Unit B Hopkinsville, KY | 3.0 | 2.0 | 1235 | $1,195 | $0.97 | 45d | 1 | 0.39mi |
| 605 Colonette Dr Hopkinsville, KY | 3.0 | 2.0 | 1060 | $1,625 | $1.53 | 23d | 1 | 0.47mi |
| 607 Colonette Dr Hopkinsville, KY | 3.0 | 2.0 | 1060 | $1,600 | $1.51 | 45d | 1 | 0.48mi |
| 600 A Colonelette Dr Unit 600 Hopkinsville, KY | 2.0 | 2.0 | 980 | $1,020 | $1.04 | 23d | 1 | 0.50mi |
| 600 A Colonelette Dr Unit A Hopkinsville, KY | 2.0 | 2.0 | 980 | $1,050 | $1.07 | 45d | 1 | 0.50mi |
| 600 A Colonelette Dr Unit A Hopkinsville, KY | 2.0 | 2.0 | 980 | $1,020 | $1.04 | 23d | 1 | 0.50mi |
| 600 A Colonelette Dr Unit 600 Hopkinsville, KY | 2.0 | 2.0 | 980 | $1,020 | $1.04 | 45d | 1 | 0.50mi |
| 617 Vass Ln Hopkinsville, KY | 3.0 | 2.0 | 1040 | $1,150 | $1.11 | 15d | 1 | 0.55mi |
| 624 Vass Ln Hopkinsville, KY | 2.0 | 1.0 | 836 | $925 | $1.11 | 45d | 1 | 0.59mi |
| 106 Dickerson Ln Hopkinsville, KY | 2.0 | 1.0 | 900 | $895 | $0.99 | 45d | 1 | 0.89mi |
| 117 B S Fowler Ave Unit A Hopkinsville, KY | 2.0 | 1.0 | 700 | $850 | $1.21 | 15d | 1 | 1.06mi |
| 707 Sylvia St Hopkinsville, KY | 2.0 | 1.0 | 768 | $800 | $1.04 | 15d | 1 | 1.38mi |
Listing history 4 events
-
2026-05-14status Pending 237-char remark
Show marketing remark (237 chars)
"SOLD AS IS" Nice Lot, attractive home with a basement/garage. 2 Large decks in the front and back. 1314 sqft of living space. Structurally sound brick home with newer roof and HVAC system, ready to make it everything you want.
-
2026-05-14status Pending
Show marketing remark (237 chars)
"SOLD AS IS" Nice Lot, attractive home with a basement/garage. 2 Large decks in the front and back. 1314 sqft of living space. Structurally sound brick home with newer roof and HVAC system, ready to make it everything you want.
-
2026-05-08$155,000 Active
Show marketing remark (237 chars)
"SOLD AS IS" Nice Lot, attractive home with a basement/garage. 2 Large decks in the front and back. 1314 sqft of living space. Structurally sound brick home with newer roof and HVAC system, ready to make it everything you want.
-
2026-05-08$155,000 Active 237-char remark
Show marketing remark (237 chars)
"SOLD AS IS" Nice Lot, attractive home with a basement/garage. 2 Large decks in the front and back. 1314 sqft of living space. Structurally sound brick home with newer roof and HVAC system, ready to make it everything you want.
ⓘ Source: listings_history table (triggers on properties + properties_extension) + one-shot
backfill from property_details.listing_events for pre-trigger history.
Tax reassessment forecast KY · Resets to sale price
- Current annual tax
- $484 · $40/mo
- Projected year-2 tax
- $1,333 · $111/mo
- Expected delta
- +$849/yr (+$71/mo · 175.6%)
ⓘ Screening estimate from a state-policy table — verify with the county assessor before closing.
Climate risk First Street
- Flood 1/10 Low FEMA zone X (unshaded) · 0% chance over 30 yrs
- Wildfire 3/10 Moderate
- Heat 5/10 Major 7 d/yr ≥108°F today · 20 d/yr by 30 yrs out
- Wind 3/10 Moderate 8% chance of damaging wind over 30 yrs
- Air quality 2/10 Low 0 unhealthy d/yr today · 1 by 30 yrs out
Nearby sold comps map
Loading sold comps map…
Walkable amenities ~0.75 mi
Loading nearby amenities…
Taxation est. · year 1
- Rental income
- $14,512
- − Mortgage interest
- −$8,682
- − Property taxes
- −$484
- − Insurance
- −$775
- − Repairs & maintenance
- −$1,161
- − Management
- −$1,161
- − Depreciation
- −$4,509
- Taxable loss
- −$2,260
- Est. tax savings @ 24.0%
- +$542
- After-tax cash flow
- $994/yr
For passive investors: Depreciation is non-cash, so a rental often shows a tax loss while cash-flowing — sheltering income. Rental losses are passive: they offset passive income freely, and up to $25,000/yr can offset ordinary (W-2) income if you actively participate and your MAGI is under $100k (phasing out to $0 by $150k); unused losses carry forward. On sale, claimed depreciation is recaptured at up to 25%, and gains may owe capital-gains tax (a 1031 exchange can defer both). Figures are a year-1 estimate at your 24.0% rate — not tax advice; consult a CPA.
Schools (NCES district)
- District
- Christian County
- NCES district ID
- 2101150
- Math proficiency
- 30% ▼ -9.00%
- Reading proficiency
- 34% ▼ -10.00%
- Median HH income
- $38,961
- Composite
- 26.8/100
- National rank
- #7118
- State rank
- #93 of 165 in KY
Livability — Hopkinsville
- Score
- 64/100
- State rank
- #305
- US rank
- #14474
Category grades
Schools grade is shown separately in the Schools card above.
Census & demographics
- Census place
- Hopkinsville, KY
- County
- Christian County · 51,080 people
- City population
- 41,415
- Metro
- Clarksville, TN-KY
- Population (ZIP)
- 41,415
- Household income
- $51,534
- Rent vs Own
- Severe rent burden
- 1475.0
Population outlook (Christian County) Hauer SSP2
- Today (2025)
- 67,861 people
- By 2030
- 65,808 · -3.0%
- By 2040
- 60,090 · -11.5%
- By 2050
- 54,561 · -19.6%
- By 2075
- 45,859 · -32.4%
- By 2100
- 38,310 · -43.5%
Race, ethnicity, and origin ACS 2023
- Neighborhood character
- Majority White (65%)
- Race & ethnicity
- White 65% Black 23% Two or more races 7% Hispanic / Latino 4%
- Common ancestry
- Slovak 3% Italian 1% Romanian 1%
- Foreign-born
- 3% · Canada
- Languages at home
- 95% English-only · Spanish 3% German/W. Germanic 1%
Political lean MEDSL · Christian
- 2024 margin
- Solid R (+33.6) · D 32.6% · R 66.1% · Other 1.3%
- 2008→2024 swing
- -12.4pp toward R · 2008: -21.2pp · 2024: -33.6pp
- All cycles
- 2024: R+33.6 2020: R+28.4 2016: R+31.4 2012: R+23.8 2008: R+21.2
Not yet ingested
- Civics
- —
Market trends
- HPI YoY
- ▼ -49.36%
- Current HPI
- 233.3958
- Rent YoY
- ▲ 6.61%
- Metro
- Clarksville, TN-KY
- State GDP YoY
- ▲ 1.81%
- F500 in state
- 4
Industry mix (Fortune 500 HQ in KY)
| Industry | F500 HQs | Revenue |
|---|---|---|
| Healthcare | 1 | $118B |
|
||
| Food / Beverage | 1 | $7B |
|
||
Price history
+0.0% since first listed4 events — show timeline
- 2026-05-14 Pending — HCTCBOR
- 2026-05-14 Pending — REALTRACS as Distributed by MLS Grid
- 2026-05-08 Listed $155,000 REALTRACS as Distributed by MLS Grid
- 2026-05-08 Listed $155,000 HCTCBOR
Property tax history
+6.7%/yrLatest (2025): $484 · -4.4% YoY. Source: county tax records.
Cash-flow waterfall
monthlySold comps — $/sqft
last 12 mo · ≤1 miLoading sold comps…