 🏗️ New Construction
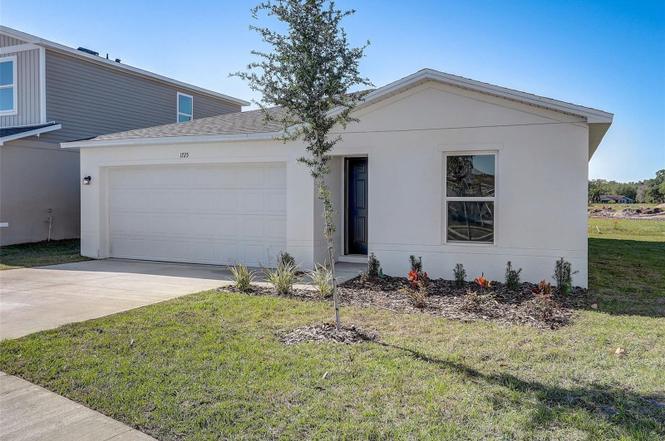
2371 Oklahoma Dr · Bushnell, FL
Flood risk No data
- FEMA flood zone
- —
- Chance of flooding over 30 yrs
- —
- Est. flood insurance / yr
- —
Fire risk No data
- Est. fire insurance / yr
- —
Heat risk No data
- Hot days now (above threshold)
- —
- Hot days in 30 yrs
- —
Wind risk No data
- Chance of severe wind over 30 yrs
- —
Air-quality risk No data
- Unhealthy air days now
- —
- Unhealthy air days in 30 yrs
- —
Risk factors via First Street. Map © Google.
Why this score? — see what drove the D- grade
The composite is a weighted blend of 9 inputs, each scored 0–100. Each bar is that input's sub-score; the figure is the points it added to the 100-point composite (weight × sub-score).
- Cash flow +8.6/30.0
- ARV discount +7.5/15.0
- Schools +5.2/10.0
- Appreciation +5.0/10.0
- 1% rule +2.9/10.0
- Livability +2.9/5.0
- Rent growth +2.5/5.0
- Condition / age +2.5/5.0
- DSCR +2.4/10.0
$259,888
🖨 Deal sheet (PDF) 📄 Offer letter ✓ Due diligence
Listing remarks
Under Construction. Welcome to your spacious and elegant home in the desirable Sumter Villas The Alton Plan offers a contemporary living experience with its design and desirable features. The standout kitchen is a culinary masterpiece, featuring cabinetry, granite countertops, and stainless steel appliances, including a smooth-top range, over-the-range microwave, and dishwasher. This culinary space opens seamlessly into a welcoming dining area and spacious living room, perfect for hosting gatherings or relaxation. Convenience abounds with all bedrooms and a sizable laundry room on the main floor. The serene owner’s suite is a retreat with a private bath and a generous walk-in closet.
Key facts
- Private bath
- Granite countertops
- Smooth-top range
Tags
Property features AI
Finance
- Other: Lot approx. 0.12 acres (paved road access); Permit number: 24BUS-00311
- Financial info: No lease restrictions indicated
- HOA & community: Sumter Villas Homeowners Association; Monthly HOA $45 (includes pool, common area taxes, and other items); Community clubhouse and pool; Pets allowed
Exterior
- Parking: Attached 2-car garage (19 x 20) with garage door opener; Driveway
- Security: Smoke detector(s)
- Utilities: Public water; Public sewer; Electricity connected; Water connected; Sewer connected
- Home design: Single-family residence; One story; Under construction (projected completion: 2025-08-07); Property faces south
- Construction: Block and stucco construction; Shingle roof; Slab foundation; New construction; Built by Century Complete (model: PRESCOTT-A6)
- Exterior features: Patio/porch (other); Exterior lighting; Sidewalk; Sliding doors
Interior
- Kitchen: Range; Microwave; Dishwasher; Electric water heater
- Bedrooms: 3 bedrooms
- Flooring: Carpet
- Bathrooms: 2 full bathrooms
- Heating & cooling: Central heating (electric, heat pump); Central air conditioning
- Interior features: Open floorplan; Stone countertops; Thermostat; Walk-in closets; Double-pane/insulated thermal windows; Smoke detector(s)
- Laundry & utility: Inside laundry room
Neighborhood map
What this means for you Summary
Snapshot
- This is a 3-bed/2.0-bath single-family listed at $260k.
Deal economics
- At list price, monthly cash flow is $-225 ($-3k/yr) — negative.
- To cash-flow at today's rent, offer at most $229k (12.0% below list).
- To meet the 1% rule (rent ≥ 1% of price), the offer needs to be $206k (20.8% below list).
- Recommended offer: $206k (20.8% below list) — sets the bar for 1% rule.
- Cap rate 5.3% vs local median 4.2% in Bushnell — meaningfully above typical; check what's discounted (condition, days-on-market, listing class) to confirm the premium yield is real.
Location & tenants
- Location reads 58/100 on livability (#835 in FL) — a working-class tenant base; expect higher turnover. Strengths: cost of living A+, housing A+, crime A-; Watch: health & safety C-, amenities F, commute F.
- Sumter (rural): math 61% / reading 61% proficiency, ranked #11 of 73 in FL (top 15%) — acceptable for families but not a draw, mixed tenant base, ~2y average lease.
- Zoned schools: Bushnell Elementary School (math 65% / reading 63%, grade B, #552 of 2,144 statewide, top 26%, 760 students, 61% FRL); South Sumter Middle School (math 55% / reading 54%, grade B-, #183 of 571 statewide, top 34%, 897 students, 61% FRL).
- Market conditions: 44 active listings in the ZIP; 4 comparable units currently listed for rent nearby; rentals at typical pace (median 23d on market — plan ~3-4 weeks tenant-placement turnaround); 3,961 units permitted in Sumter County in 2024 (248 in 5+ unit buildings).
Forward outlook
- In year one you build about $10k of equity ($2k loan paydown + $8k appreciation (3.0% local appreciation)).
- Sumter County population projected at +45% by 2050 — long-run rental-demand tailwind backs the buy-and-hold thesis.
- By year 4, paydown + projected appreciation supports a ~$33k cash-out refi (75% LTV) — recoverable capital for the next deal without selling this one.
Negotiation context
- It's been on market 269 days — a 12% lower offer ($229k) is reasonable based on typical stale-listing flexibility.
- 5 sale attempts; this cycle's ask has dropped $14k (5%) from the opening price — seller is motivated, your offer sets the floor, not the list.
Questions for the listing agent
- What do current leases actually rent for vs. the listed asking? Can we see a recent rent roll and the last 12 months of T-12 income?
- It's been on market 269 days. Have you received any prior offers? Is the seller open to a 21% concession, seller financing, or rate buy-down credit?
- What does the HOA fee cover, when was the last increase, and are there any pending special assessments or reserve-fund shortfalls?
- Why hasn't it sold? Are there any deal-killer items the seller is aware of (foundation, flood, title, zoning, code violations)?
- Is there a deadline driving the sale (1031 exchange, divorce, estate, relocation)? That informs how much negotiation room exists.
- Schools are D-rated, which usually means shorter tenancies and higher turnover. Who's the typical renter profile here, and what's been the actual vacancy rate?
- The area grade is low — what's the realistic commute time and amenity access for the typical tenant pool here? Any planned neighborhood developments (good or bad) we should know about?
- What's the average days-on-market for RENTAL listings here right now (not sales)? A rising rental-DOM trend means longer vacancies and softer asking-rent achievability than the comps imply.
- What's the recent tenant-quality profile in this submarket — average credit score on applications, eviction rate, late-payment / NSF rate, and stable-employment percentage? A property-management company in the area should have these aggregated.
- How much new for-sale + rental construction is in the pipeline within 1–3 miles? Heavy new supply typically softens prices + rents 12–24 months out; constrained supply supports both.
Investment metrics
- 1% rule
- 0.79% ✗
- Cap rate
- 5.26%
- Cash-on-cash
- -3.69%
- DSCR
- 0.84
- GRM
- 10.6
CMA / ARV
- ARV (on-the-fly)
- $261,429
- Comps found
- 12
Show comp detail 12 sales within ~0.75 mi
| Address | Dist | Beds/Ba | Sqft | Sold | Price | $/sf | Match |
|---|---|---|---|---|---|---|---|
| 2252 Oklahoma Dr | 0.13mi | 3/2.0 | 1,477 (0%) | 4mo | $243,000 | $165 | 91 |
| 1569 Texas Ave | 0.14mi | 3/2.0 | 1,452 (-2%) | 2mo | $251,075 | $173 | 89 |
| 1573 Texas Ave | 0.14mi | 3/2.0 | 1,452 (-2%) | 4mo | $255,482 | $176 | 88 |
| 1577 Texas Ave | 0.11mi | 3/2.0 | 1,542 (+4%) | 6mo | $249,900 | $162 | 83 |
| 1691 Nebraska Loop | 0.28mi | 3/2.0 | 1,450 (-2%) | 5mo | $249,900 | $172 | 79 |
| 2359 Oklahoma Dr | 0.00mi | 3/2.0 | 1,263 (-14%) | 6mo | $229,990 | $182 | 71 |
| 2264 Oklahoma Dr | 0.13mi | 3/2.0 | 1,263 (-14%) | 2mo | $244,888 | $194 | 68 |
| 2162 Oklahoma Dr | 0.17mi | 3/2.0 | 1,303 (-12%) | 6mo | $239,900 | $184 | 67 |
| 2383 Oklahoma Dr | 0.07mi | 4/2.0 (+1) | 1,666 (+13%) | 6mo | $269,990 | $162 | 65 |
| 1673 Minnesota Rd | 0.21mi | 3/2.0 | 1,265 (-14%) | 2mo | $250,000 | $198 | 65 |
| 2216 Oklahoma Dr | 0.17mi | 3/2.0 | 1,263 (-14%) | 6mo | $239,990 | $190 | 63 |
| 2234 Oklahoma Dr | 0.17mi | 4/2.0 (+1) | 1,666 (+13%) | 4mo | $294,990 | $177 | 62 |
Match score weights: distance 35% · size 25% · config 20% · recency 20%. Top-matched comps best support the ARV.
Projected returns pro-forma
3.0% appreciation · 3.0% rent growth · sell at horizon
- IRR
- 4.1%
- Equity multiple
- 1.24×
- Total profit
- $17,203
- Equity at exit
- $117,550
- IRR
- 7.3%
- Equity multiple
- 2.11×
- Total profit
- $81,473
- Equity at exit
- $181,158
Cash invested: $73,200 (down + closing). Projections, not guarantees.
Landlord ↔ Tenant lean methodology
- Overall (STATE)
- 87 Strongly Landlord-Friendly
- State Florida
- 87 Strongly Landlord-Friendly · R+3
- County
- — inherits STATE
- City
- — inherits STATE
ZIP-level market 33585
- Active inventory
- 44
- Price-to-rent
- 10.5×
Monthly cashflow live
- Estimated rent
- $2,059 medium interval (Pro) →
- Mortgage (P&I)
- −$1,371
- Tax est. 1.5%
- −$327 /mo · $3,921/yr
- Insurance
- −$109
- HOA
- −$45
- Vacancy / Maint / Mgmt
- −$432
- Net cashflow
- $-225
Break-even live
Sensitivity live
| Price | -10% $-45 | -5% $-135 | +0% $-225 | +5% $-316 | +10% $-406 |
|---|---|---|---|---|---|
| Rent | -10% $-388 | -5% $-307 | +0% $-225 | +5% $-144 | +10% $-63 |
| Rate | -1.0pp $-94 | -0.5pp $-159 | base $-225 | +0.5pp $-293 | +1.0pp $-362 |
UW: 25.0% down · 7.5% · 30yr · 1.5% tax · 5.0% vac · 8.0% maint · 8.0% mgmt
Financing live
Cash to close
- Down payment
- $65,357
- Closing costs
- $7,843
- Reserves months
- —
- Total cash needed
- —
Loan-product check · same deal, 3 products live
Conventional
25% down · 7.5% · 30yr
- Down + closing
- —
- Monthly P&I
- —
- Monthly cashflow
- —
- DSCR
- —
- Eligible?
- —
Personal DTI + credit; lowest rate.
DSCR
20% down · 8.5% · 30yr
- Down + closing
- —
- Monthly P&I
- —
- Monthly cashflow
- —
- DSCR
- —
- Eligible?
- —
No personal income docs; deal must DSCR.
Hard money
10% down · 12.0% · 12mo
- Down + closing
- —
- Monthly P&I
- —
- Monthly cashflow
- —
- DSCR
- —
- Eligible?
- —
Short-term bridge; refi at stabilization.
Rent comps 4 comps
| Address | Beds | Baths | Sqft | Rent | $/sqft | DOM | Units | Dist |
|---|---|---|---|---|---|---|---|---|
| 1607 Texas Ave Sumterville, FL | 4.0 | 2.0 | 1722 | $2,200 | $1.28 | 23d | 1 | 0.02mi |
| 1610 Minnesota Rd Sumterville, FL | 3.0 | 2.0 | 1452 | $1,995 | $1.37 | 23d | 1 | 0.18mi |
| 1709 Nebraska Loop Sumterville, FL | 3.0 | 2.5 | 1557 | $2,025 | $1.30 | 23d | 1 | 0.27mi |
| 1729 Nebraska Loop Bushnell, FL | 3.0 | 2.0 | 1263 | $1,795 | $1.42 | 23d | 1 | 0.31mi |
HOA detail
- Monthly dues
- $45 · $540/yr
Listing history 40 events
-
2026-06-22days on market $259,888 Active 269 DOM
-
2026-06-19days on market $259,888 Active 267 DOM
-
2026-06-18days on market $259,888 Active 266 DOM
-
2026-06-17days on market $259,888 Active 265 DOM
-
2026-06-16days on market $259,888 Active 264 DOM
-
2026-06-15days on market $259,888 Active 263 DOM
-
2026-06-14days on market $259,888 Active 261 DOM
-
2026-06-13pricedays on market $259,888 Active 260 DOM
-
2026-06-10days on market $260,358 Active 258 DOM
-
2026-06-09days on market $260,358 Active 257 DOM
-
2026-06-08days on market $260,358 Active 256 DOM
-
2026-06-07days on market $260,358 Active 255 DOM
-
2026-06-02days on market $260,358 Active 250 DOM
-
2026-06-01days on market $260,358 Active 249 DOM
-
2026-05-31days on market $260,358 Active 248 DOM
-
2026-05-30pricedays on market $260,358 Active 247 DOM
-
2026-04-24price $259,888
-
2026-04-24price $277,460
-
2026-04-24price $288,460
-
2026-04-22price $241,888
-
2026-04-22status Active
-
2026-03-06status Pending
-
2026-02-12price $239,888
-
2026-02-11price $249,888
-
2026-01-10price $244,888
-
2025-12-24price $239,888
-
2025-12-23status Active
-
2025-12-23price $229,888
-
2025-11-14status Pending
-
2025-11-14price $219,888
-
2025-11-13price $234,990
-
2025-11-13status Active
-
2025-10-21status Pending
-
2025-10-10status Active
-
2025-10-07status Pending
-
2025-10-04price $229,990
-
2025-09-25price $239,990
-
2025-09-17price $250,990
-
2025-09-15price $269,990
-
2025-06-05$273,990 Active
ⓘ Source: listings_history table (triggers on properties + properties_extension) + one-shot
backfill from property_details.listing_events for pre-trigger history.
Nearby sold comps map
Loading sold comps map…
Walkable amenities ~0.75 mi
Loading nearby amenities…
Taxation est. · year 1
- Rental income
- $24,705
- − Mortgage interest
- −$14,644
- − Property taxes
- −$3,921
- − Insurance
- −$1,307
- − Repairs & maintenance
- −$1,976
- − Management
- −$1,976
- − HOA
- −$540
- − Depreciation
- −$7,605
- Taxable loss
- −$7,266
- Est. tax savings @ 24.0%
- +$1,744
- After-tax cash flow
- $-960/yr
For passive investors: Depreciation is non-cash, so a rental often shows a tax loss while cash-flowing — sheltering income. Rental losses are passive: they offset passive income freely, and up to $25,000/yr can offset ordinary (W-2) income if you actively participate and your MAGI is under $100k (phasing out to $0 by $150k); unused losses carry forward. On sale, claimed depreciation is recaptured at up to 25%, and gains may owe capital-gains tax (a 1031 exchange can defer both). Figures are a year-1 estimate at your 24.0% rate — not tax advice; consult a CPA.
Schools (NCES district)
- District
- Sumter
- NCES district ID
- 1201800
- Math proficiency
- 61% ▼ -4.00%
- Reading proficiency
- 61% ▼ -2.00%
- Median HH income
- $48,240
- Composite
- 51.74/100
- National rank
- #1682
- State rank
- #11 of 73 in FL
Livability — Bushnell
- Score
- 58/100
- State rank
- #835
- US rank
- #20676
Category grades
Schools grade is shown separately in the Schools card above.
Census & demographics
- Census place
- Bushnell, FL
- Population (ZIP)
- 1,424
Population outlook (Sumter County) Hauer SSP2
- Today (2025)
- 161,172 people
- By 2030
- 180,083 · +11.7%
- By 2040
- 209,892 · +30.2%
- By 2050
- 234,186 · +45.3%
- By 2075
- 284,602 · +76.6%
- By 2100
- 317,039 · +96.7%
Race, ethnicity, and origin ACS 2023
- Neighborhood character
- Predominantly White (69%)
- Race & ethnicity
- White 69% Hispanic / Latino 30% Two or more races 8%
- Hispanic origin (detail)
- Mexican 8% Puerto Rican 17% Cuban 5%
- Common ancestry
- Lithuanian 3% Scotch-Irish 2% Italian 2%
- Foreign-born
- 6% · Canada
- Languages at home
- 84% English-only · Spanish 15% French/Haitian/Cajun 1%
Political lean MEDSL · Sumter
- 2024 margin
- Solid R (+37.6) · D 30.9% · R 68.6%
- 2008→2024 swing
- -10.6pp toward R · 2008: -27.0pp · 2024: -37.6pp
- All cycles
- 2024: R+37.6 2020: R+36.1 2016: R+39.2 2012: R+34.9 2008: R+27.0
Not yet ingested
- Civics
- —
Market trends
- HPI YoY
- —
- Current HPI
- —
- Rent YoY
- —
- Metro
- —
- State GDP YoY
- ▲ 3.28%
- F500 in state
- 36
Industry mix (Fortune 500 HQ in FL)
| Industry | F500 HQs | Revenue |
|---|---|---|
| Industrial Technology | 2 | $29B |
|
||
| Insurance | 2 | $17B |
|
||
| Retail | 1 | $60B |
|
||
| Technology Distribution | 1 | $58B |
|
||
| Homebuilding | 1 | $35B |
|
||
| Technology Manufacturing | 1 | $35B |
|
||
Price history
-5.1% since first listed24 events — show timeline
- 2026-04-24 Price Changed $259,888 Stellar MLS as Distributed by MLS Grid
- 2026-04-24 Price Changed $277,460 Stellar MLS as Distributed by MLS Grid
- 2026-04-24 Price Changed $288,460 Stellar MLS as Distributed by MLS Grid
- 2026-04-22 Price Changed $241,888 Stellar MLS as Distributed by MLS Grid
- 2026-04-22 Relisted — Stellar MLS as Distributed by MLS Grid
- 2026-03-06 Pending — Stellar MLS as Distributed by MLS Grid
- 2026-02-12 Price Changed $239,888 Stellar MLS as Distributed by MLS Grid
- 2026-02-11 Price Changed $249,888 Stellar MLS as Distributed by MLS Grid
- 2026-01-10 Price Changed $244,888 Stellar MLS as Distributed by MLS Grid
- 2025-12-24 Price Changed $239,888 Stellar MLS as Distributed by MLS Grid
- 2025-12-23 Relisted — Stellar MLS as Distributed by MLS Grid
- 2025-12-23 Price Changed $229,888 Stellar MLS as Distributed by MLS Grid
- 2025-11-14 Pending — Stellar MLS as Distributed by MLS Grid
- 2025-11-14 Price Changed $219,888 Stellar MLS as Distributed by MLS Grid
- 2025-11-13 Price Changed $234,990 Stellar MLS as Distributed by MLS Grid
- 2025-11-13 Relisted — Stellar MLS as Distributed by MLS Grid
- 2025-10-21 Pending — Stellar MLS as Distributed by MLS Grid
- 2025-10-10 Relisted — Stellar MLS as Distributed by MLS Grid
- 2025-10-07 Pending — Stellar MLS as Distributed by MLS Grid
- 2025-10-04 Price Changed $229,990 Stellar MLS as Distributed by MLS Grid
- 2025-09-25 Price Changed $239,990 Stellar MLS as Distributed by MLS Grid
- 2025-09-17 Price Changed $250,990 Stellar MLS as Distributed by MLS Grid
- 2025-09-15 Price Changed $269,990 Stellar MLS as Distributed by MLS Grid
- 2025-06-05 Listed $273,990 Stellar MLS as Distributed by MLS Grid
Cash-flow waterfall
monthlySold comps — $/sqft
last 12 mo · ≤1 miLoading sold comps…