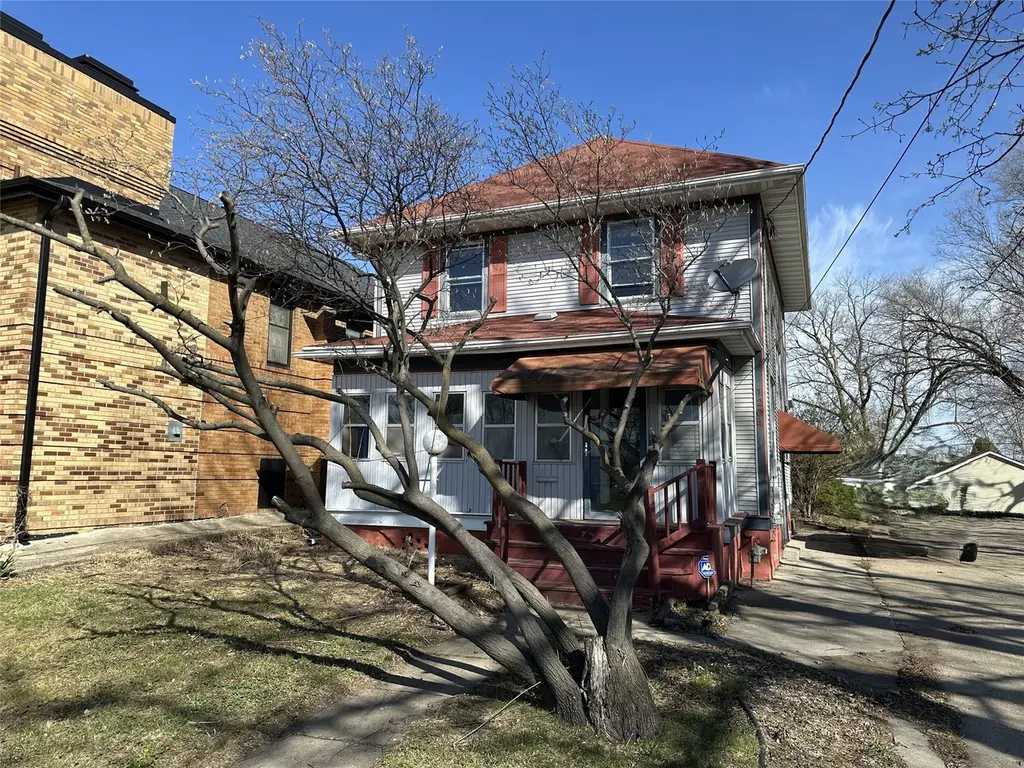
1204 Walker St · Des Moines, IA
Flood risk 1/10 · Minimal
- FEMA flood zone
- X (unshaded)
- Chance of flooding over 30 yrs
- 0.0%
- Est. flood insurance / yr
- $473 – $860
Fire risk 1/10 · Minimal
- Est. fire insurance / yr
- $902 – $1,676
Heat risk 3/10 · Minor
- Hot days now (above 103°F)
- 7 days/yr
- Hot days in 30 yrs
- 15 days/yr
Wind risk 2/10 · Minimal
- Chance of severe wind over 30 yrs
- —
Air-quality risk 2/10 · Minimal
- Unhealthy air days now
- 1 days/yr
- Unhealthy air days in 30 yrs
- 2 days/yr
Risk factors via First Street. Map © Google.
Why this score? — see what drove the C+ grade
The composite is a weighted blend of 9 inputs, each scored 0–100. Each bar is that input's sub-score; the figure is the points it added to the 100-point composite (weight × sub-score).
- Cash flow +22.8/30.0
- ARV discount +11.3/15.0
- DSCR +7.3/10.0
- 1% rule +6.1/10.0
- Livability +4.0/5.0
- Schools +3.8/10.0
- Rent growth +2.5/5.0
- Condition / age +2.5/5.0
- Appreciation +0.0/10.0
$135,900
🖨 Deal sheet 📄 Offer letter ✓ Due diligence
Listing remarks
This 2 story home showcases the view of the Capitol. Spacious family room and kitchen with original woodwork, 2 bedrooms upstairs with a full bath. Unfinished basement. Conveniently located close to schools, parks, downtown Des Moines and the interstate.
Key facts
- View of the capitol
- Original woodwork
- 5,625 sq ft lot
Tags
Property features AI
Finance
- HOA & community: Sidewalks
Exterior
- Utilities: Public water; Public sewer
- Home design: 2-story home
- Construction: Vinyl siding; Brick/mortar foundation; Asphalt shingle roof
- Exterior features: Deck; Storage structure; Concrete road access; Rectangular lot
Interior
- Flooring: Carpet; Vinyl
- Bathrooms: 1 full bathroom; 1 half bathroom
- Heating & cooling: Forced air heating; Natural gas
- Interior features: Dining area; Carpet flooring; Vinyl flooring; Unfinished basement
Neighborhood map
What this means for you Summary
Snapshot
- This is a 2-bed/1.5-bath single-family listed at $136k.
Deal economics
- At list price, monthly cash flow is $235 ($3k/yr) — positive.
- The deal already cash-flows at list — no discount required.
- Meets the 1% rule at list price ($2k rent vs $136k).
- Recommended offer: $132k (3.0% below list) — sets the bar for market timing.
- Cap rate 8.4% vs local median 3.1% in Des Moines — top-decile yield for the area; either an underpriced asset or a hidden risk that comps aren't pricing in. Stress-test before assuming the spread holds.
Location & tenants
- Location reads 81/100 on livability (#63 in IA, #1,432 nationally) — a professional / high-income tenant draw. Strengths: commute A+, cost of living A+, housing A+; Watch: employment C-, schools D+, crime F.
- Des Moines Independent Community School District (urban): math 43% / reading 46% proficiency, ranked #289 of 289 in IA (top 100%) — families likely to look elsewhere, expect single-tenant / working-renter base with shorter leases; 63% free/reduced lunch — lower-income household profile, screen leases tightly.
- Market conditions: 105 active listings in the ZIP; 26 comparable units currently listed for rent nearby; rentals at typical pace (median 21d on market — plan ~3-4 weeks tenant-placement turnaround); 2,953 units permitted in Polk County in 2024 (540 in 5+ unit buildings).
Forward outlook
- Local home prices are declining (-3.0%/yr); year-one equity from $940 of loan paydown is wiped out by about $4k of value loss. Plan a longer hold.
- Polk County population projected at +37% by 2050 — long-run rental-demand tailwind backs the buy-and-hold thesis.
Negotiation context
- It's been on market 50 days — a 3% lower offer ($132k) is reasonable based on typical stale-listing flexibility.
- 3 sale attempts since 3y ago with the ask held roughly flat each time — persistent listings suggest the price (not the market) is what's stuck; bring a comps-based counter.
Risks & watch-outs
- Watch-outs: built in 1908 — expect roof / HVAC / electrical / plumbing capex.
Questions for the listing agent
- It's been on market 50 days. Have you received any prior offers? Is the seller open to a 3% concession, seller financing, or rate buy-down credit?
- Built in 1908 — when were the roof, HVAC, electrical panel, plumbing, and water heater last replaced?
- Is there a deadline driving the sale (1031 exchange, divorce, estate, relocation)? That informs how much negotiation room exists.
- Schools are D-rated, which usually means shorter tenancies and higher turnover. Who's the typical renter profile here, and what's been the actual vacancy rate?
- Crime grade is F in this area — have there been break-ins, vandalism, or insurance claims at this property in the last 3 years? What carrier currently insures it and at what premium?
- What's the average days-on-market for RENTAL listings here right now (not sales)? A rising rental-DOM trend means longer vacancies and softer asking-rent achievability than the comps imply.
- What's the recent tenant-quality profile in this submarket — average credit score on applications, eviction rate, late-payment / NSF rate, and stable-employment percentage? A property-management company in the area should have these aggregated.
- How much new for-sale + rental construction is in the pipeline within 1–3 miles? Heavy new supply typically softens prices + rents 12–24 months out; constrained supply supports both.
Investment metrics
- 1% rule
- 1.11% ✓
- Cap rate
- 8.37%
- Cash-on-cash
- 7.42%
- DSCR
- 1.33
- GRM
- 7.5
CMA / ARV
- ARV (median comp)
- $148,577
- List price
- $135,900
- Delta
- -8.53%
- Verdict
- FAIR
- Comps
- 20 within 1.0 mi
Show comp detail 12 sales within ~0.75 mi
| Address | Dist | Beds/Ba | Sqft | Sold | Price | $/sf | Match |
|---|---|---|---|---|---|---|---|
| 1225 E 13th St | 0.28mi | 3/1.0 (+1) | 1,408 (-1%) | 6mo | $165,000 | $117 | 73 |
| 1213 Fremont St | 0.12mi | 3/1.0 (+1) | 1,310 (-8%) | 5mo | $145,000 | $111 | 70 |
| 1018 E 9th St | 0.20mi | 3/2.0 (+1) | 1,409 (-1%) | 17mo | $260,000 | $185 | 68 |
| 833 Walker St | 0.22mi | 3/1.0 (+1) | 1,348 (-5%) | 7mo | $175,000 | $130 | 68 |
| 1334 E 13th St | 0.44mi | 3/2.0 (+1) | 1,409 (-1%) | 10mo | $232,000 | $165 | 62 |
| 840 Walker St | 0.21mi | 3/2.0 (+1) | 1,358 (-4%) | 17mo | $118,000 | $87 | 62 |
| 1236 York St | 0.32mi | 3/1.5 (+1) | 1,303 (-8%) | 9mo | $126,500 | $97 | 58 |
| 1245 E 16th St | 0.57mi | 3/2.0 (+1) | 1,285 (-10%) | 1mo | $277,000 | $216 | 49 |
| 1218 Mccormick St | 0.55mi | 3/2.5 (+1) | 1,324 (-7%) | 8mo | $265,000 | $200 | 47 |
| 1657 Walker St | 0.61mi | 3/2.0 (+1) | 1,344 (-6%) | 10mo | $65,000 | $48 | 47 |
| 1322 York St | 0.42mi | 3/1.0 (+1) | 1,560 (+10%) | 16mo | $102,000 | $65 | 44 |
| 1431 E 15th St | 0.69mi | 3/1.0 (+1) | 1,295 (-9%) | 7mo | $144,000 | $111 | 40 |
Match score weights: distance 35% · size 25% · config 20% · recency 20%. Top-matched comps best support the ARV.
Projected returns pro-forma
-3.0% appreciation · 3.0% rent growth · sell at horizon
- IRR
- -4.9%
- Equity multiple
- 0.82×
- Total profit
- $-7,011
- Equity at exit
- $20,263
- IRR
- 4.8%
- Equity multiple
- 1.35×
- Total profit
- $13,321
- Equity at exit
- $11,750
Cash invested: $38,052 (down + closing). Projections, not guarantees.
Landlord ↔ Tenant lean methodology
- Overall (STATE)
- 83 Strongly Landlord-Friendly
- State Iowa
- 83 Strongly Landlord-Friendly · R+6
- County
- — inherits STATE
- City
- — inherits STATE
ZIP-level market 50316
- Home prices YoY
- -29.5%
- Active inventory
- 105
- Price-to-rent
- 7.5×
Monthly cashflow live
- Estimated rent
- $1,512 high interval (Pro) →
- Mortgage (P&I)
- −$713
- Tax from tax record
- −$190 /mo · $2,278/yr
- Insurance
- −$57
- HOA
- −$0
- Vacancy / Maint / Mgmt
- −$317
- Net cashflow
- $235
Break-even live
UW: 25.0% down · 7.5% · 30yr · 1.5% tax · 5.0% vac · 8.0% maint · 8.0% mgmt
Financing live
Cash to close
- Down payment
- $33,975
- Closing costs
- $4,077
- Reserves months
- —
- Total cash needed
- —
Loan-product check · same deal, 3 products live
Conventional
25% down · 7.5% · 30yr
- Down + closing
- —
- Monthly P&I
- —
- Monthly cashflow
- —
- DSCR
- —
- Eligible?
- —
Personal DTI + credit; lowest rate.
DSCR
20% down · 8.5% · 30yr
- Down + closing
- —
- Monthly P&I
- —
- Monthly cashflow
- —
- DSCR
- —
- Eligible?
- —
No personal income docs; deal must DSCR.
Hard money
10% down · 12.0% · 12mo
- Down + closing
- —
- Monthly P&I
- —
- Monthly cashflow
- —
- DSCR
- —
- Eligible?
- —
Short-term bridge; refi at stabilization.
Rent comps 26 comps
| Address | Beds | Baths | Sqft | Rent | $/sqft | DOM | Units | Dist |
|---|---|---|---|---|---|---|---|---|
| 1301 E 12th St Unit 2 Des Moines, IA | 2.0 | 1.0 | 995 | $795 | $0.80 | 23d | 1 | 0.38mi |
| 1513 Des Moines St Des Moines, IA | 3.0 | 1.0 | 900 | $995 | $1.11 | 23d | 1 | 0.44mi |
| 1525 Des Moines St Des Moines, IA | 3.0 | 1.0 | 928 | $1,195 | $1.29 | 43d | 1 | 0.46mi |
| 1354 E 12th St Des Moines, IA | 2.0 | 1.0 | 1300 | $925 | $0.71 | 43d | 1 | 0.52mi |
| 700 E 5th St Des Moines, IA | 4.0 | 1.0–1.5 | 686 | $1,008 | $1.47 | 14d | 25 | 0.58mi |
| 220 Maple St Des Moines, IA | 1.0–3.0 | 1.0–3.0 | 1158 | $2,028 | $1.75 | 14d | 9 | 0.65mi |
| 309 E 5th St #406 Des Moines, IA | 1.0 | 1.0 | 1057 | $1,700 | $1.61 | 43d | 1 | 0.68mi |
| 300 E Grand Ave Des Moines, IA | 2.0 | 1.0–2.0 | 734 | $1,500 | $2.04 | 14d | 4 | 0.70mi |
| 410 E 17th St Des Moines, IA | 3.0 | 1.0 | 1000 | $1,695 | $1.70 | 43d | 1 | 0.70mi |
| 333 E Grand Ave Des Moines, IA | 2.0 | 1.0–2.0 | 668 | $1,450 | $2.17 | 23d | 4 | 0.73mi |
| 1530 E 14th St Des Moines, IA | 3.0 | 2.0 | 1428 | $1,900 | $1.33 | 14d | 1 | 0.73mi |
| 915 E Washington Ave Des Moines, IA | 3.0 | 1.0 | 1457 | $1,450 | $1.00 | 23d | 1 | 0.74mi |
| 601 E Vine St Des Moines, IA | 2.0 | 1.0–2.0 | 730 | $1,595 | $2.18 | 19d | 19 | 0.81mi |
| 201 SE 6th St Des Moines, IA | 2.0 | 1.0–2.0 | 835 | $1,660 | $1.99 | 14d | 11 | 0.87mi |
| 101 2nd Ave Des Moines, IA | 1.0–2.0 | 1.0–2.0 | 948 | $1,224 | $1.29 | 14d | 21 | 1.16mi |
| 100 2nd Ave Des Moines, IA | 1.0–2.0 | 1.0–2.0 | 836 | $1,150 | $1.37 | 21d | 23 | 1.22mi |
| 308 Court Ave Des Moines, IA | 1.0–2.0 | 1.0–2.0 | 844 | $1,350 | $1.60 | 14d | 11 | 1.24mi |
| 103 SW 3rd St Des Moines, IA | 2.0 | 1.0–2.0 | 725 | $2,043 | $2.82 | 14d | 17 | 1.25mi |
| 2120 Capitol Ave Des Moines, IA | 3.0 | 1.0 | 973 | $1,395 | $1.43 | 43d | 1 | 1.25mi |
| 312 Court Ave Des Moines, IA | 1.0–2.0 | 1.0–2.0 | 771 | $1,347 | $1.75 | 14d | 6 | 1.27mi |
| 119 4th St #110 Des Moines, IA | 2.0 | 2.0 | 1158 | $1,900 | $1.64 | 43d | 1 | 1.29mi |
| 405 6th Ave Des Moines, IA | 2.0 | 1.0–2.0 | 737 | $1,200 | $1.63 | 14d | 14 | 1.31mi |
| 604 Locust St Des Moines, IA | 1.0–2.0 | 1.0–2.0 | 902 | $1,743 | $1.93 | 14d | 5 | 1.35mi |
| 218 6th Ave Unit 401 Des Moines, IA | 2.0 | 1.0 | 1085 | $1,295 | $1.19 | 43d | 1 | 1.37mi |
| 9066 Burkwood Dr West Des Moines, IA | 3.0 | 2.5–3.5 | 1783 | $1,960 | $1.10 | 23d | 2 | 1.40mi |
| 1405 SE 1st St Des Moines, IA | 1.0–2.0 | 1.0–2.0 | 802 | $1,435 | $1.79 | 14d | 8 | 1.46mi |
Listing history 22 events
-
2026-06-18days on market $135,900 Active 50 DOM
-
2026-06-17days on market $135,900 Active 49 DOM
-
2026-06-16days on market $135,900 Active 48 DOM
-
2026-06-15days on market $135,900 Active 47 DOM
-
2026-06-14days on market $135,900 Active 45 DOM
-
2026-06-13days on market $135,900 Active 44 DOM
-
2026-06-10days on market $135,900 Active 42 DOM
-
2026-06-09days on market $135,900 Active 41 DOM
-
2026-06-08days on market $135,900 Active 40 DOM
-
2026-06-07days on market $135,900 Active 39 DOM
-
2026-06-05days on market $135,900 Active 36 DOM
-
2026-06-03days on market $135,900 Active 35 DOM
-
2026-06-02days on market $135,900 Active 34 DOM
-
2026-06-01days on market $135,900 Active 33 DOM
-
2026-05-31days on market $135,900 Active 32 DOM
-
2026-05-31days on market $135,900 Active 31 DOM
-
2026-04-29$135,900 Active 254-char remark
-
2024-10-11historical
-
2024-06-14price $173,900
-
2024-05-13status Active
-
2024-05-10historical
-
2023-11-10$174,900 Active
ⓘ Source: listings_history table (triggers on properties + properties_extension) + one-shot
backfill from property_details.listing_events for pre-trigger history.
Tax reassessment forecast IA · Partial reset (capped growth)
- Current annual tax
- $2,278 · $190/mo
- Projected year-2 tax
- $2,278 · $190/mo
- Expected delta
- $0/yr ($0/mo · 0.0%)
ⓘ Screening estimate from a state-policy table — verify with the county assessor before closing.
Climate risk First Street
- Flood 1/10 Low FEMA zone X (unshaded) · 0% chance over 30 yrs
- Wildfire 1/10 Low
- Heat 3/10 Moderate 7 d/yr ≥103°F today · 15 d/yr by 30 yrs out
- Wind 2/10 Low
- Air quality 2/10 Low 1 unhealthy d/yr today · 2 by 30 yrs out
Nearby sold comps map
Loading sold comps map…
Walkable amenities ~0.75 mi
Loading nearby amenities…
Taxation est. · year 1
- Rental income
- $18,141
- − Mortgage interest
- −$7,613
- − Property taxes
- −$2,278
- − Insurance
- −$680
- − Repairs & maintenance
- −$1,451
- − Management
- −$1,451
- − Depreciation
- −$3,953
- Taxable income
- $715
- Est. tax owed @ 24.0%
- −$172
- After-tax cash flow
- $2,650/yr
For passive investors: Depreciation is non-cash, so a rental often shows a tax loss while cash-flowing — sheltering income. Rental losses are passive: they offset passive income freely, and up to $25,000/yr can offset ordinary (W-2) income if you actively participate and your MAGI is under $100k (phasing out to $0 by $150k); unused losses carry forward. On sale, claimed depreciation is recaptured at up to 25%, and gains may owe capital-gains tax (a 1031 exchange can defer both). Figures are a year-1 estimate at your 24.0% rate — not tax advice; consult a CPA.
Schools (NCES district)
- District
- Des Moines Independent Community School District
- NCES district ID
- 1908970
- Math proficiency
- 43% ▼ -6.00%
- Reading proficiency
- 46% ▼ -1.00%
- Median HH income
- $45,905
- Composite
- 37.83/100
- National rank
- #4331
- State rank
- #289 of 289 in IA
Livability — Des Moines
- Score
- 81/100
- State rank
- #63
- US rank
- #1432
Category grades
Schools grade is shown separately in the Schools card above.
Census & demographics
- Census place
- Des Moines, IA
- City population
- 203,612
- Population (ZIP)
- 16,188
Population outlook (Polk County) Hauer SSP2
- Today (2025)
- 548,042 people
- By 2030
- 588,557 · +7.4%
- By 2040
- 670,629 · +22.4%
- By 2050
- 752,830 · +37.4%
- By 2075
- 955,069 · +74.3%
- By 2100
- 1,115,436 · +103.5%
Race, ethnicity, and origin ACS 2023
- Neighborhood character
- Diverse neighborhood (Simpson 0.68)
- Race & ethnicity
- White 48% Hispanic / Latino 27% Black 12% Two or more races 12% Asian 7% Native American 1%
- Hispanic origin (detail)
- Mexican 21% Puerto Rican 1%
- Common ancestry
- Portuguese 2% Slovak 1% Iranian 1%
- Foreign-born
- 16% · Canada, Vietnam, Philippines
- Languages at home
- 69% English-only · Spanish 20% Other Asian/Pacific 3% Vietnamese 2%
Political lean MEDSL · Polk
- 2024 margin
- D (+10.9) · D 54.8% · R 43.9% · Other 1.3%
- 2008→2024 swing
- -3.7pp toward R · 2008: 14.6pp · 2024: 10.9pp
- All cycles
- 2024: D+10.9 2020: D+15.2 2016: D+11.5 2012: D+14.2 2008: D+14.6
Not yet ingested
- Civics
- —
Market trends
- HPI YoY
- ▼ -121.34%
- Current HPI
- 290.3838
- Rent YoY
- —
- Metro
- —
- State GDP YoY
- ▲ 2.48%
- F500 in state
- 4
Industry mix (Fortune 500 HQ in IA)
| Industry | F500 HQs | Revenue |
|---|---|---|
| Financial Services | 1 | $16B |
|
||
| Retail / Convenience | 1 | $15B |
|
||
Price history
-22.3% since first listed6 events — show timeline
- 2026-04-29 Listed $135,900 DMMLS
- 2024-10-11 Listing Removed — DMMLS
- 2024-06-14 Price Changed $173,900 DMMLS
- 2024-05-13 Relisted — DMMLS
- 2024-05-10 Listing Removed — DMMLS
- 2023-11-10 Listed $174,900 DMMLS
Property tax history
+1.4%/yrLatest (2025): $2,278 · -3.5% YoY. Source: county tax records.
Cash-flow waterfall
monthlySold comps — $/sqft
last 12 mo · ≤1 miLoading sold comps…