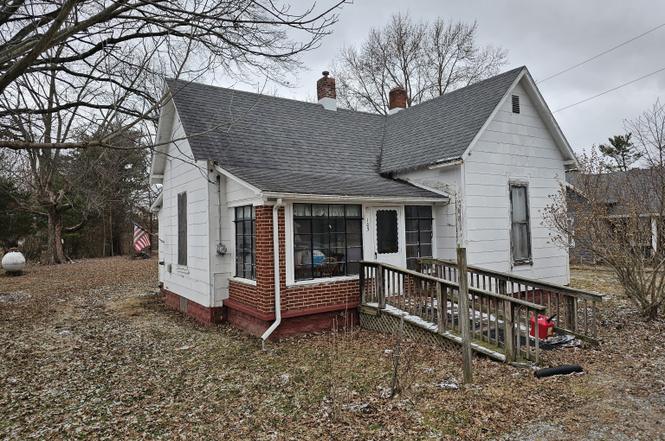
103 N Franklin St · Fairland, IN
Flood risk 1/10 · Minimal
- FEMA flood zone
- X (unshaded)
- Chance of flooding over 30 yrs
- 0.0%
- Est. flood insurance / yr
- $507 – $1,088
Fire risk 1/10 · Minimal
- Est. fire insurance / yr
- $717 – $1,331
Heat risk 3/10 · Minor
- Hot days now (above 103°F)
- 7 days/yr
- Hot days in 30 yrs
- 19 days/yr
Wind risk 2/10 · Minimal
- Chance of severe wind over 30 yrs
- 1.0%
Air-quality risk 2/10 · Minimal
- Unhealthy air days now
- 1 days/yr
- Unhealthy air days in 30 yrs
- 2 days/yr
Risk factors via First Street. Map © Google.
Why this score? — see what drove the C+ grade
The composite is a weighted blend of 9 inputs, each scored 0–100. Each bar is that input's sub-score; the figure is the points it added to the 100-point composite (weight × sub-score).
- Cash flow +26.5/30.0
- DSCR +9.0/10.0
- ARV discount +7.5/15.0
- 1% rule +6.0/10.0
- Schools +4.1/10.0
- Livability +3.0/5.0
- Rent growth +2.5/5.0
- Condition / age +2.5/5.0
- Appreciation +0.0/10.0
$89,000
🖨 Deal sheet 📄 Offer letter ✓ Due diligence
Listing remarks MLS
Take a step back into yester-year in this 1890 home on a dead-end street. Triton Schools! This home has 2 generous sized bedrooms, one with hardwood floors, that we think may be under the rest of the carpet. The living room is 13x13 and attached the enclosed front porch. There's room for everyone to gather in the large eat-in kitchen that has lots of cabinets and countertop space. Table and chairs and appliances included. The back yard offers room to relax under the shade of mature trees. Locally there's a pizza place, Dollar General and an ice cream shop. This is located close to I-74, Horseshoe Indianapolis, McDonalds and Pilot gas station. This home raised a happy family for years, and now needs someone else to show it some love! Great opportunity! Sold as-is.
Key facts
- Large eat-in kitchen
- Open backyard
- Historic home
Tags
Property features AI
Exterior
- Parking: No garage
- Utilities: Private water source; Septic system; Leased propane
- Home design: Single-family residence; One level; Fixer condition
- Construction: Block and partial wood foundation (see remarks); Other construction materials
- Exterior features: Glass-enclosed and screened porch/patio; Mature trees on the lot
Interior
- Kitchen: Gas oven; Refrigerator
- Bedrooms: 2 bedrooms (both on the main level)
- Flooring: Hardwood
- Bathrooms: 1 full bathroom (main level)
- Heating & cooling: Forced air heating (propane); Window air conditioning units
- Interior features: Attic access; Hardwood floors; Eat-in kitchen
- Laundry & utility: No laundry facilities
Neighborhood map
What this means for you Summary
Snapshot
- This is a 2-bed/1.0-bath single-family listed at $89k.
Deal economics
- At list price, monthly cash flow is $235 ($3k/yr) — positive.
- The deal already cash-flows at list — no discount required.
- Meets the 1% rule at list price ($975 rent vs $89k).
- Recommended offer: $81k (9.0% below list) — sets the bar for market timing.
Location & tenants
- Location reads 59/100 on livability (#551 in IN) — a working-class tenant base; expect higher turnover. Strengths: cost of living A+, housing A+; Watch: employment D+, amenities F, commute F.
- Northwestern Consolidated School Corporation (rural): math 45% / reading 48% proficiency, ranked #71 of 301 in IN (top 24%) — families likely to look elsewhere, expect single-tenant / working-renter base with shorter leases.
- Zoned schools: Triton Central Elementary School (math 59% / reading 40%, grade D, #279 of 994 statewide, top 30%, 514 students, 42% FRL); Triton Central High School (math 37% / reading 77%, grade C, #64 of 369 statewide, top 18%, 457 students, 37% FRL).
- Market conditions: 29 active listings in the ZIP; 285 units permitted in Shelby County in 2024 (147 in 5+ unit buildings).
Forward outlook
- Local home prices are declining (-3.0%/yr); year-one equity from $615 of loan paydown is wiped out by about $3k of value loss. Plan a longer hold.
- Shelby County population projected to shrink 6% by 2050 — rents likely to lag national; underwrite the cash flow, not the appreciation.
- At projected returns (-3.0% appreciation + 3.0% rent growth), your $25k cash investment doubles in ~10 years — after that, you're playing with house money.
Negotiation context
- It's been on market 110 days — a 9% lower offer ($81k) is reasonable based on typical stale-listing flexibility.
- 2 sale attempts since 2y ago; this cycle's ask has dropped $26k (23%) from the opening price — seller is motivated, your offer sets the floor, not the list.
Risks & watch-outs
- Watch-outs: built in 1890 — expect roof / HVAC / electrical / plumbing capex.
Questions for the listing agent
- It's been on market 110 days. Have you received any prior offers? Is the seller open to a 9% concession, seller financing, or rate buy-down credit?
- Built in 1890 — when were the roof, HVAC, electrical panel, plumbing, and water heater last replaced?
- Why hasn't it sold? Are there any deal-killer items the seller is aware of (foundation, flood, title, zoning, code violations)?
- Is there a deadline driving the sale (1031 exchange, divorce, estate, relocation)? That informs how much negotiation room exists.
- What's the average days-on-market for RENTAL listings here right now (not sales)? A rising rental-DOM trend means longer vacancies and softer asking-rent achievability than the comps imply.
- What's the recent tenant-quality profile in this submarket — average credit score on applications, eviction rate, late-payment / NSF rate, and stable-employment percentage? A property-management company in the area should have these aggregated.
- How much new for-sale + rental construction is in the pipeline within 1–3 miles? Heavy new supply typically softens prices + rents 12–24 months out; constrained supply supports both.
Investment metrics
- 1% rule
- 1.10% ✓
- Cap rate
- 9.45%
- Cash-on-cash
- 11.29%
- DSCR
- 1.50
- GRM
- 7.6
CMA / ARV
- ARV (on-the-fly)
- $179,568
- Comps found
- 5
Show comp detail 5 sales within ~0.75 mi
| Address | Dist | Beds/Ba | Sqft | Sold | Price | $/sf | Match |
|---|---|---|---|---|---|---|---|
| 313 W Clark Ln | 0.36mi | 2/1.0 | 1,028 (-0%) | 2mo | $150,000 | $146 | 80 |
| 201 W Burnside Ave | 0.21mi | 2/1.0 | 978 (-5%) | 3mo | $165,000 | $169 | 79 |
| 311 W Burnside Ave | 0.38mi | 2/1.0 | 1,084 (+5%) | 9mo | $188,725 | $174 | 67 |
| 217 W Burnside Ave | 0.30mi | 3/1.0 (+1) | 912 (-12%) | 11mo | $185,000 | $203 | 53 |
| 509 S Mulberry St E | 0.39mi | 3/1.0 (+1) | 1,140 (+10%) | 18mo | $210,000 | $184 | 44 |
Match score weights: distance 35% · size 25% · config 20% · recency 20%. Top-matched comps best support the ARV.
Projected returns pro-forma
-3.0% appreciation · 3.0% rent growth · sell at horizon
- IRR
- 0.5%
- Equity multiple
- 1.02×
- Total profit
- $481
- Equity at exit
- $13,270
- IRR
- 10.1%
- Equity multiple
- 1.78×
- Total profit
- $19,514
- Equity at exit
- $7,695
Cash invested: $24,920 (down + closing). Projections, not guarantees.
Landlord ↔ Tenant lean methodology
- Overall (STATE)
- 90 Strongly Landlord-Friendly
- State Indiana
- 90 Strongly Landlord-Friendly · R+11
- County
- — inherits STATE
- City
- — inherits STATE
ZIP-level market 46126
- Home prices YoY
- -17.5%
- Active inventory
- 29
- Price-to-rent
- 7.6×
Monthly cashflow live
- Estimated rent
- $975 medium interval (Pro) →
- Mortgage (P&I)
- −$467
- Tax from tax record
- −$32 /mo · $382/yr
- Insurance
- −$37
- HOA
- −$0
- Vacancy / Maint / Mgmt
- −$205
- Net cashflow
- $235
Break-even live
UW: 25.0% down · 7.5% · 30yr · 1.5% tax · 5.0% vac · 8.0% maint · 8.0% mgmt
Financing live
Cash to close
- Down payment
- $22,250
- Closing costs
- $2,670
- Reserves months
- —
- Total cash needed
- —
Loan-product check · same deal, 3 products live
Conventional
25% down · 7.5% · 30yr
- Down + closing
- —
- Monthly P&I
- —
- Monthly cashflow
- —
- DSCR
- —
- Eligible?
- —
Personal DTI + credit; lowest rate.
DSCR
20% down · 8.5% · 30yr
- Down + closing
- —
- Monthly P&I
- —
- Monthly cashflow
- —
- DSCR
- —
- Eligible?
- —
No personal income docs; deal must DSCR.
Hard money
10% down · 12.0% · 12mo
- Down + closing
- —
- Monthly P&I
- —
- Monthly cashflow
- —
- DSCR
- —
- Eligible?
- —
Short-term bridge; refi at stabilization.
Listing history 21 events
-
2026-06-18days on market $89,000 Active 110 DOM
-
2026-06-17days on market $89,000 Active 109 DOM
-
2026-06-16days on market $89,000 Active 108 DOM
-
2026-06-15days on market $89,000 Active 107 DOM
-
2026-06-13days on market $89,000 Active 105 DOM
-
2026-06-13days on market $89,000 Active 104 DOM
-
2026-06-09days on market $89,000 Active 101 DOM
-
2026-06-08days on market $89,000 Active 100 DOM
-
2026-06-07days on market $89,000 Active 99 DOM
-
2026-06-03days on market $89,000 Active 95 DOM
-
2026-06-02days on market $89,000 Active 94 DOM
-
2026-06-01days on market $89,000 Active 93 DOM
-
2026-05-31days on market $89,000 Active 92 DOM
-
2026-05-21price $89,000
-
2026-04-23price $99,900
-
2026-04-10price $103,000
-
2026-03-26price $108,000
-
2026-02-28$115,000 Active
-
2024-09-06soldstatus $105,000 Closed 782-char remark
Show marketing remark (782 chars)
Take a step back into yester-year in this 1890 home on a dead-end street. Triton Schools! This home has 2 generous sized bedrooms, one with hardwood floors, that we think may be under the rest of the carpet. The living room is 13x13 and attached the enclosed front porch. There's room for everyone to gather in the large eat-in kitchen that has lots of cabinets and countertop space. Table and chairs and appliances included. The back yard offers room to relax under the shade of mature trees. Locally there's a pizza place, Dollar General and an ice cream shop. This is located close to I-74, Horseshoe Indianapolis, McDonalds and Pilot gas station. This home raised a happy family for years, and now needs someone else to show it some love! Great opportunity! Sold as-is.
-
2024-07-20status Pending 782-char remark
Show marketing remark (782 chars)
Take a step back into yester-year in this 1890 home on a dead-end street. Triton Schools! This home has 2 generous sized bedrooms, one with hardwood floors, that we think may be under the rest of the carpet. The living room is 13x13 and attached the enclosed front porch. There's room for everyone to gather in the large eat-in kitchen that has lots of cabinets and countertop space. Table and chairs and appliances included. The back yard offers room to relax under the shade of mature trees. Locally there's a pizza place, Dollar General and an ice cream shop. This is located close to I-74, Horseshoe Indianapolis, McDonalds and Pilot gas station. This home raised a happy family for years, and now needs someone else to show it some love! Great opportunity! Sold as-is.
-
2024-07-12$105,000 Active 782-char remark
Show marketing remark (782 chars)
Take a step back into yester-year in this 1890 home on a dead-end street. Triton Schools! This home has 2 generous sized bedrooms, one with hardwood floors, that we think may be under the rest of the carpet. The living room is 13x13 and attached the enclosed front porch. There's room for everyone to gather in the large eat-in kitchen that has lots of cabinets and countertop space. Table and chairs and appliances included. The back yard offers room to relax under the shade of mature trees. Locally there's a pizza place, Dollar General and an ice cream shop. This is located close to I-74, Horseshoe Indianapolis, McDonalds and Pilot gas station. This home raised a happy family for years, and now needs someone else to show it some love! Great opportunity! Sold as-is.
ⓘ Source: listings_history table (triggers on properties + properties_extension) + one-shot
backfill from property_details.listing_events for pre-trigger history.
Tax reassessment forecast IN · Partial reset (capped growth)
- Current annual tax
- $382 · $32/mo
- Projected year-2 tax
- $569 · $47/mo
- Expected delta
- +$187/yr (+$16/mo · 48.9%)
ⓘ Screening estimate from a state-policy table — verify with the county assessor before closing.
Climate risk First Street
- Flood 1/10 Low FEMA zone X (unshaded) · 0% chance over 30 yrs
- Wildfire 1/10 Low
- Heat 3/10 Moderate 7 d/yr ≥103°F today · 19 d/yr by 30 yrs out
- Wind 2/10 Low 100% chance of damaging wind over 30 yrs
- Air quality 2/10 Low 1 unhealthy d/yr today · 2 by 30 yrs out
Nearby sold comps map
Loading sold comps map…
Walkable amenities ~0.75 mi
Loading nearby amenities…
Taxation est. · year 1
- Rental income
- $11,699
- − Mortgage interest
- −$4,985
- − Property taxes
- −$382
- − Insurance
- −$445
- − Repairs & maintenance
- −$936
- − Management
- −$936
- − Depreciation
- −$2,589
- Taxable income
- $1,425
- Est. tax owed @ 24.0%
- −$342
- After-tax cash flow
- $2,472/yr
For passive investors: Depreciation is non-cash, so a rental often shows a tax loss while cash-flowing — sheltering income. Rental losses are passive: they offset passive income freely, and up to $25,000/yr can offset ordinary (W-2) income if you actively participate and your MAGI is under $100k (phasing out to $0 by $150k); unused losses carry forward. On sale, claimed depreciation is recaptured at up to 25%, and gains may owe capital-gains tax (a 1031 exchange can defer both). Figures are a year-1 estimate at your 24.0% rate — not tax advice; consult a CPA.
Schools (NCES district)
- District
- Northwestern Consolidated School Corporation
- NCES district ID
- 1808310
- Math proficiency
- 45% ▼ -8.00%
- Reading proficiency
- 48% ▼ -7.00%
- Median HH income
- $64,664
- Composite
- 41.28/100
- National rank
- #3520
- State rank
- #71 of 301 in IN
Livability — Fairland
- Score
- 59/100
- State rank
- #551
- US rank
- #19720
Category grades
Schools grade is shown separately in the Schools card above.
Census & demographics
- Census place
- Fairland, IN
- Population (ZIP)
- 3,976
Population outlook (Shelby County) Hauer SSP2
- Today (2025)
- 45,020 people
- By 2030
- 44,962 · -0.1%
- By 2040
- 44,126 · -2.0%
- By 2050
- 42,110 · -6.5%
- By 2075
- 37,131 · -17.5%
- By 2100
- 29,714 · -34.0%
Race, ethnicity, and origin ACS 2023
- Neighborhood character
- Predominantly White (97%)
- Race & ethnicity
- White 97% Hispanic / Latino 3% Two or more races 2%
- Common ancestry
- Iranian 3% Slovak 3% Romanian 2%
- Foreign-born
- 0%
- Languages at home
- 97% English-only · Spanish 2%
Political lean MEDSL · Shelby
- 2024 margin
- Solid R (+48.0) · D 25.1% · R 73.1% · Other 1.8%
- 2008→2024 swing
- -29.0pp toward R · 2008: -19.0pp · 2024: -48.0pp
- All cycles
- 2024: R+48.0 2020: R+47.7 2016: R+47.2 2012: R+33.5 2008: R+19.0
Not yet ingested
- Civics
- —
Market trends
- HPI YoY
- ▼ -47.27%
- Current HPI
- 222.5211
- Rent YoY
- —
- Metro
- —
- State GDP YoY
- ▲ 2.90%
- F500 in state
- 18
Industry mix (Fortune 500 HQ in IN)
| Industry | F500 HQs | Revenue |
|---|---|---|
| Industrial Machinery | 2 | $37B |
|
||
| Healthcare | 1 | $177B |
|
||
| Pharmaceuticals | 1 | $45B |
|
||
| Metals / Steel | 1 | $18B |
|
||
| Agriculture | 1 | $17B |
|
||
| Packaging | 1 | $12B |
|
||
Price history
-15.2% since first listed8 events — show timeline
- 2026-05-21 Price Changed $89,000 MIBOR as Distributed by MLS Grid
- 2026-04-23 Price Changed $99,900 MIBOR as Distributed by MLS Grid
- 2026-04-10 Price Changed $103,000 MIBOR as Distributed by MLS Grid
- 2026-03-26 Price Changed $108,000 MIBOR as Distributed by MLS Grid
- 2026-02-28 Listed $115,000 MIBOR as Distributed by MLS Grid
- 2024-09-06 Sold (MLS) $105,000 MIBOR as Distributed by MLS Grid
- 2024-07-20 Pending — MIBOR as Distributed by MLS Grid
- 2024-07-12 Listed $105,000 MIBOR as Distributed by MLS Grid
Property tax history
-3.7%/yrLatest (2025): $382 · +10.2% YoY. Source: county tax records.
Cash-flow waterfall
monthlySold comps — $/sqft
last 12 mo · ≤1 miLoading sold comps…