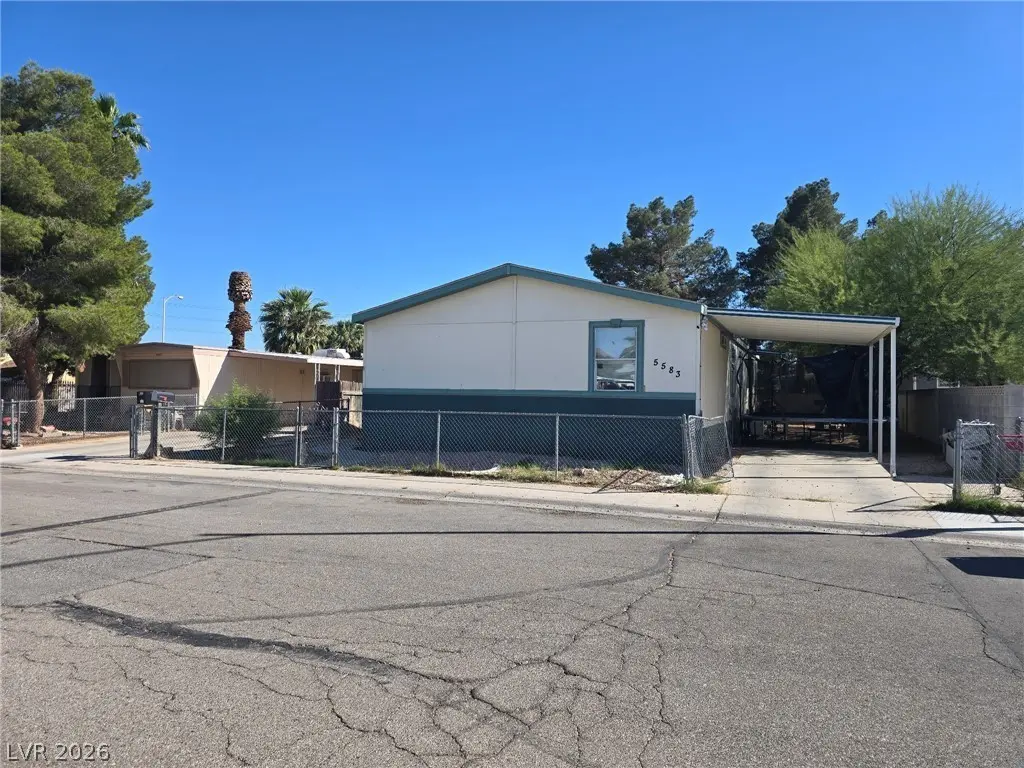
5583 Tahoe Dr · Sunrise Manor, NV
Flood risk 1/10 · Minimal
- FEMA flood zone
- X (unshaded)
- Chance of flooding over 30 yrs
- 0.0%
- Est. flood insurance / yr
- $507 – $1,088
Fire risk 2/10 · Minimal
- Est. fire insurance / yr
- $490 – $910
Heat risk 8/10 · Major
- Hot days now (above 108°F)
- 7 days/yr
- Hot days in 30 yrs
- 16 days/yr
Wind risk 1/10 · Minimal
- Chance of severe wind over 30 yrs
- —
Air-quality risk 3/10 · Minor
- Unhealthy air days now
- 3 days/yr
- Unhealthy air days in 30 yrs
- 4 days/yr
Risk factors via First Street. Map © Google.
Why this score? — see what drove the D+ grade
The composite is a weighted blend of 9 inputs, each scored 0–100. Each bar is that input's sub-score; the figure is the points it added to the 100-point composite (weight × sub-score).
- Cash flow +19.0/30.0
- ARV discount +7.5/15.0
- DSCR +6.0/10.0
- 1% rule +4.3/10.0
- Rent growth +3.4/5.0
- Livability +2.9/5.0
- Schools +2.6/10.0
- Condition / age +2.5/5.0
- Appreciation +0.0/10.0
$220,000
🖨 Deal sheet 📄 Offer letter ✓ Due diligence
Listing remarks MLS
Aggressively priced mobile home in Las Vegas, NV. 2-bedroom, 1.75-bath, 1620 square foot property built in 2003. Near schools, parks and shopping. Priced around $35/ft. Hurry, this will not last! Property has been repaired.
Key facts
- 4,792 sq ft lot
- Built 2003
- Listed 12 days
Property features AI
Finance
- Other: Lot is less than quarter acre
- Financial info: Lease amount listed at $1,600
- HOA & community: Homeowners association: Winterwood; HOA fee of $75 per month (includes association management)
Exterior
- Parking: Open parking
- Utilities: Public water; Public sewer; Above-ground utilities; No photovoltaics
- Home design: Single-family property; One story; Resale
- Construction: Flat roof; Resale construction status
- Exterior features: Front yard fencing; Pasture fencing; No additional exterior features listed; Faces east
Interior
- Kitchen: Electric cooktop; Electric range; Refrigerator
- Bedrooms: Two possible bedrooms; Bedroom 3: 13 x 12; Bedroom 2: 9 x 9; Primary bedroom with walk-in closet: 16 x 14
- Flooring: Laminate flooring
- Bathrooms: Two full bathrooms; Bathroom with double sink, separate shower and separate tub: 10 x 6
- Heating & cooling: Central heating (gas); Central electric cooling (central air)
- Interior features: Bedroom on main level; Primary bedroom downstairs; Unfurnished
- Laundry & utility: Washer; Dryer; Gas dryer hookup on main level
Neighborhood map
What this means for you Summary
Snapshot
- This is a 3-bed/2.0-bath manufactured listed at $220k.
Deal economics
- At list price, monthly cash flow is $228 ($3k/yr) — positive.
- The deal already cash-flows at list — no discount required.
- To meet the 1% rule (rent ≥ 1% of price), the offer needs to be $204k (7.5% below list).
- Recommended offer: $204k (7.5% below list) — sets the bar for 1% rule.
Location & tenants
- Location reads 58/100 on livability (#83 in NV) — a working-class tenant base; expect higher turnover. Strengths: cost of living A+, housing A+; Watch: employment D, schools F, crime F.
- Clark County School District (urban): math 21% / reading 39% proficiency, ranked #11 of 17 in NV (top 65%) — families likely to look elsewhere, expect single-tenant / working-renter base with shorter leases.
- Market conditions: Rents rising (+3.7%/yr); 117 active listings in the ZIP; 40 comparable units currently listed for rent nearby; rentals at typical pace (median 15d on market — plan ~3-4 weeks tenant-placement turnaround); 14,754 units permitted in Clark County in 2024 (2,301 in 5+ unit buildings).
- This rent runs 34% of the median local income ($71k/yr) — at the standard rent-burdened threshold; future hikes will face affordability resistance.
Forward outlook
- Local home prices are declining (-3.0%/yr); year-one equity from $2k of loan paydown is wiped out by about $7k of value loss. Plan a longer hold.
- Clark County population projected at +36% by 2050 — long-run rental-demand tailwind backs the buy-and-hold thesis.
Negotiation context
- Only 12 days on market — expect competitive offers; lowballing is unlikely to land.
- 3 sale attempts since 16y ago with the ask held roughly flat each time — persistent listings suggest the price (not the market) is what's stuck; bring a comps-based counter.
- Current owner paid $46k; list at $220k implies a 373% gain — meaningful room to come down on a strong offer.
Risks & watch-outs
- Climate carrying-cost: extreme-heat days projected 7→16/yr by 2055 (HVAC capex compounding) — expect insurance premiums to compound above CPI over the hold.
Questions for the listing agent
- What does the HOA fee cover, when was the last increase, and are there any pending special assessments or reserve-fund shortfalls?
- Is there a deadline driving the sale (1031 exchange, divorce, estate, relocation)? That informs how much negotiation room exists.
- Schools are F-rated, which usually means shorter tenancies and higher turnover. Who's the typical renter profile here, and what's been the actual vacancy rate?
- Crime grade is F in this area — have there been break-ins, vandalism, or insurance claims at this property in the last 3 years? What carrier currently insures it and at what premium?
- The area grade is low — what's the realistic commute time and amenity access for the typical tenant pool here? Any planned neighborhood developments (good or bad) we should know about?
- What's the average days-on-market for RENTAL listings here right now (not sales)? A rising rental-DOM trend means longer vacancies and softer asking-rent achievability than the comps imply.
- What's the recent tenant-quality profile in this submarket — average credit score on applications, eviction rate, late-payment / NSF rate, and stable-employment percentage? A property-management company in the area should have these aggregated.
- How much new for-sale + rental construction is in the pipeline within 1–3 miles? Heavy new supply typically softens prices + rents 12–24 months out; constrained supply supports both.
Investment metrics
- 1% rule
- 0.93% ✗
- Cap rate
- 7.53%
- Cash-on-cash
- 4.43%
- DSCR
- 1.20
- GRM
- 9.0
CMA / ARV
No comps found within radius.
Projected returns pro-forma
-3.0% appreciation · 3.7% rent growth · sell at horizon
- IRR
- -8.7%
- Equity multiple
- 0.68×
- Total profit
- $-19,768
- Equity at exit
- $32,803
- IRR
- 1.6%
- Equity multiple
- 1.12×
- Total profit
- $7,234
- Equity at exit
- $19,022
Cash invested: $61,600 (down + closing). Projections, not guarantees.
Landlord ↔ Tenant lean methodology
- Overall (STATE)
- 71 Landlord-Friendly
- State Nevada
- 71 Landlord-Friendly · R+1
- County
- — inherits STATE
- City
- — inherits STATE
ZIP-level market 89142
- Home prices YoY
- -16.7%
- Rents YoY
- 3.7%
- Active inventory
- 117
- Price-to-rent
- 9.0×
Monthly cashflow live
- Estimated rent
- $2,036 high interval (Pro) →
- Mortgage (P&I)
- −$1,154
- Tax from tax record
- −$60 /mo · $723/yr
- Insurance
- −$92
- HOA
- −$75
- Vacancy / Maint / Mgmt
- −$427
- Net cashflow
- $228
Break-even live
UW: 25.0% down · 7.5% · 30yr · 1.5% tax · 5.0% vac · 8.0% maint · 8.0% mgmt
Financing live
Cash to close
- Down payment
- $55,000
- Closing costs
- $6,600
- Reserves months
- —
- Total cash needed
- —
Loan-product check · same deal, 3 products live
Conventional
25% down · 7.5% · 30yr
- Down + closing
- —
- Monthly P&I
- —
- Monthly cashflow
- —
- DSCR
- —
- Eligible?
- —
Personal DTI + credit; lowest rate.
DSCR
20% down · 8.5% · 30yr
- Down + closing
- —
- Monthly P&I
- —
- Monthly cashflow
- —
- DSCR
- —
- Eligible?
- —
No personal income docs; deal must DSCR.
Hard money
10% down · 12.0% · 12mo
- Down + closing
- —
- Monthly P&I
- —
- Monthly cashflow
- —
- DSCR
- —
- Eligible?
- —
Short-term bridge; refi at stabilization.
Rent comps 40 comps
| Address | Beds | Baths | Sqft | Rent | $/sqft | DOM | Units | Dist |
|---|---|---|---|---|---|---|---|---|
| 2789 Canonero St Las Vegas, NV | 2.0 | 2.5 | 1395 | $3,000 | $2.15 | 44d | 1 | 0.19mi |
| 2847 Mammoth Ct Las Vegas, NV | 3.0 | 2.0 | 1440 | $1,700 | $1.18 | 8d | 1 | 0.23mi |
| 5650 Ruby Creek Dr Las Vegas, NV | 3.0 | 2.5 | 1422 | $2,300 | $1.62 | 3d | 1 | 0.24mi |
| 5703 Roundrock Dr Las Vegas, NV | 3.0 | 2.0 | 1231 | $1,699 | $1.38 | 15d | 1 | 0.25mi |
| 2972 Juniper Hills Blvd #202 Las Vegas, NV | 3.0 | 2.0 | 1074 | $1,445 | $1.35 | 15d | 1 | 0.40mi |
| 2982 Juniper Hills Blvd #202 Las Vegas, NV | 3.0 | 2.0 | 1074 | $1,700 | $1.58 | 44d | 1 | 0.42mi |
| 2962 Juniper Hills Blvd #104 Las Vegas, NV | 3.0 | 2.0 | 1074 | $1,550 | $1.44 | 44d | 1 | 0.47mi |
| 2689 Rungsted St Las Vegas, NV | 3.0 | 2.0 | 1315 | $1,775 | $1.35 | 44d | 1 | 0.48mi |
| 5218 Coral Vine Way Las Vegas, NV | 3.0 | 2.0 | 1315 | $1,840 | $1.40 | 12d | 1 | 0.49mi |
| 5980 Mahogany Mountain Dr Las Vegas, NV | 4.0 | 2.5 | 1886 | $2,195 | $1.16 | 15d | 1 | 0.52mi |
| 5571 Slice Dr Las Vegas, NV | 3.0 | 2.5 | 1636 | $2,115 | $1.29 | 44d | 1 | 0.53mi |
| 2824 Poppyseed Way Las Vegas, NV | 4.0 | 2.0 | 1332 | $1,790 | $1.34 | 15d | 1 | 0.55mi |
| 5150 E Sahara Ave Las Vegas, NV | 1.0–3.0 | 1.0–2.0 | 980 | $1,450 | $1.48 | 22d | 23 | 0.68mi |
| 3400 Cabana Dr #2019 Las Vegas, NV | 2.0 | 2.0 | 1053 | $1,350 | $1.28 | 15d | 1 | 0.71mi |
| 3400 Cabana Dr Las Vegas, NV | 2.0–3.0 | 2.0 | 1124 | $1,350 | $1.20 | 22d | 2 | 0.71mi |
| 6062 Saint Petersburg Dr Las Vegas, NV | 3.0 | 2.0 | 1309 | $1,750 | $1.34 | 44d | 1 | 0.78mi |
| 6080 Saint Petersburg Dr Las Vegas, NV | 2.0 | 2.0 | 1144 | $2,350 | $2.05 | 44d | 1 | 0.80mi |
| 1823 Niblick Cir Las Vegas, NV | 3.0 | 2.0 | 1714 | $2,575 | $1.50 | 44d | 1 | 0.85mi |
| 1812 Niblick Cir Las Vegas, NV | 4.0 | 2.0 | 1904 | $5,000 | $2.63 | 11d | 1 | 0.86mi |
| 2119 Raspberry Hill Rd Las Vegas, NV | 3.0 | 2.0 | 1216 | $1,750 | $1.44 | 44d | 1 | 0.87mi |
| 5519 Myron Cir Las Vegas, NV | 4.0 | 3.0 | 1612 | $2,150 | $1.33 | 4d | 1 | 0.93mi |
| 5519 Myron Cir Las Vegas, NV | 4.0 | 3.0 | 1612 | $2,150 | $1.33 | 24d | 1 | 0.93mi |
| 6041 Spring Harvest Dr Las Vegas, NV | 3.0 | 2.0 | 1310 | $1,999 | $1.53 | 44d | 1 | 0.98mi |
| 3055 S Nellis Blvd Las Vegas, NV | 1.0–2.0 | 1.0–2.0 | 983 | $1,432 | $1.46 | 2d | 41 | 0.98mi |
| 4855 E Vegas Valley Dr Las Vegas, NV | 1.0–3.0 | 1.0–2.0 | 949 | $1,579 | $1.66 | 2d | 15 | 0.98mi |
| 6360 E Sahara Ave Las Vegas, NV | 1.0–3.0 | 1.0–2.0 | 1017 | $1,914 | $1.88 | 2d | 18 | 1.00mi |
| 4801 E Sahara Ave Las Vegas, NV | 1.0–3.0 | 1.0–2.0 | 870 | $1,659 | $1.91 | 4d | 25 | 1.01mi |
| 6328 Angelita View Ave Las Vegas, NV | 3.0 | 2.0 | 1173 | $2,000 | $1.71 | 24d | 1 | 1.01mi |
| 5426 Eastwick Cir Las Vegas, NV | 3.0 | 2.0 | 1184 | $1,729 | $1.46 | 44d | 1 | 1.05mi |
| 6120 Majestic Wind Ave Las Vegas, NV | 3.0 | 2.0 | 1234 | $1,750 | $1.42 | 4d | 1 | 1.05mi |
| 3021 Aloha Ave Las Vegas, NV | 3.0 | 2.0 | 1270 | $1,800 | $1.42 | 3d | 1 | 1.06mi |
| 3037 Aloha Ave Las Vegas, NV | 3.0 | 2.0 | 1270 | $1,800 | $1.42 | 4d | 1 | 1.06mi |
| 6055 Autumn Rose Way Las Vegas, NV | 3.0 | 2.5 | 1734 | $2,220 | $1.28 | 44d | 1 | 1.07mi |
| 1929 Blue Ribbon Dr Las Vegas, NV | 3.0 | 2.0 | 1632 | $2,000 | $1.23 | 16d | 1 | 1.08mi |
| 1593 Teardrop St Las Vegas, NV | 3.0 | 2.0 | 1152 | $1,725 | $1.50 | 24d | 1 | 1.10mi |
| 1593 Teardrop St Las Vegas, NV | 3.0 | 2.0 | 1164 | $1,725 | $1.48 | 22d | 1 | 1.10mi |
| 4717 Woodland Ave Las Vegas, NV | 3.0 | 2.5 | 1742 | $2,250 | $1.29 | 12d | 1 | 1.12mi |
| 3586 Driving Range St Las Vegas, NV | 4.0 | 2.0 | 1923 | $2,000 | $1.04 | 3d | 1 | 1.13mi |
| 5775 Canyon Oak Cir Las Vegas, NV | 3.0 | 2.0 | 1419 | $2,180 | $1.54 | 3d | 1 | 1.19mi |
| 6526 Blooming Sun Ct Las Vegas, NV | 3.0 | 2.0 | 1405 | $1,850 | $1.32 | 8d | 1 | 1.20mi |
HOA detail
- Monthly dues
- $75 · $900/yr
- Likely covers
- gas
Listing history 9 events
-
2026-05-10$220,000 Active 258-char remark
-
2010-07-29soldstatus $46,500 223-char remark
Show marketing remark (195 chars)
Aggressively priced mobile home in Las Vegas, NV. 2-bedroom, 1.75-bath, 1620 square foot property built in 2003. Near schools, parks and shopping. Priced around $35/ft. Hurry, this will not last!
-
2010-07-29historical 223-char remark
Show marketing remark (195 chars)
Aggressively priced mobile home in Las Vegas, NV. 2-bedroom, 1.75-bath, 1620 square foot property built in 2003. Near schools, parks and shopping. Priced around $35/ft. Hurry, this will not last!
-
2010-07-29soldstatus $46,500
Show marketing remark (195 chars)
Aggressively priced mobile home in Las Vegas, NV. 2-bedroom, 1.75-bath, 1620 square foot property built in 2003. Near schools, parks and shopping. Priced around $35/ft. Hurry, this will not last!
-
2010-07-12historical
Show marketing remark (195 chars)
Aggressively priced mobile home in Las Vegas, NV. 2-bedroom, 1.75-bath, 1620 square foot property built in 2003. Near schools, parks and shopping. Priced around $35/ft. Hurry, this will not last!
-
2010-07-12price $48,500
Show marketing remark (195 chars)
Aggressively priced mobile home in Las Vegas, NV. 2-bedroom, 1.75-bath, 1620 square foot property built in 2003. Near schools, parks and shopping. Priced around $35/ft. Hurry, this will not last!
-
2010-05-12$46,500
Show marketing remark (195 chars)
Aggressively priced mobile home in Las Vegas, NV. 2-bedroom, 1.75-bath, 1620 square foot property built in 2003. Near schools, parks and shopping. Priced around $35/ft. Hurry, this will not last!
-
2010-05-11$48,500 223-char remark
Show marketing remark (223 chars)
Aggressively priced mobile home in Las Vegas, NV. 2-bedroom, 1.75-bath, 1620 square foot property built in 2003. Near schools, parks and shopping. Priced around $35/ft. Hurry, this will not last! Property has been repaired.
-
2002-05-16soldstatus $40,000
ⓘ Source: listings_history table (triggers on properties + properties_extension) + one-shot
backfill from property_details.listing_events for pre-trigger history.
Tax reassessment forecast NV · Resets to sale price
- Current annual tax
- $723 · $60/mo
- Projected year-2 tax
- $1,298 · $108/mo
- Expected delta
- +$575/yr (+$48/mo · 79.5%)
ⓘ Screening estimate from a state-policy table — verify with the county assessor before closing.
Climate risk First Street
- Flood 1/10 Low FEMA zone X (unshaded) · 0% chance over 30 yrs
- Wildfire 2/10 Low
- Heat 8/10 Severe 7 d/yr ≥108°F today · 16 d/yr by 30 yrs out
- Wind 1/10 Low
- Air quality 3/10 Moderate 3 unhealthy d/yr today · 4 by 30 yrs out
Nearby sold comps map
Loading sold comps map…
Walkable amenities ~0.75 mi
Loading nearby amenities…
Taxation est. · year 1
- Rental income
- $24,428
- − Mortgage interest
- −$12,323
- − Property taxes
- −$723
- − Insurance
- −$1,100
- − Repairs & maintenance
- −$1,954
- − Management
- −$1,954
- − HOA
- −$900
- − Depreciation
- −$6,400
- Taxable loss
- −$927
- Est. tax savings @ 24.0%
- +$222
- After-tax cash flow
- $2,953/yr
For passive investors: Depreciation is non-cash, so a rental often shows a tax loss while cash-flowing — sheltering income. Rental losses are passive: they offset passive income freely, and up to $25,000/yr can offset ordinary (W-2) income if you actively participate and your MAGI is under $100k (phasing out to $0 by $150k); unused losses carry forward. On sale, claimed depreciation is recaptured at up to 25%, and gains may owe capital-gains tax (a 1031 exchange can defer both). Figures are a year-1 estimate at your 24.0% rate — not tax advice; consult a CPA.
Schools (NCES district)
- District
- Clark County School District
- NCES district ID
- 3200060
- Math proficiency
- 21% ▼ -13.00%
- Reading proficiency
- 39% ▼ -8.00%
- Median HH income
- $53,611
- Composite
- 26.48/100
- National rank
- #7211
- State rank
- #11 of 17 in NV
Livability — Sunrise Manor
- Score
- 58/100
- State rank
- #83
- US rank
- #20692
Category grades
Schools grade is shown separately in the Schools card above.
Census & demographics
- Census place
- Sunrise Manor, NV
- County
- Clark County · 2,306,105 people
- City population
- 102,557
- Metro
- Las Vegas-Henderson-Paradise, NV
- Population (ZIP)
- 35,179
- Household income
- $71,233
- Rent vs Own
- Severe rent burden
- 1175.0
Population outlook (Clark County) Hauer SSP2
- Today (2025)
- 2,504,101 people
- By 2030
- 2,693,770 · +7.6%
- By 2040
- 3,061,208 · +22.2%
- By 2050
- 3,400,072 · +35.8%
- By 2075
- 4,139,522 · +65.3%
- By 2100
- 4,596,916 · +83.6%
Race, ethnicity, and origin ACS 2023
- Neighborhood character
- Diverse neighborhood (Simpson 0.60)
- Race & ethnicity
- Hispanic / Latino 59% Two or more races 20% White 19% Asian 11% Black 7% Native American 1%
- Hispanic origin (detail)
- Mexican 44% Cuban 5%
- Common ancestry
- Italian 1% Slovak 1% Portuguese 1%
- Foreign-born
- 32% · Canada
- Languages at home
- 43% English-only · Spanish 49% Tagalog/Filipino 6% Other Asian/Pacific 1%
Political lean MEDSL · Clark
- 2024 margin
- Toss-up / Even · D 50.4% · R 47.8% · Other 1.7%
- 2008→2024 swing
- -16.5pp toward R · 2008: 19.1pp · 2024: 2.6pp
- All cycles
- 2024: D+2.6 2020: D+9.3 2016: D+10.7 2012: D+14.5 2008: D+19.1
Not yet ingested
- Civics
- —
Market trends
- HPI YoY
- ▼ -57.51%
- Current HPI
- 287.6914
- Rent YoY
- ▲ 3.70%
- Metro
- Las Vegas-Henderson-Paradise, NV
- State GDP YoY
- ▲ 3.08%
- F500 in state
- 6
Industry mix (Fortune 500 HQ in NV)
| Industry | F500 HQs | Revenue |
|---|---|---|
| Hotels / Casinos | 3 | $36B |
|
||
Price history
+450.0% since first listed10 events — show timeline
- 2026-05-22 Pending — GLVAR
- 2026-05-10 Listed $220,000 GLVAR
- 2010-07-29 Sold (MLS) $46,500 GEMLS
- 2010-07-29 Sold (MLS) $46,500 GLVAR
- 2010-07-29 Listing Removed — GLVAR
- 2010-07-12 Delisted — GEMLS
- 2010-07-12 Price Changed $48,500 GEMLS
- 2010-05-12 Listed $46,500 GEMLS
- 2010-05-11 Listed $48,500 GLVAR
- 2002-05-16 Sold (Public Records) $40,000 Public Records
Property tax history
-3.9%/yrLatest (2025): $723 · +7.6% YoY. Source: county tax records.
Cash-flow waterfall
monthlySold comps — $/sqft
last 12 mo · ≤1 miLoading sold comps…