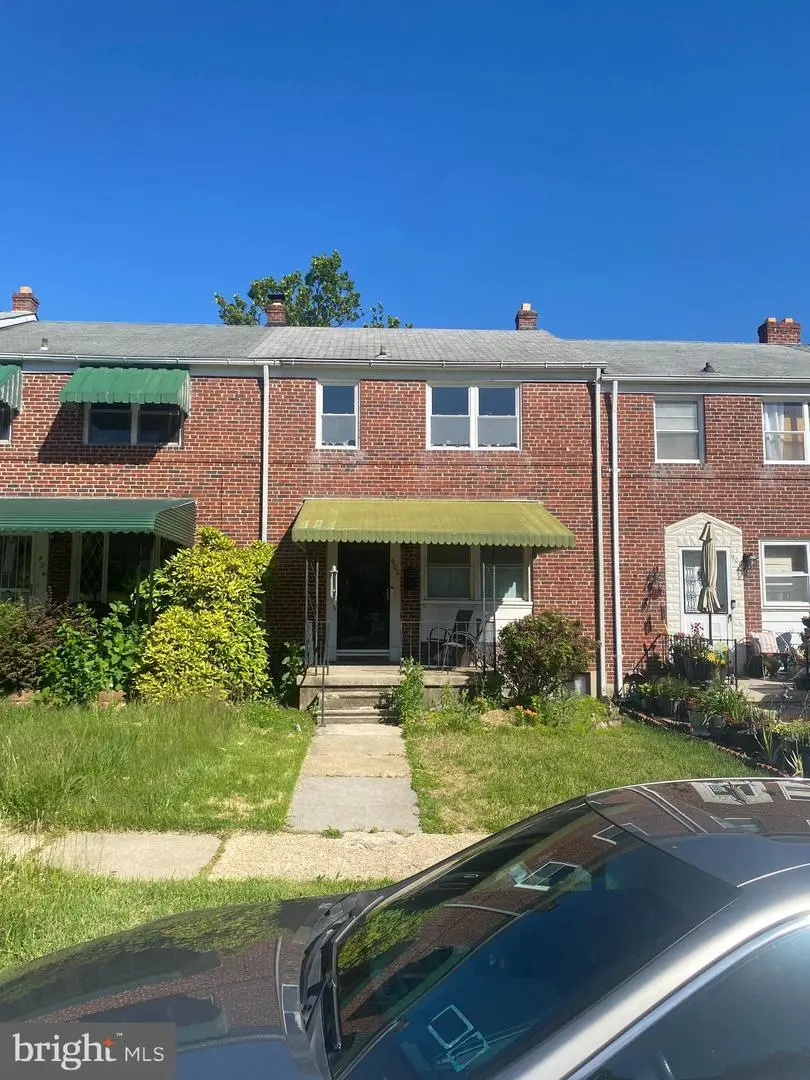
906 Masefield Rd · Woodlawn, MD
Flood risk 1/10 · Minimal
- FEMA flood zone
- X (unshaded)
- Chance of flooding over 30 yrs
- 0.0%
- Est. flood insurance / yr
- $473 – $860
Fire risk 1/10 · Minimal
- Est. fire insurance / yr
- $755 – $1,403
Heat risk 6/10 · Moderate
- Hot days now (above 103°F)
- 7 days/yr
- Hot days in 30 yrs
- 15 days/yr
Wind risk 5/10 · Moderate
- Chance of severe wind over 30 yrs
- 24.0%
Air-quality risk 3/10 · Minor
- Unhealthy air days now
- 3 days/yr
- Unhealthy air days in 30 yrs
- 4 days/yr
Risk factors via First Street. Map © Google.
Why this score? — see what drove the C+ grade
The composite is a weighted blend of 9 inputs, each scored 0–100. Each bar is that input's sub-score; the figure is the points it added to the 100-point composite (weight × sub-score).
- ARV discount +15.0/15.0
- Cash flow +14.9/30.0
- Appreciation +9.8/10.0
- DSCR +4.6/10.0
- 1% rule +4.0/10.0
- Livability +3.9/5.0
- Rent growth +3.8/5.0
- Condition / age +2.5/5.0
- Schools +2.3/10.0
$249,900
🖨 Deal sheet 📄 Offer letter ✓ Due diligence
Listing remarks
Estate sale property with great potential. With a little sweat equity this home's potential is limitless. The home features 4 generous sized bedrooms, 1 full and 1 half bath, large living and dining area, central air, and a partially finished basement. Located in a well established neighborhood, close to major commuter routes and short drive to downtown. The property is being sold as is. Easy to show. Call agent for appointment confirmation
Key facts
- Built 1954
- Listed 19 days
Property features AI
Exterior
- Parking: On-street parking
- Utilities: Public water; Public sewer; Natural gas service
- Home design: Interior townhouse/rowhouse; Fee simple ownership
- Construction: Brick construction; Block foundation; Above-grade and below-grade structures
- Exterior features: Tidal water not present
Interior
- Bedrooms: Three bedrooms on the upper level; One bedroom on the lower level
- Bathrooms: One full bathroom; One half bathroom
- Heating & cooling: Central heating; Cooling system (other) with natural gas fuel; Hot water heated by natural gas
- Interior features: Daylight, full basement
Neighborhood map
What this means for you Summary
Snapshot
- This is a 4-bed/1.5-bath townhouse listed at $250k.
Deal economics
- At list price, monthly cash flow is $74 ($884/yr) — positive.
- The deal already cash-flows at list — no discount required.
- To meet the 1% rule (rent ≥ 1% of price), the offer needs to be $225k (9.8% below list).
- Recommended offer: $225k (9.8% below list) — sets the bar for 1% rule.
- Cap rate 6.6% vs local median 4.3% in Woodlawn — top-decile yield for the area; either an underpriced asset or a hidden risk that comps aren't pricing in. Stress-test before assuming the spread holds.
Location & tenants
- Location reads 77/100 on livability (#78 in MD, #2,926 nationally) — a middle-class / working-renter tenant base. Strengths: commute A+, housing A+, employment A-; Watch: amenities D+, crime F.
- Baltimore County Public Schools (suburban): math 15% / reading 34% proficiency, ranked #11 of 24 in MD (top 46%) — low school quality limits family demand, transient renter base, plan for 1-2y turnover.
- Market conditions: Rents rising fast (+5.2%/yr); 126 active listings in the ZIP; 18 comparable units currently listed for rent nearby; rentals at typical pace (median 18d on market — plan ~3-4 weeks tenant-placement turnaround); 1,511 units permitted in Baltimore County in 2024 (643 in 5+ unit buildings).
- This rent runs 40% of the median local income ($67k/yr) — at the standard rent-burdened threshold; future hikes will face affordability resistance.
Forward outlook
- In year one you build about $25k of equity ($2k loan paydown + $24k appreciation (9.5% local appreciation)).
- Baltimore County population projected at +12% by 2050 — modest demand growth; plan on rents tracking national, not racing it.
- At projected returns (9.5% appreciation + 5.2% rent growth), your $70k cash investment doubles in ~3 years — after that, you're playing with house money.
- By year 2, paydown + projected appreciation supports a ~$41k cash-out refi (75% LTV) — recoverable capital for the next deal without selling this one.
Negotiation context
- It's been on market 19 days — a 2% lower offer ($246k) is reasonable based on typical stale-listing flexibility.
- Current owner paid $88k; list at $250k implies a 184% gain — meaningful room to come down on a strong offer.
Risks & watch-outs
- Watch-outs: built in 1954 — expect roof / HVAC / electrical / plumbing capex.
- Climate carrying-cost: moderate wind risk, 24% chance of damaging wind over 30y; extreme-heat days projected 7→15/yr by 2055 (HVAC capex compounding) — expect insurance premiums to compound above CPI over the hold.
Questions for the listing agent
- Built in 1954 — when were the roof, HVAC, electrical panel, plumbing, and water heater last replaced?
- Is there a deadline driving the sale (1031 exchange, divorce, estate, relocation)? That informs how much negotiation room exists.
- Schools are B-rated — typically a magnet for longer-tenancy family renters. What's the average tenant stay here, and is there a school-zone premium baked into asking?
- Crime grade is F in this area — have there been break-ins, vandalism, or insurance claims at this property in the last 3 years? What carrier currently insures it and at what premium?
- What's the average days-on-market for RENTAL listings here right now (not sales)? A rising rental-DOM trend means longer vacancies and softer asking-rent achievability than the comps imply.
- What's the recent tenant-quality profile in this submarket — average credit score on applications, eviction rate, late-payment / NSF rate, and stable-employment percentage? A property-management company in the area should have these aggregated.
- How much new for-sale + rental construction is in the pipeline within 1–3 miles? Heavy new supply typically softens prices + rents 12–24 months out; constrained supply supports both.
Investment metrics
- 1% rule
- 0.90% ✗
- Cap rate
- 6.65%
- Cash-on-cash
- 1.26%
- DSCR
- 1.06
- GRM
- 9.2
CMA / ARV
- ARV (on-the-fly)
- $325,920
- Comps found
- 12
Show comp detail 12 sales within ~0.75 mi
| Address | Dist | Beds/Ba | Sqft | Sold | Price | $/sf | Match |
|---|---|---|---|---|---|---|---|
| 1102 Harwall | 0.17mi | 3/2.0 (-1) | 1,785 (+6%) | 3mo | $265,000 | $148 | 72 |
| 1529 Clairidge Rd | 0.34mi | 3/2.0 (-1) | 1,692 (+1%) | 5mo | $298,000 | $176 | 72 |
| 970 St Agnes Ln | 0.13mi | 3/2.0 (-1) | 1,530 (-9%) | 5mo | $275,000 | $180 | 68 |
| 1664 Kirkwood Rd | 0.51mi | 3/2.0 (-1) | 1,672 (-0%) | 2mo | $325,000 | $194 | 67 |
| 1420 Clairidge Rd | 0.26mi | 3/1.5 (-1) | 1,440 (-14%) | 2mo | $314,000 | $218 | 58 |
| 6123 Northdale Rd | 0.66mi | 3/2.0 (-1) | 1,730 (+3%) | 1mo | $385,000 | $223 | 57 |
| 5413 Channing Rd | 0.26mi | 3/1.0 (-1) | 1,459 (-13%) | 3mo | $239,000 | $164 | 56 |
| 1719 Stella Ct | 0.62mi | 3/2.0 (-1) | 1,590 (-5%) | 2mo | $300,000 | $189 | 53 |
| 1230 Stamford Rd | 0.56mi | 4/2.0 | 1,520 (-10%) | 5mo | $319,000 | $210 | 52 |
| 1531 Clairidge Rd | 0.34mi | 3/2.0 (-1) | 1,440 (-14%) | 3mo | $320,000 | $222 | 51 |
| 410 Lambeth Rd | 0.70mi | 3/2.0 (-1) | 1,862 (+11%) | 3mo | $363,500 | $195 | 40 |
| 839 N Chapel Gate Ln | 0.75mi | 3/1.5 (-1) | 1,890 (+12%) | 1mo | $140,000 | $74 | 39 |
Match score weights: distance 35% · size 25% · config 20% · recency 20%. Top-matched comps best support the ARV.
Projected returns pro-forma
9.5% appreciation · 5.23% rent growth · sell at horizon
- IRR
- 25.0%
- Equity multiple
- 2.96×
- Total profit
- $137,463
- Equity at exit
- $216,066
- IRR
- 22.8%
- Equity multiple
- 6.87×
- Total profit
- $410,603
- Equity at exit
- $456,634
Cash invested: $69,972 (down + closing). Projections, not guarantees.
Landlord ↔ Tenant lean methodology
- Overall (STATE)
- 27 Tenant-Leaning
- State Maryland
- 27 Tenant-Leaning · D+14
- County
- — inherits STATE
- City
- — inherits STATE
ZIP-level market 21207
- Home prices YoY
- 1.1%
- Rents YoY
- 5.2%
- Active inventory
- 126
- Price-to-rent
- 9.2×
Monthly cashflow live
- Estimated rent
- $2,254 high interval (Pro) →
- Mortgage (P&I)
- −$1,311
- Tax from tax record
- −$293 /mo · $3,511/yr
- Insurance
- −$104
- HOA
- −$0
- Vacancy / Maint / Mgmt
- −$473
- Net cashflow
- $74
Break-even live
UW: 25.0% down · 7.5% · 30yr · 1.5% tax · 5.0% vac · 8.0% maint · 8.0% mgmt
Financing live
Cash to close
- Down payment
- $62,475
- Closing costs
- $7,497
- Reserves months
- —
- Total cash needed
- —
Loan-product check · same deal, 3 products live
Conventional
25% down · 7.5% · 30yr
- Down + closing
- —
- Monthly P&I
- —
- Monthly cashflow
- —
- DSCR
- —
- Eligible?
- —
Personal DTI + credit; lowest rate.
DSCR
20% down · 8.5% · 30yr
- Down + closing
- —
- Monthly P&I
- —
- Monthly cashflow
- —
- DSCR
- —
- Eligible?
- —
No personal income docs; deal must DSCR.
Hard money
10% down · 12.0% · 12mo
- Down + closing
- —
- Monthly P&I
- —
- Monthly cashflow
- —
- DSCR
- —
- Eligible?
- —
Short-term bridge; refi at stabilization.
Rent comps 18 comps
| Address | Beds | Baths | Sqft | Rent | $/sqft | DOM | Units | Dist |
|---|---|---|---|---|---|---|---|---|
| 930 Masefield Rd Unit 1 Woodlawn, MD | 3.0 | 1.5 | 1080 | $2,650 | $2.45 | 2d | 1 | 0.04mi |
| 945 Saint Agnes Ln Gwynn Oak, MD | 4.0 | 2.0 | 1500 | $1,985 | $1.32 | 17d | 1 | 0.08mi |
| 963 Masefield Rd Gwynn Oak, MD | 3.0 | 2.0 | 1920 | $2,096 | $1.09 | 23d | 1 | 0.10mi |
| 1530 Kirkwood Rd Gwynn Oak, MD | 3.0 | 1.5 | 1424 | $2,100 | $1.47 | 10d | 1 | 0.29mi |
| 603 Braeside Rd Baltimore, MD | 3.0 | 2.0 | 1416 | $2,400 | $1.69 | 43d | 1 | 0.62mi |
| 311 Harlem Ln Catonsville, MD | 3.0 | 2.0 | 1152 | $2,300 | $2.00 | 4d | 1 | 0.81mi |
| 2 Walden Birch Ct Woodlawn, MD | 3.0 | 1.5 | 1022 | $1,792 | $1.75 | 4d | 1 | 1.02mi |
| 5364 Jamestowne Ct Baltimore, MD | 3.0 | 1.0–1.5 | 787 | $1,905 | $2.42 | 4d | 13 | 1.03mi |
| 51 Briarwood Rd Catonsville, MD | 3.0 | 1.0 | 1200 | $2,100 | $1.75 | 43d | 1 | 1.07mi |
| 6301 Linus Dr Gwynn Oak, MD | 4.0 | 3.0 | 1976 | $3,495 | $1.77 | 43d | 1 | 1.08mi |
| 436 Westshire Dr Catonsville, MD | 4.0 | 2.0 | 1548 | $2,800 | $1.81 | 43d | 1 | 1.24mi |
| 10 Prestwick Sq Catonsville, MD | 4.0 | 2.5 | 1710 | $2,500 | $1.46 | 17d | 1 | 1.26mi |
| 609 Wallerson Rd Catonsville, MD | 3.0 | 2.0 | 1704 | $3,395 | $1.99 | 20d | 1 | 1.27mi |
| 5215 Muth Ave Gwynn Oak, MD | 3.0 | 3.0 | 1205 | $2,700 | $2.24 | 14d | 1 | 1.36mi |
| 5147 Frederick Ave Baltimore, MD | 3.0 | 2.0 | 1216 | $1,950 | $1.60 | 3d | 1 | 1.36mi |
| 114 S Rock Glen Rd Baltimore, MD | 4.0 | 1.5 | 1160 | $2,350 | $2.03 | 12d | 1 | 1.39mi |
| 5136 Oaklawn Rd Gwynn Oak, MD | 1.0–3.0 | 1.0 | 896 | $1,710 | $1.91 | 1d | 22 | 1.40mi |
| 1200 Alexander Ave Catonsville, MD | 3.0 | 2.5 | 1215 | $2,400 | $1.98 | 43d | 1 | 1.41mi |
Listing history 14 events
-
2026-06-18days on market $249,900 Active 19 DOM
-
2026-06-17pricedays on market $249,900 Active 18 DOM
-
2026-06-16days on market $269,000 Active 17 DOM
-
2026-06-15days on market $269,000 Active 16 DOM
-
2026-06-13days on market $269,000 Active 14 DOM
-
2026-06-09days on market $269,000 Active 10 DOM
-
2026-06-08days on market $269,000 Active 9 DOM
-
2026-06-07days on market $269,000 Active 8 DOM
-
2026-06-04days on market $269,000 Active 5 DOM
-
2026-06-03days on market $269,000 Active 4 DOM
-
2026-06-02days on market $269,000 Active 3 DOM
-
2026-06-01days on market $269,000 Active 2 DOM
-
2026-05-31remarks 444-char remark
-
2026-05-31$269,000 Active 1 DOM
ⓘ Source: listings_history table (triggers on properties + properties_extension) + one-shot
backfill from property_details.listing_events for pre-trigger history.
Tax reassessment forecast MD · Partial reset (capped growth)
- Current annual tax
- $3,511 · $293/mo
- Projected year-2 tax
- $3,511 · $293/mo
- Expected delta
- $0/yr ($0/mo · 0.0%)
ⓘ Screening estimate from a state-policy table — verify with the county assessor before closing.
Climate risk First Street
- Flood 1/10 Low FEMA zone X (unshaded) · 0% chance over 30 yrs
- Wildfire 1/10 Low
- Heat 6/10 Major 7 d/yr ≥103°F today · 15 d/yr by 30 yrs out
- Wind 5/10 Major 24% chance of damaging wind over 30 yrs
- Air quality 3/10 Moderate 3 unhealthy d/yr today · 4 by 30 yrs out
Nearby sold comps map
Loading sold comps map…
Walkable amenities ~0.75 mi
Loading nearby amenities…
Taxation est. · year 1
- Rental income
- $27,050
- − Mortgage interest
- −$13,998
- − Property taxes
- −$3,511
- − Insurance
- −$1,250
- − Repairs & maintenance
- −$2,164
- − Management
- −$2,164
- − Depreciation
- −$7,270
- Taxable loss
- −$3,306
- Est. tax savings @ 24.0%
- +$793
- After-tax cash flow
- $1,677/yr
For passive investors: Depreciation is non-cash, so a rental often shows a tax loss while cash-flowing — sheltering income. Rental losses are passive: they offset passive income freely, and up to $25,000/yr can offset ordinary (W-2) income if you actively participate and your MAGI is under $100k (phasing out to $0 by $150k); unused losses carry forward. On sale, claimed depreciation is recaptured at up to 25%, and gains may owe capital-gains tax (a 1031 exchange can defer both). Figures are a year-1 estimate at your 24.0% rate — not tax advice; consult a CPA.
Schools (NCES district)
- District
- Baltimore County Public Schools
- NCES district ID
- 2400120
- Math proficiency
- 15% ▼ -16.00%
- Reading proficiency
- 34% ▼ -5.00%
- Median HH income
- $66,746
- Composite
- 23.17/100
- National rank
- #7948
- State rank
- #11 of 24 in MD
Livability — Woodlawn
- Score
- 77/100
- State rank
- #78
- US rank
- #2926
Category grades
Schools grade is shown separately in the Schools card above.
Census & demographics
- Census place
- Woodlawn, MD
- County
- Baltimore County · 769,527 people
- City population
- 49,599
- Metro
- Baltimore-Columbia-Towson, MD
- Population (ZIP)
- 47,099
- Household income
- $67,060
- Rent vs Own
- Severe rent burden
- 2139.0
Population outlook (Baltimore County) Hauer SSP2
- Today (2025)
- 885,518 people
- By 2030
- 909,272 · +2.7%
- By 2040
- 951,547 · +7.5%
- By 2050
- 990,955 · +11.9%
- By 2075
- 1,086,411 · +22.7%
- By 2100
- 1,135,078 · +28.2%
Race, ethnicity, and origin ACS 2023
- Neighborhood character
- Predominantly Black (78%)
- Race & ethnicity
- Black 78% White 8% Hispanic / Latino 7% Two or more races 5% Asian 3%
- Hispanic origin (detail)
- Puerto Rican 1%
- Common ancestry
- Swedish 1%
- Foreign-born
- 13% · Canada, Philippines, South Korea
- Languages at home
- 86% English-only · Spanish 4% French/Haitian/Cajun 1% Other Asian/Pacific 1%
Political lean MEDSL · Baltimore
- 2024 margin
- Strong D (+24.5) · D 61.0% · R 36.5% · Other 2.5%
- 2008→2024 swing
- +9.9pp toward D · 2008: 14.6pp · 2024: 24.5pp
- All cycles
- 2024: D+24.5 2020: D+27.0 2016: D+17.4 2012: D+16.4 2008: D+14.6
Not yet ingested
- Civics
- —
Market trends
- HPI YoY
- ▲ 9.50%
- Current HPI
- 843.63
- Rent YoY
- ▲ 5.23%
- Metro
- Baltimore-Columbia-Towson, MD
- State GDP YoY
- ▲ 2.97%
- F500 in state
- 12
Industry mix (Fortune 500 HQ in MD)
| Industry | F500 HQs | Revenue |
|---|---|---|
| Aerospace / Defense | 1 | $71B |
|
||
| Utilities | 1 | $25B |
|
||
| Hotels | 1 | $24B |
|
||
| Consumer Goods | 1 | $7B |
|
||
| Real Estate | 1 | $6B |
|
||
| Chemicals | 1 | $2B |
|
||
Price history
+273.6% since first listed3 events — show timeline
- 2026-05-30 Listed $269,000 BRIGHT MLS
- 1998-10-13 Sold (Public Records) $88,000 Public Records
- 1990-09-06 Sold (Public Records) $72,000 Public Records
Property tax history
+4.3%/yrLatest (2025): $3,511 · +33.9% YoY. Source: county tax records.
Cash-flow waterfall
monthlySold comps — $/sqft
last 12 mo · ≤1 miLoading sold comps…