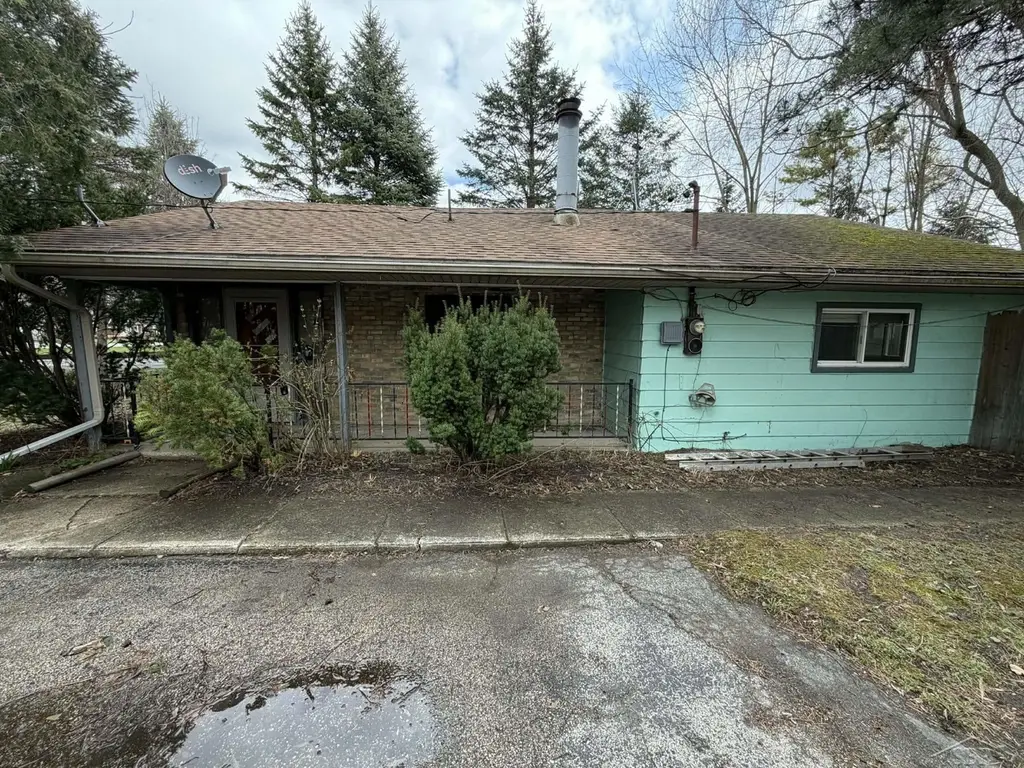
2060 Cass Ave · Bay City, MI
Flood risk 1/10 · Minimal
- FEMA flood zone
- X (unshaded)
- Chance of flooding over 30 yrs
- 0.0%
- Est. flood insurance / yr
- $507 – $1,088
Fire risk 1/10 · Minimal
- Est. fire insurance / yr
- $784 – $1,456
Heat risk 3/10 · Minor
- Hot days now (above 97°F)
- 7 days/yr
- Hot days in 30 yrs
- 14 days/yr
Wind risk 1/10 · Minimal
- Chance of severe wind over 30 yrs
- —
Air-quality risk 2/10 · Minimal
- Unhealthy air days now
- 1 days/yr
- Unhealthy air days in 30 yrs
- 2 days/yr
Risk factors via First Street. Map © Google.
Why this score? — see what drove the C- grade
The composite is a weighted blend of 9 inputs, each scored 0–100. Each bar is that input's sub-score; the figure is the points it added to the 100-point composite (weight × sub-score).
- Cash flow +16.2/30.0
- ARV discount +15.0/15.0
- DSCR +5.0/10.0
- 1% rule +3.6/10.0
- Livability +3.4/5.0
- Schools +2.8/10.0
- Rent growth +2.5/5.0
- Condition / age +2.5/5.0
- Appreciation +0.0/10.0
$124,900
🖨 Deal sheet 📄 Offer letter ✓ Due diligence
Listing remarks MLS
Move in ready and affordable! This two bed ranch is ready for it's new owners. Sitting far away from the road this home has much to offer. Updated vinyl windows throughout. New flooring/carpet. First floor laundry. Large bedrooms with spacious closets. Fenced in back yard with lots of trees for privacy. Call today for your private showing!
Key facts
- Large bedrooms
- Spacious closets
- First floor laundry
Tags
Neighborhood map
What this means for you Summary
Snapshot
- This is a 2-bed/1.0-bath single-family listed at $125k.
Deal economics
- At list price, monthly cash flow is $66 ($787/yr) — positive.
- The deal already cash-flows at list — no discount required.
- To meet the 1% rule (rent ≥ 1% of price), the offer needs to be $108k (13.9% below list).
- Recommended offer: $108k (13.9% below list) — sets the bar for 1% rule.
- Cap rate 6.9% vs local median 5.5% in Bay City — meaningfully above typical; check what's discounted (condition, days-on-market, listing class) to confirm the premium yield is real.
Location & tenants
- Location reads 68/100 on livability (#360 in MI) — a middle-class / working-renter tenant base. Strengths: cost of living A+, housing A+, health & safety A+; Watch: schools D+, amenities D, crime F.
- Bay City School District (urban): math 27% / reading 40% proficiency, ranked #317 of 540 in MI (top 59%) — families likely to look elsewhere, expect single-tenant / working-renter base with shorter leases.
- Market conditions: 148 active listings in the ZIP; 39 units permitted in Bay County in 2024 (0 in 5+ unit buildings).
Forward outlook
- Local home prices are declining (-3.0%/yr); year-one equity from $864 of loan paydown is wiped out by about $4k of value loss. Plan a longer hold.
- Bay County population projected at -21% by 2050 — secular population decline; favor cash flow + early exit over multi-decade hold.
Negotiation context
- It's been on market 67 days — a 6% lower offer ($117k) is reasonable based on typical stale-listing flexibility.
- 2 sale attempts with the ask held roughly flat each time — persistent listings suggest the price (not the market) is what's stuck; bring a comps-based counter.
Risks & watch-outs
- Watch-outs: built in 1950 — expect roof / HVAC / electrical / plumbing capex.
Questions for the listing agent
- It's been on market 67 days. Have you received any prior offers? Is the seller open to a 14% concession, seller financing, or rate buy-down credit?
- Built in 1950 — when were the roof, HVAC, electrical panel, plumbing, and water heater last replaced?
- Why hasn't it sold? Are there any deal-killer items the seller is aware of (foundation, flood, title, zoning, code violations)?
- Is there a deadline driving the sale (1031 exchange, divorce, estate, relocation)? That informs how much negotiation room exists.
- Schools are D-rated, which usually means shorter tenancies and higher turnover. Who's the typical renter profile here, and what's been the actual vacancy rate?
- Crime grade is F in this area — have there been break-ins, vandalism, or insurance claims at this property in the last 3 years? What carrier currently insures it and at what premium?
- What's the average days-on-market for RENTAL listings here right now (not sales)? A rising rental-DOM trend means longer vacancies and softer asking-rent achievability than the comps imply.
- What's the recent tenant-quality profile in this submarket — average credit score on applications, eviction rate, late-payment / NSF rate, and stable-employment percentage? A property-management company in the area should have these aggregated.
- How much new for-sale + rental construction is in the pipeline within 1–3 miles? Heavy new supply typically softens prices + rents 12–24 months out; constrained supply supports both.
Investment metrics
- 1% rule
- 0.86% ✗
- Cap rate
- 6.92%
- Cash-on-cash
- 2.25%
- DSCR
- 1.10
- GRM
- 9.7
CMA / ARV
- ARV (median comp)
- $170,411
- List price
- $124,900
- Delta
- -26.71%
- Verdict
- UNDERPRICED
- Comps
- 20 within 1.0 mi
Show comp detail 12 sales within ~0.75 mi
| Address | Dist | Beds/Ba | Sqft | Sold | Price | $/sf | Match |
|---|---|---|---|---|---|---|---|
| 48 York St | 0.10mi | 3/1.0 (+1) | 1,118 (+5%) | 15mo | $140,000 | $125 | 70 |
| 1683 Cass Ave | 0.54mi | 3/1.0 (+1) | 1,074 (+1%) | 20mo | $137,500 | $128 | 52 |
| 2306 S Farragut St | 0.67mi | 3/1.0 (+1) | 1,136 (+6%) | 2mo | $140,000 | $123 | 52 |
| 2004 32nd St | 0.74mi | 2/1.0 | 1,120 (+5%) | 7mo | $156,000 | $139 | 51 |
| 111 S lincoln Rd | 0.46mi | 2/1.0 | 1,200 (+12%) | 8mo | $161,500 | $135 | 51 |
| 1657 Cass Ave | 0.66mi | 3/1.0 (+1) | 1,074 (+1%) | 15mo | $95,000 | $88 | 51 |
| 368 S Trumbull Rd | 0.66mi | 2/1.0 | 1,139 (+7%) | 15mo | $205,500 | $180 | 46 |
| 1910 34th St | 0.58mi | 3/1.0 (+1) | 936 (-12%) | 3mo | $125,000 | $134 | 45 |
| 1908 S Sherman St | 0.75mi | 3/2.0 (+1) | 1,063 (-0%) | 17mo | $160,000 | $151 | 41 |
| 2309 30th St | 0.69mi | 3/1.5 (+1) | 1,044 (-2%) | 21mo | $132,500 | $127 | 40 |
| 1903 Heights Ct | 0.60mi | 3/2.5 (+1) | 1,161 (+9%) | 15mo | $154,000 | $133 | 34 |
| 1907 34th St | 0.61mi | 3/1.0 (+1) | 912 (-15%) | 16mo | $130,000 | $143 | 29 |
Match score weights: distance 35% · size 25% · config 20% · recency 20%. Top-matched comps best support the ARV.
Projected returns pro-forma
-3.0% appreciation · 3.0% rent growth · sell at horizon
- IRR
- -12.8%
- Equity multiple
- 0.54×
- Total profit
- $-16,096
- Equity at exit
- $18,623
- IRR
- -3.8%
- Equity multiple
- 0.75×
- Total profit
- $-8,772
- Equity at exit
- $10,799
Cash invested: $34,972 (down + closing). Projections, not guarantees.
Landlord ↔ Tenant lean methodology
- Overall (STATE)
- 62 Landlord-Friendly
- State Michigan
- 62 Landlord-Friendly · EVEN
- County
- — inherits STATE
- City
- — inherits STATE
ZIP-level market 48708
- Home prices YoY
- -30.9%
- Active inventory
- 148
- Price-to-rent
- 9.7×
Monthly cashflow live
- Estimated rent
- $1,075 medium interval (Pro) →
- Mortgage (P&I)
- −$655
- Tax from tax record
- −$77 /mo · $920/yr
- Insurance
- −$52
- HOA
- −$0
- Vacancy / Maint / Mgmt
- −$226
- Net cashflow
- $66
Break-even live
UW: 25.0% down · 7.5% · 30yr · 1.5% tax · 5.0% vac · 8.0% maint · 8.0% mgmt
Financing live
Cash to close
- Down payment
- $31,225
- Closing costs
- $3,747
- Reserves months
- —
- Total cash needed
- —
Loan-product check · same deal, 3 products live
Conventional
25% down · 7.5% · 30yr
- Down + closing
- —
- Monthly P&I
- —
- Monthly cashflow
- —
- DSCR
- —
- Eligible?
- —
Personal DTI + credit; lowest rate.
DSCR
20% down · 8.5% · 30yr
- Down + closing
- —
- Monthly P&I
- —
- Monthly cashflow
- —
- DSCR
- —
- Eligible?
- —
No personal income docs; deal must DSCR.
Hard money
10% down · 12.0% · 12mo
- Down + closing
- —
- Monthly P&I
- —
- Monthly cashflow
- —
- DSCR
- —
- Eligible?
- —
Short-term bridge; refi at stabilization.
Listing history 20 events
-
2026-06-19days on market $124,900 Active 67 DOM
-
2026-06-18days on market $124,900 Active 66 DOM
-
2026-06-17days on market $124,900 Active 65 DOM
-
2026-06-16days on market $124,900 Active 64 DOM
-
2026-06-15days on market $124,900 Active 63 DOM
-
2026-06-14days on market $124,900 Active 61 DOM
-
2026-06-12days on market $124,900 Active 60 DOM
-
2026-06-09days on market $124,900 Active 57 DOM
-
2026-06-08days on market $124,900 Active 56 DOM
-
2026-06-07days on market $124,900 Active 55 DOM
-
2026-06-05days on market $124,900 Active 52 DOM
-
2026-06-03days on market $124,900 Active 51 DOM
-
2026-06-02days on market $124,900 Active 50 DOM
-
2026-06-01days on market $124,900 Active 49 DOM
-
2026-05-31days on market $124,900 Active 48 DOM
-
2026-05-30days on market $124,900 Active 47 DOM
-
2026-05-05price $124,900 341-char remark
Show marketing remark (341 chars)
Move in ready and affordable! This two bed ranch is ready for it's new owners. Sitting far away from the road this home has much to offer. Updated vinyl windows throughout. New flooring/carpet. First floor laundry. Large bedrooms with spacious closets. Fenced in back yard with lots of trees for privacy. Call today for your private showing!
-
2026-04-13$129,900 Active 341-char remark
Show marketing remark (341 chars)
Move in ready and affordable! This two bed ranch is ready for it's new owners. Sitting far away from the road this home has much to offer. Updated vinyl windows throughout. New flooring/carpet. First floor laundry. Large bedrooms with spacious closets. Fenced in back yard with lots of trees for privacy. Call today for your private showing!
ⓘ Source: listings_history table (triggers on properties + properties_extension) + one-shot
backfill from property_details.listing_events for pre-trigger history.
Tax reassessment forecast MI · Partial reset (capped growth)
- Current annual tax
- $920 · $77/mo
- Projected year-2 tax
- $1,422 · $118/mo
- Expected delta
- +$502/yr (+$42/mo · 54.5%)
ⓘ Screening estimate from a state-policy table — verify with the county assessor before closing.
Climate risk First Street
- Flood 1/10 Low FEMA zone X (unshaded) · 0% chance over 30 yrs
- Wildfire 1/10 Low
- Heat 3/10 Moderate 7 d/yr ≥97°F today · 14 d/yr by 30 yrs out
- Wind 1/10 Low
- Air quality 2/10 Low 1 unhealthy d/yr today · 2 by 30 yrs out
Nearby sold comps map
Loading sold comps map…
Walkable amenities ~0.75 mi
Loading nearby amenities…
Taxation est. · year 1
- Rental income
- $12,900
- − Mortgage interest
- −$6,996
- − Property taxes
- −$920
- − Insurance
- −$624
- − Repairs & maintenance
- −$1,032
- − Management
- −$1,032
- − Depreciation
- −$3,633
- Taxable loss
- −$1,338
- Est. tax savings @ 24.0%
- +$321
- After-tax cash flow
- $1,108/yr
For passive investors: Depreciation is non-cash, so a rental often shows a tax loss while cash-flowing — sheltering income. Rental losses are passive: they offset passive income freely, and up to $25,000/yr can offset ordinary (W-2) income if you actively participate and your MAGI is under $100k (phasing out to $0 by $150k); unused losses carry forward. On sale, claimed depreciation is recaptured at up to 25%, and gains may owe capital-gains tax (a 1031 exchange can defer both). Figures are a year-1 estimate at your 24.0% rate — not tax advice; consult a CPA.
Schools (NCES district)
- District
- Bay City School District
- NCES district ID
- 2604260
- Math proficiency
- 27% ▼ -8.00%
- Reading proficiency
- 40% ▼ -4.00%
- Median HH income
- $43,833
- Composite
- 28.47/100
- National rank
- #6743
- State rank
- #317 of 540 in MI
Livability — Bay City
- Score
- 68/100
- State rank
- #360
- US rank
- #8912
Category grades
Schools grade is shown separately in the Schools card above.
Census & demographics
- County
- Bay County · 36,975 people
- City population
- 25,635
- Metro
- Bay City, MI
- Population (ZIP)
- 25,635
- Household income
- $50,518
- Rent vs Own
- Severe rent burden
- 528.0
Population outlook (Bay County) Hauer SSP2
- Today (2025)
- 101,476 people
- By 2030
- 98,152 · -3.3%
- By 2040
- 89,711 · -11.6%
- By 2050
- 80,614 · -20.6%
- By 2075
- 60,544 · -40.3%
- By 2100
- 41,603 · -59.0%
Race, ethnicity, and origin ACS 2023
- Neighborhood character
- Predominantly White (81%)
- Race & ethnicity
- White 81% Hispanic / Latino 11% Two or more races 10% Black 3%
- Hispanic origin (detail)
- Mexican 9%
- Common ancestry
- Romanian 17% Lithuanian 7% Slovak 2%
- Foreign-born
- 2% · Canada, South Korea
- Languages at home
- 96% English-only · Spanish 2% German/W. Germanic 1%
Political lean MEDSL · Bay
- 2024 margin
- R (+14.7) · D 42.0% · R 56.7% · Other 1.3%
- 2008→2024 swing
- -30.0pp toward R · 2008: 15.3pp · 2024: -14.7pp
- All cycles
- 2024: R+14.7 2020: R+11.6 2016: R+12.6 2012: D+6.0 2008: D+15.3
Not yet ingested
- Civics
- —
Market trends
- HPI YoY
- ▼ -82.21%
- Current HPI
- 183.5774
- Rent YoY
- —
- Metro
- Bay City, MI
- State GDP YoY
- ▲ 1.37%
- F500 in state
- 28
Industry mix (Fortune 500 HQ in MI)
| Industry | F500 HQs | Revenue |
|---|---|---|
| Automotive Parts | 3 | $48B |
|
||
| Automotive | 2 | $372B |
|
||
| Chemicals | 1 | $45B |
|
||
| Automotive Retail | 1 | $29B |
|
||
| Healthcare / Medical Devices | 1 | $23B |
|
||
| Automotive Technology | 1 | $20B |
|
||
Price history
-3.8% since first listed4 events — show timeline
- 2026-05-05 Price Changed $124,900 MiRealSource-MiMLS
- 2026-05-05 Price Changed $124,900 REALCOMP
- 2026-04-13 Listed $129,900 REALCOMP
- 2026-04-13 Listed $129,900 MiRealSource-MiMLS
Property tax history
-2.6%/yrLatest (2025): $920 · -43.9% YoY. Source: county tax records.
Cash-flow waterfall
monthlySold comps — $/sqft
last 12 mo · ≤1 miLoading sold comps…