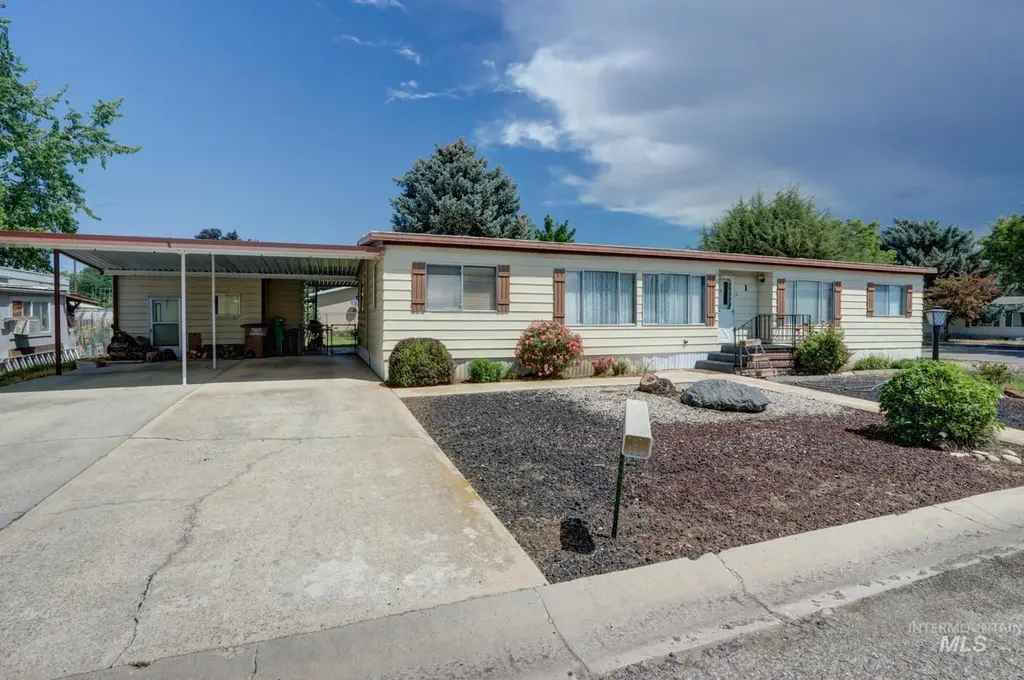
701 Monte Vista Dr #1 · Emmett, ID
Flood risk 1/10 · Minimal
- FEMA flood zone
- D
- Chance of flooding over 30 yrs
- 0.0%
- Est. flood insurance / yr
- $544 – $1,084
Fire risk 3/10 · Minor
- Est. fire insurance / yr
- $584 – $1,086
Heat risk 5/10 · Moderate
- Hot days now (above 97°F)
- 7 days/yr
- Hot days in 30 yrs
- 20 days/yr
Wind risk 1/10 · Minimal
- Chance of severe wind over 30 yrs
- —
Air-quality risk 7/10 · Major
- Unhealthy air days now
- 13 days/yr
- Unhealthy air days in 30 yrs
- 16 days/yr
Risk factors via First Street. Map © Google.
Why this score? — see what drove the C grade
The composite is a weighted blend of 9 inputs, each scored 0–100. Each bar is that input's sub-score; the figure is the points it added to the 100-point composite (weight × sub-score).
- Cash flow +17.6/30.0
- ARV discount +15.0/15.0
- 1% rule +10.0/10.0
- DSCR +5.5/10.0
- Livability +3.4/5.0
- Schools +3.2/10.0
- Rent growth +2.5/5.0
- Condition / age +2.2/5.0
- Appreciation +0.0/10.0
$93,500
🖨 Deal sheet 📄 Offer letter ✓ Due diligence
Listing remarks
Beautiful Home with great floor plan & huge yard. Owner has taken wonderful care of this home. 3 bed, 2 bath, Family & Living rooms, plus office. Home sits on large lot, double carport, small shop, large covered patio. Refrigerator, washer & dryer included. Family room wood stove keeps this home warm & toasty during winter. This home is a real gem in Beautiful Emmett!
Key facts
- 2 parking spots
- Built 1978
- Listed 13 days
Property features AI
Finance
- Other: Property is in the Monte Vista Gem subdivision
- HOA & community: Monthly association fee of $600
Exterior
- Parking: Covered carport for 2 cars
- Security: Bathroom safety bars
- Utilities: City water service; Sewer connected; Cable available; Electric power
- Home design: Mobile/manufactured home on a rented lot; Built in 1978; Steel siding; Metal roof
- Construction: Steel siding construction; Metal roof; Year built: 1978
- Exterior features: Partial wire fencing; Garden area; Views; Manual sprinkler system; Located in a mobile home park; Paved road access
Interior
- Kitchen: Dishwasher; Built-in oven/range; Refrigerator
- Bedrooms: 3 bedrooms, all on the main level; Primary bedroom approximately 12 x 13; Second bedroom approximately 11 x 11; Third bedroom approximately 11 x 12
- Flooring: Carpet; Laminate
- Bathrooms: 2 bathrooms
- Heating & cooling: Electric forced-air heating; Wood heating option (wood burning stove); Central air conditioning
- Interior features: Master bedroom with attached bath; Split bedroom floor plan; Den/office; Family room; Great room; Breakfast bar; Pantry; Laminate counters; Bathroom grab bars
- Laundry & utility: Dryer; Utility room on the main level; Electric water heater
Neighborhood map
What this means for you Summary
Snapshot
- This is a 3-bed/2.0-bath manufactured listed at $94k. Condition is rated fair.
Deal economics
- At list price, monthly cash flow is $73 ($875/yr) — positive.
- The deal already cash-flows at list — no discount required.
- Meets the 1% rule at list price ($2k rent vs $94k).
- Cap rate 7.2% vs local median 1.0% in Emmett — top-decile yield for the area; either an underpriced asset or a hidden risk that comps aren't pricing in. Stress-test before assuming the spread holds.
Location & tenants
- Location reads 68/100 on livability (#77 in ID) — a middle-class / working-renter tenant base. Strengths: cost of living A+, housing A+, health & safety A+; Watch: employment D, amenities F, commute F.
- Emmett Independent District (town): math 33% / reading 43% proficiency, ranked #73 of 92 in ID (top 79%) — families likely to look elsewhere, expect single-tenant / working-renter base with shorter leases.
- Zoned schools: Kenneth J Carberry Elementary (math 34% / reading 38%, grade F, #268 of 357 statewide, top 75%, 489 students, 46% FRL); Emmett High School (math 42% / reading 67%, grade C-, #26 of 169 statewide, top 17%, 737 students, 23% FRL).
- Market conditions: 332 active listings in the ZIP; 198 units permitted in Gem County in 2024 (0 in 5+ unit buildings).
Forward outlook
- Local home prices are declining (-3.0%/yr); year-one equity from $646 of loan paydown is wiped out by about $3k of value loss. Plan a longer hold.
- Gem County population projected to shrink 4% by 2050 — rents likely to lag national; underwrite the cash flow, not the appreciation.
Negotiation context
- Only 13 days on market — expect competitive offers; lowballing is unlikely to land.
Risks & watch-outs
- Watch-outs: HOA is 36% of rent.
- Climate carrying-cost: extreme-heat days projected 7→20/yr by 2055 (HVAC capex compounding) — expect insurance premiums to compound above CPI over the hold.
Questions for the listing agent
- Have any recent inspections been done? Can we get a copy of the seller's disclosures and any deferred-maintenance estimates?
- Built in 1978 — when were the roof, HVAC, electrical panel, plumbing, and water heater last replaced?
- What does the HOA fee cover, when was the last increase, and are there any pending special assessments or reserve-fund shortfalls?
- Is there a deadline driving the sale (1031 exchange, divorce, estate, relocation)? That informs how much negotiation room exists.
- Schools are F-rated, which usually means shorter tenancies and higher turnover. Who's the typical renter profile here, and what's been the actual vacancy rate?
- What's the average days-on-market for RENTAL listings here right now (not sales)? A rising rental-DOM trend means longer vacancies and softer asking-rent achievability than the comps imply.
- What's the recent tenant-quality profile in this submarket — average credit score on applications, eviction rate, late-payment / NSF rate, and stable-employment percentage? A property-management company in the area should have these aggregated.
- How much new for-sale + rental construction is in the pipeline within 1–3 miles? Heavy new supply typically softens prices + rents 12–24 months out; constrained supply supports both.
Investment metrics
- 1% rule
- 1.79% ✓
- Cap rate
- 7.23%
- Cash-on-cash
- 3.34%
- DSCR
- 1.15
- GRM
- 4.7
CMA / ARV
- ARV (on-the-fly)
- $147,060
- Comps found
- 4
Show comp detail 4 sales within ~0.75 mi
| Address | Dist | Beds/Ba | Sqft | Sold | Price | $/sf | Match |
|---|---|---|---|---|---|---|---|
| 701 Monte Vista Dr #85 | 0.00mi | 3/2.0 | 1,680 (-2%) | 19mo | $100,000 | $60 | 81 |
| 701 Monte Vis #18 | 0.05mi | 3/2.0 | 1,600 (-6%) | 17mo | $102,000 | $64 | 73 |
| 701 Monte Vista Dr #64 | 0.10mi | 3/2.0 | 1,508 (-12%) | 14mo | $130,000 | $86 | 64 |
| 655 Independence Ln | 0.49mi | 3/2.0 | 1,568 (-8%) | 13mo | $195,000 | $124 | 53 |
Match score weights: distance 35% · size 25% · config 20% · recency 20%. Top-matched comps best support the ARV.
Projected returns pro-forma
-3.0% appreciation · 3.0% rent growth · sell at horizon
- IRR
- -10.6%
- Equity multiple
- 0.61×
- Total profit
- $-10,114
- Equity at exit
- $13,941
- IRR
- -0.7%
- Equity multiple
- 0.95×
- Total profit
- $-1,227
- Equity at exit
- $8,084
Cash invested: $26,180 (down + closing). Projections, not guarantees.
Landlord ↔ Tenant lean methodology
- Overall (STATE)
- 91 Strongly Landlord-Friendly
- State Idaho
- 91 Strongly Landlord-Friendly · R+18
- County
- — inherits STATE
- City
- — inherits STATE
ZIP-level market 83617
- Active inventory
- 332
- Price-to-rent
- 4.7×
Monthly cashflow live
- Estimated rent
- $1,670 medium interval (Pro) →
- Mortgage (P&I)
- −$490
- Tax est. 1.5%
- −$117 /mo · $1,402/yr
- Insurance
- −$39
- HOA
- −$600
- Vacancy / Maint / Mgmt
- −$351
- Net cashflow
- $73
Break-even live
UW: 25.0% down · 7.5% · 30yr · 1.5% tax · 5.0% vac · 8.0% maint · 8.0% mgmt
Financing live
Cash to close
- Down payment
- $23,375
- Closing costs
- $2,805
- Reserves months
- —
- Total cash needed
- —
Loan-product check · same deal, 3 products live
Conventional
25% down · 7.5% · 30yr
- Down + closing
- —
- Monthly P&I
- —
- Monthly cashflow
- —
- DSCR
- —
- Eligible?
- —
Personal DTI + credit; lowest rate.
DSCR
20% down · 8.5% · 30yr
- Down + closing
- —
- Monthly P&I
- —
- Monthly cashflow
- —
- DSCR
- —
- Eligible?
- —
No personal income docs; deal must DSCR.
Hard money
10% down · 12.0% · 12mo
- Down + closing
- —
- Monthly P&I
- —
- Monthly cashflow
- —
- DSCR
- —
- Eligible?
- —
Short-term bridge; refi at stabilization.
HOA detail
- Monthly dues
- $600 · $7,200/yr
Listing history 10 events
-
2026-06-13statusdays on market $93,500 Pending 13 DOM
-
2026-06-10days on market $93,500 Active 12 DOM
-
2026-06-09days on market $93,500 Active 11 DOM
-
2026-06-08days on market $93,500 Active 10 DOM
-
2026-06-07days on market $93,500 Active 9 DOM
-
2026-06-05days on market $93,500 Active 6 DOM
-
2026-06-03days on market $93,500 Active 5 DOM
-
2026-06-03days on market $93,500 Active 4 DOM
-
2026-06-01days on market $93,500 Active 3 DOM
-
2026-05-31days on market $93,500 Active 2 DOM
ⓘ Source: listings_history table (triggers on properties + properties_extension) + one-shot
backfill from property_details.listing_events for pre-trigger history.
Climate risk First Street
- Flood 1/10 Low FEMA zone D · 0% chance over 30 yrs
- Wildfire 3/10 Moderate
- Heat 5/10 Major 7 d/yr ≥97°F today · 20 d/yr by 30 yrs out
- Wind 1/10 Low
- Air quality 7/10 Severe 13 unhealthy d/yr today · 16 by 30 yrs out
Nearby sold comps map
Loading sold comps map…
Walkable amenities ~0.75 mi
Loading nearby amenities…
Taxation est. · year 1
- Rental income
- $20,036
- − Mortgage interest
- −$5,237
- − Property taxes
- −$1,402
- − Insurance
- −$468
- − Repairs & maintenance
- −$1,603
- − Management
- −$1,603
- − HOA
- −$7,200
- − Depreciation
- −$2,720
- Taxable loss
- −$197
- Est. tax savings @ 24.0%
- +$47
- After-tax cash flow
- $922/yr
For passive investors: Depreciation is non-cash, so a rental often shows a tax loss while cash-flowing — sheltering income. Rental losses are passive: they offset passive income freely, and up to $25,000/yr can offset ordinary (W-2) income if you actively participate and your MAGI is under $100k (phasing out to $0 by $150k); unused losses carry forward. On sale, claimed depreciation is recaptured at up to 25%, and gains may owe capital-gains tax (a 1031 exchange can defer both). Figures are a year-1 estimate at your 24.0% rate — not tax advice; consult a CPA.
Condition & rehab AI · 13 photos
This manufactured home requires moderate repairs and maintenance to improve its condition and value. Painting the interior walls, replacing worn-out flooring, and updating the kitchen cabinets would significantly enhance its resale and rental value.
Repairs flagged
- Moderate Kitchen cabinets — The cabinets show signs of wear and tear, indicating a need for replacement or repair.
- Minor Bathroom fixtures — The fixtures show some wear, but are still functional and can be replaced with minimal effort.
- Moderate Exterior siding — The siding shows signs of wear and tear, indicating a need for replacement or repair.
Value-add opportunities
- Resale Paint interior walls — Fresh paint can make a significant difference in the home's appearance and appeal to potential buyers.
- Rental Replace worn-out flooring — New flooring can improve the home's rental value by providing a more attractive and functional living space.
- Both Replace worn-out kitchen cabinets — New cabinets can improve the home's appearance and functionality, making it more attractive to both buyers and renters.
Renovation cost estimate screening
| Repair item | Severity | Est. cost |
|---|---|---|
| Kitchen cabinets · The cabinets show signs of wear and tear, indicating a need for replacement or repair. | Moderate | $3,000–15,000 |
| Bathroom fixtures · The fixtures show some wear, but are still functional and can be replaced with minimal effort. | Minor | $500–3,000 |
| Exterior siding · The siding shows signs of wear and tear, indicating a need for replacement or repair. | Moderate | $3,000–15,000 |
| Total estimated repair cost · 3 items | $6,500–33,000 |
Value-add ROI direction
- Resale Paint interior walls — Fresh paint can make a significant difference in the home's appearance and appeal to potential buyers. ↑
- Rental Replace worn-out flooring — New flooring can improve the home's rental value by providing a more attractive and functional living space. ↑
- Both Replace worn-out kitchen cabinets — New cabinets can improve the home's appearance and functionality, making it more attractive to both buyers and renters. ↑
ⓘ Cost ranges are severity-bucket heuristics (US national rule-of-thumb). Get contractor quotes + a written scope before underwriting a rehab budget.
Schools (NCES district)
- District
- Emmett Independent District
- NCES district ID
- 1601020
- Math proficiency
- 33% ▼ -2.00%
- Reading proficiency
- 43% ▼ -2.00%
- Median HH income
- $42,067
- Composite
- 32.04/100
- National rank
- #5823
- State rank
- #73 of 92 in ID
Livability — Emmett
- Score
- 68/100
- State rank
- #77
- US rank
- #9353
Category grades
Schools grade is shown separately in the Schools card above.
Census & demographics
- Census place
- Emmett, ID
- Population (ZIP)
- 17,333
Population outlook (Gem County) Hauer SSP2
- Today (2025)
- 17,343 people
- By 2030
- 17,416 · +0.4%
- By 2040
- 17,236 · -0.6%
- By 2050
- 16,613 · -4.2%
- By 2075
- 15,111 · -12.9%
- By 2100
- 12,472 · -28.1%
Race, ethnicity, and origin ACS 2023
- Neighborhood character
- Predominantly White (83%)
- Race & ethnicity
- White 83% Hispanic / Latino 10% Two or more races 9%
- Hispanic origin (detail)
- Mexican 8%
- Common ancestry
- Slovak 6% Portuguese 4% Lithuanian 4%
- Foreign-born
- 5% · Canada
- Languages at home
- 90% English-only · Spanish 7% Russian/Polish/Slavic 2%
Political lean MEDSL · Gem
- 2024 margin
- Solid R (+66.0) · D 16.0% · R 82.0% · Other 2.0%
- 2008→2024 swing
- -23.0pp toward R · 2008: -43.0pp · 2024: -66.0pp
- All cycles
- 2024: R+66.0 2020: R+61.7 2016: R+59.7 2012: R+44.8 2008: R+43.0
Not yet ingested
- Civics
- —
Market trends
- HPI YoY
- ▼ -186.67%
- Current HPI
- 265.361
- Rent YoY
- —
- Metro
- —
- State GDP YoY
- ▲ 4.51%
- F500 in state
- 6
Industry mix (Fortune 500 HQ in ID)
| Industry | F500 HQs | Revenue |
|---|---|---|
| Retail | 1 | $79B |
|
||
| Technology | 1 | $25B |
|
||
| Food / Agriculture | 1 | $6B |
|
||
Price history
1 event — show timeline
- 2026-05-29 Listed $93,500 IMLS
Cash-flow waterfall
monthlySold comps — $/sqft
last 12 mo · ≤1 miLoading sold comps…