 Multi-family
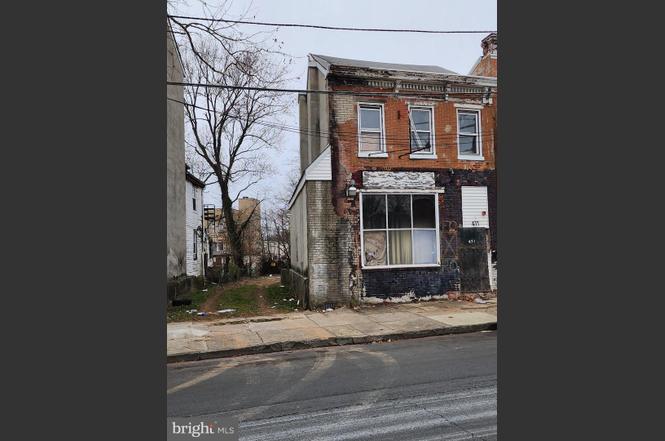
431 Martin Luther King Jr Bld · Trenton, NJ
Flood risk No data
- FEMA flood zone
- —
- Chance of flooding over 30 yrs
- —
- Est. flood insurance / yr
- —
Fire risk No data
- Est. fire insurance / yr
- —
Heat risk No data
- Hot days now (above threshold)
- —
- Hot days in 30 yrs
- —
Wind risk No data
- Chance of severe wind over 30 yrs
- —
Air-quality risk No data
- Unhealthy air days now
- —
- Unhealthy air days in 30 yrs
- —
Risk factors via First Street. Map © Google.
Why this score? — see what drove the B- grade
The composite is a weighted blend of 9 inputs, each scored 0–100. Each bar is that input's sub-score; the figure is the points it added to the 100-point composite (weight × sub-score).
- Cash flow +30.0/30.0
- DSCR +10.0/10.0
- 1% rule +9.3/10.0
- ARV discount +7.5/15.0
- Livability +3.8/5.0
- Rent growth +3.2/5.0
- Condition / age +2.5/5.0
- Schools +0.7/10.0
- Appreciation +0.0/10.0
$250,000
🖨 Deal sheet 📄 Offer letter ✓ Due diligence
Multi-family units
County records classify this as Multi-Family (2-4 Unit). Listing-text estimate: 1 unit. estimate disagrees with records
Listing remarks
Calling all investors, developers, and entrepreneurs 431 Martin Luther King Jr. Blvd. presents a prime mixed-use property in the heart of Trenton, offering both commercial and residential potential under one roof. This vacant building currently features a commercial storefront on the main level with residential space above, making it an ideal opportunity for those looking to renovate, reposition, and add long-term value. Whether you're planning to operate your own business on the ground floor or lease to a commercial tenant, the flexible layout offers plenty of possibilities. The upper residential unit(s) can be transformed into income-generating apartments or used for owner occupancy. The
Key facts
- 2,479 sq ft lot
- Built 1886
- Listed 181 days
Property features AI
Finance
- Financial info: Fee simple ownership; Total units in building: 2; Vacant units: 2
Exterior
- Parking: On-street parking
- Utilities: Public water; Public sewer
- Home design: Semi-detached structure; Above-grade living space
- Construction: Brick construction; Foundation: Other; Estimated year built
- Exterior features: No tidal water
Interior
- Bedrooms: 10 single-room units; 4 two-bedroom units
- Heating & cooling: Heating: Natural gas and electric; Cooling fuel: Electric; Hot water: Electric
- Interior features: Eat-in kitchen
Neighborhood map
What this means for you Summary
Snapshot
- This is a 8-bed/?-bath multifamily listed at $250k.
Deal economics
- At list price, monthly cash flow is $1k ($13k/yr) — positive.
- The deal already cash-flows at list — no discount required.
- Meets the 1% rule at list price ($4k rent vs $250k).
- Recommended offer: $220k (12.0% below list) — sets the bar for market timing.
- Cap rate 11.5% vs local median 6.3% in Trenton — top-decile yield for the area; either an underpriced asset or a hidden risk that comps aren't pricing in. Stress-test before assuming the spread holds.
Location & tenants
- Location reads 76/100 on livability (#133 in NJ, #3,533 nationally) — a middle-class / working-renter tenant base. Strengths: amenities A+, commute A+, health & safety A+; Watch: schools F, crime F, employment F.
- Trenton Public School District (urban): math 2% / reading 16% proficiency, ranked #471 of 472 in NJ (top 100%) — low school quality limits family demand, transient renter base, plan for 1-2y turnover; 80% free/reduced lunch — lower-income household profile, screen leases tightly.
- Market conditions: Rents rising (+2.6%/yr); 144 active listings in the ZIP; 2,256 units permitted in Mercer County in 2024 (1,303 in 5+ unit buildings).
- At $3,572/mo this rent would consume 85% of the median local household income ($50k/yr) (locally 2116% of renters already pay >50% of income on rent) — very limited rent-growth headroom before tenants either downsize or default.
Forward outlook
- Local home prices are declining (-3.0%/yr); year-one equity from $2k of loan paydown is wiped out by about $8k of value loss. Plan a longer hold.
- Mercer County population projected at +4% by 2050 — modest demand growth; plan on rents tracking national, not racing it.
- At projected returns (-3.0% appreciation + 2.6% rent growth), your $70k cash investment doubles in ~7 years — after that, you're playing with house money.
Negotiation context
- It's been on market 182 days — a 12% lower offer ($220k) is reasonable based on typical stale-listing flexibility.
- 2 sale attempts since 21y ago with the ask held roughly flat each time — persistent listings suggest the price (not the market) is what's stuck; bring a comps-based counter.
Risks & watch-outs
- Watch-outs: built in 1886 — expect roof / HVAC / electrical / plumbing capex.
Questions for the listing agent
- It's been on market 182 days. Have you received any prior offers? Is the seller open to a 12% concession, seller financing, or rate buy-down credit?
- Built in 1886 — when were the roof, HVAC, electrical panel, plumbing, and water heater last replaced?
- Why hasn't it sold? Are there any deal-killer items the seller is aware of (foundation, flood, title, zoning, code violations)?
- Is there a deadline driving the sale (1031 exchange, divorce, estate, relocation)? That informs how much negotiation room exists.
- Schools are F-rated, which usually means shorter tenancies and higher turnover. Who's the typical renter profile here, and what's been the actual vacancy rate?
- Crime grade is F in this area — have there been break-ins, vandalism, or insurance claims at this property in the last 3 years? What carrier currently insures it and at what premium?
- What's the average days-on-market for RENTAL listings here right now (not sales)? A rising rental-DOM trend means longer vacancies and softer asking-rent achievability than the comps imply.
- What's the recent tenant-quality profile in this submarket — average credit score on applications, eviction rate, late-payment / NSF rate, and stable-employment percentage? A property-management company in the area should have these aggregated.
- How much new apartment / multifamily construction is in the pipeline within 1–3 miles? Heavy new supply (>2% of stock underway) typically softens rents 12–24 months out; light construction supports rent growth.
Investment metrics
- 1% rule
- 1.43% ✓
- Cap rate
- 11.55%
- Cash-on-cash
- 18.76%
- DSCR
- 1.83
- GRM
- 5.8
CMA / ARV
No comps found within radius.
Show comp detail 4 sales within ~0.75 mi
| Address | Dist | Beds/Ba | Sqft | Sold | Price | $/sf | Match |
|---|---|---|---|---|---|---|---|
| 48 N Stockton St | 0.40mi | 7/3.0 (-1) | — | 2mo | $437,500 | — | 63 |
| 393 Brunswick Ave | 0.38mi | 8/2.0 | 2,261 | 9mo | $200,000 | $88 | 63 |
| 314 W State St | 0.62mi | 7/3.0 (-1) | 3,132 | 10mo | $475,000 | $152 | 45 |
| 609 Brunswick Ave | 0.72mi | 9/— (+1) | — | 17mo | $575,000 | — | 35 |
Match score weights: distance 35% · size 25% · config 20% · recency 20%. Top-matched comps best support the ARV.
Projected returns pro-forma
-3.0% appreciation · 2.6% rent growth · sell at horizon
- IRR
- 10.1%
- Equity multiple
- 1.40×
- Total profit
- $27,800
- Equity at exit
- $37,276
- IRR
- 18.9%
- Equity multiple
- 2.55×
- Total profit
- $108,335
- Equity at exit
- $21,615
Cash invested: $70,000 (down + closing). Projections, not guarantees.
Landlord ↔ Tenant lean methodology
- Overall (STATE)
- 21 Tenant-Leaning
- State New Jersey
- 21 Tenant-Leaning · D+6
- County
- — inherits STATE
- City
- — inherits STATE
ZIP-level market 08618
- Rents YoY
- 2.6%
- Active inventory
- 144
- Price-to-rent
- 11.7×
Monthly cashflow live
- Estimated rent
- $3,572 high interval (Pro) →
- Mortgage (P&I)
- −$1,311
- Tax est. 1.5%
- −$312 /mo · $3,750/yr
- Insurance
- −$104
- HOA
- −$0
- Vacancy / Maint / Mgmt
- −$750
- Net cashflow
- $1,094
Break-even live
2-unit breakdown (identical units grouped — click to expand)
| Units | Beds | Baths | Est. rent |
|---|---|---|---|
| 2× units | 2 | 1.5 | $3,572 |
| #1 | 2 | 1.5 | $1,786 |
| #2 | 2 | 1.5 | $1,786 |
| Total (2 units) | $3,572 | ||
UW: 25.0% down · 7.5% · 30yr · 1.5% tax · 5.0% vac · 8.0% maint · 8.0% mgmt
Financing live
Cash to close
- Down payment
- $62,500
- Closing costs
- $7,500
- Reserves months
- —
- Total cash needed
- —
Loan-product check · same deal, 3 products live
Conventional
25% down · 7.5% · 30yr
- Down + closing
- —
- Monthly P&I
- —
- Monthly cashflow
- —
- DSCR
- —
- Eligible?
- —
Personal DTI + credit; lowest rate.
DSCR
20% down · 8.5% · 30yr
- Down + closing
- —
- Monthly P&I
- —
- Monthly cashflow
- —
- DSCR
- —
- Eligible?
- —
No personal income docs; deal must DSCR.
Hard money
10% down · 12.0% · 12mo
- Down + closing
- —
- Monthly P&I
- —
- Monthly cashflow
- —
- DSCR
- —
- Eligible?
- —
Short-term bridge; refi at stabilization.
Listing history 18 events
-
2026-06-18days on market $250,000 Active 182 DOM
-
2026-06-17days on market $250,000 Active 181 DOM
-
2026-06-16days on market $250,000 Active 180 DOM
-
2026-06-15days on market $250,000 Active 179 DOM
-
2026-06-14days on market $250,000 Active 177 DOM
-
2026-06-10days on market $250,000 Active 174 DOM
-
2026-06-09days on market $250,000 Active 173 DOM
-
2026-06-08days on market $250,000 Active 172 DOM
-
2026-06-07days on market $250,000 Active 171 DOM
-
2026-06-03days on market $250,000 Active 167 DOM
-
2026-06-02days on market $250,000 Active 166 DOM
-
2026-06-01days on market $250,000 Active 165 DOM
-
2026-05-31days on market $250,000 Active 164 DOM
-
2026-05-30days on market $250,000 Active 163 DOM
-
2025-12-19$250,000 Active
-
2025-12-18historical $250,000
-
2005-07-17historical
-
2005-04-17$85,000
ⓘ Source: listings_history table (triggers on properties + properties_extension) + one-shot
backfill from property_details.listing_events for pre-trigger history.
Nearby sold comps map
Loading sold comps map…
Walkable amenities ~0.75 mi
Loading nearby amenities…
Taxation est. · year 1
- Rental income
- $42,864
- − Mortgage interest
- −$14,004
- − Property taxes
- −$3,750
- − Insurance
- −$1,250
- − Repairs & maintenance
- −$3,429
- − Management
- −$3,429
- − Depreciation
- −$7,273
- Taxable income
- $9,729
- Est. tax owed @ 24.0%
- −$2,335
- After-tax cash flow
- $10,795/yr
For passive investors: Depreciation is non-cash, so a rental often shows a tax loss while cash-flowing — sheltering income. Rental losses are passive: they offset passive income freely, and up to $25,000/yr can offset ordinary (W-2) income if you actively participate and your MAGI is under $100k (phasing out to $0 by $150k); unused losses carry forward. On sale, claimed depreciation is recaptured at up to 25%, and gains may owe capital-gains tax (a 1031 exchange can defer both). Figures are a year-1 estimate at your 24.0% rate — not tax advice; consult a CPA.
Schools (NCES district)
- District
- Trenton Public School District
- NCES district ID
- 3416290
- Math proficiency
- 2% ▼ -8.00%
- Reading proficiency
- 16% ▼ -4.00%
- Median HH income
- $35,078
- Composite
- 7.31/100
- National rank
- #9956
- State rank
- #471 of 472 in NJ
Livability — Trenton
- Score
- 76/100
- State rank
- #133
- US rank
- #3533
Category grades
Schools grade is shown separately in the Schools card above.
Census & demographics
- Census place
- Trenton, NJ
- County
- Mercer County · 327,655 people
- City population
- 177,819
- Metro
- Trenton-Princeton, NJ
- Population (ZIP)
- 35,634
- Household income
- $50,390
- Rent vs Own
- Severe rent burden
- 2116.0
Population outlook (Mercer County) Hauer SSP2
- Today (2025)
- 381,395 people
- By 2030
- 384,640 · +0.9%
- By 2040
- 391,431 · +2.6%
- By 2050
- 397,845 · +4.3%
- By 2075
- 417,281 · +9.4%
- By 2100
- 420,327 · +10.2%
Race, ethnicity, and origin ACS 2023
- Neighborhood character
- Diverse neighborhood (Simpson 0.59)
- Race & ethnicity
- Black 59% White 19% Hispanic / Latino 16% Two or more races 7% Asian 3%
- Hispanic origin (detail)
- Mexican 1% Puerto Rican 6% Dominican 3%
- Common ancestry
- Romanian 2% Hispanic 1% Scotch-Irish 1%
- Foreign-born
- 14% · Canada, China, South Korea
- Languages at home
- 80% English-only · Spanish 10% Other Indo-European 3% Arabic 1%
Political lean MEDSL · Mercer
- 2024 margin
- Solid D (+33.9) · D 65.9% · R 32.0% · Other 2.1%
- 2008→2024 swing
- -2.2pp toward R · 2008: 36.1pp · 2024: 33.9pp
- All cycles
- 2024: D+33.9 2020: D+40.0 2016: D+36.2 2012: D+36.8 2008: D+36.1
Not yet ingested
- Civics
- —
Market trends
- HPI YoY
- ▼ -309.54%
- Current HPI
- 288.6841
- Rent YoY
- ▲ 2.60%
- Metro
- Trenton-Princeton, NJ
- State GDP YoY
- ▲ 2.05%
- F500 in state
- 34
Industry mix (Fortune 500 HQ in NJ)
| Industry | F500 HQs | Revenue |
|---|---|---|
| Consumer Goods | 3 | $31B |
|
||
| Pharmaceuticals | 2 | $153B |
|
||
| Technology | 2 | $21B |
|
||
| Insurance | 2 | $20B |
|
||
| Healthcare | 2 | $19B |
|
||
| Financial Services | 1 | $70B |
|
||
Price history
+194.1% since first listed4 events — show timeline
- 2025-12-19 Listed $250,000 BRIGHT MLS
- 2025-12-18 Coming Soon $250,000 BRIGHT MLS
- 2005-07-17 Listing Removed — BRIGHT MLS
- 2005-04-17 Listed $85,000 BRIGHT MLS
Cash-flow waterfall
monthlySold comps — $/sqft
last 12 mo · ≤1 miLoading sold comps…