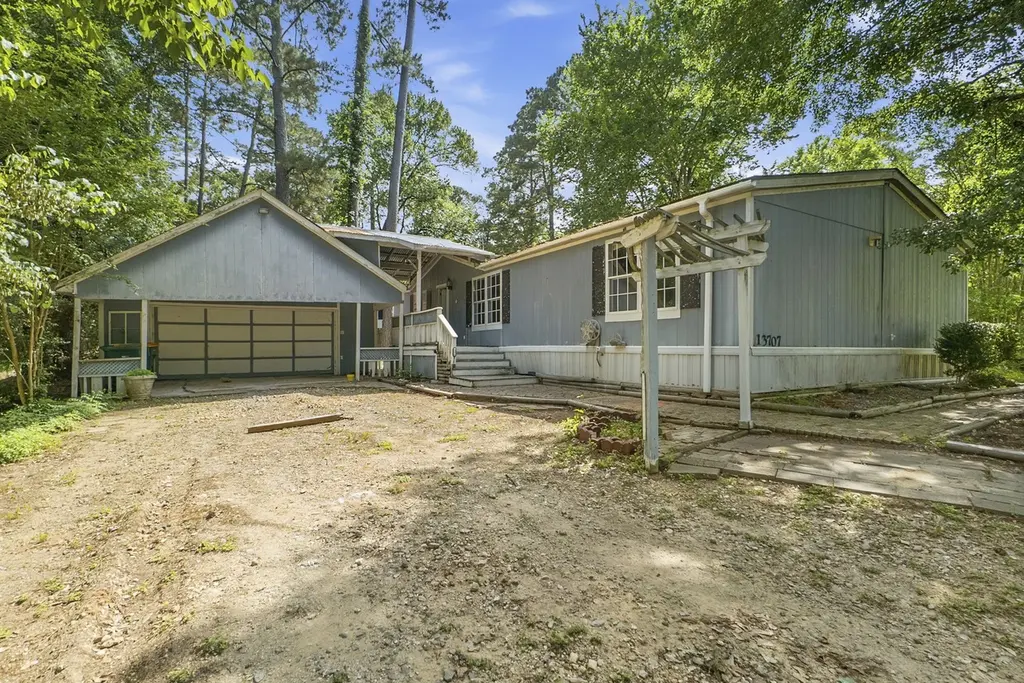
13707 Brigadier Dr · Conroe, TX
Flood risk 1/10 · Minimal
- FEMA flood zone
- X (unshaded)
- Chance of flooding over 30 yrs
- 0.0%
- Est. flood insurance / yr
- $507 – $1,088
Fire risk 3/10 · Minor
- Est. fire insurance / yr
- $1,222 – $2,270
Heat risk 8/10 · Major
- Hot days now (above 111°F)
- 7 days/yr
- Hot days in 30 yrs
- 23 days/yr
Wind risk 8/10 · Major
- Chance of severe wind over 30 yrs
- 99.0%
Air-quality risk 2/10 · Minimal
- Unhealthy air days now
- 1 days/yr
- Unhealthy air days in 30 yrs
- 1 days/yr
Risk factors via First Street. Map © Google.
Why this score? — see what drove the B- grade
The composite is a weighted blend of 9 inputs, each scored 0–100. Each bar is that input's sub-score; the figure is the points it added to the 100-point composite (weight × sub-score).
- Cash flow +30.0/30.0
- 1% rule +10.0/10.0
- DSCR +10.0/10.0
- ARV discount +7.5/15.0
- Livability +3.7/5.0
- Schools +3.2/10.0
- Condition / age +2.5/5.0
- Rent growth +2.0/5.0
- Appreciation +0.0/10.0
$129,900
🖨 Deal sheet 📄 Offer letter ✓ Due diligence
Listing remarks
TONS OF POTIENTIAL IN THIS 3/2 MANUFACTURED HOME LOCATED ON 3 LOTS IN THE VERY SOUGHT AFTER SHADOW BAY SUBDIVISION! FIX UP AND MAKE A PRIMARY RESIDENCE, OR TEAR IT DOWN AND HAVE THREE LOTS TO BUILD ON OR MOVE NEW MANUFACTURED HOMES IN ON! THE INTERIOR BOASTS SOLID SURFACE FLOORING THROUGHOUT, PLUS A LARGE LIVING AREA, AMAZING KITCHEN WITH TONS OF CABINETS, COZY BREAKFAST AREA, OVERSIZED UTILITY ROOM WITH WASHER & DRYER, SPLIT BEDROOM FLOORPLAN, COZY PRIMARY SUITE WITH WALK IN CLOSET, PRIMARY BATH WITH SEPARATE TUB & SHOWER, AND AMPLE SIZED SPARE BEDROOMS! THE OUTSIDE OFFERS A FANTASTIC COVERED DECK AREA, PLUS AN UNCOVERED DECK, THAT WOULD BE AN EXCELLENT ENTERTAINING AREA! AL
Key facts
- Large living area
- Manufactured home
- Three lots
Tags
Property features AI
Finance
- HOA & community: Shadow Bay HOA with annual fee; Community amenities include boat ramp and park
Exterior
- Parking: Detached 2-car garage; Driveway
- Utilities: Public water; Public sewer; Asphalt road access; Electric service
- Home design: Residential property; Faces east
- Construction: Built in 1995; Block foundation; Composition roof; Construction materials: Unknown
- Exterior features: Covered patio; Deck; Patio; Cleared lot; Subdivision
Interior
- Kitchen: Electric oven; Electric range; Refrigerator
- Bedrooms: 3 possible bedrooms
- Flooring: Laminate
- Bathrooms: 2 full bathrooms
- Heating & cooling: Central heating (electric); Central air (electric)
- Interior features: Double vanity; Kitchen island; Laminate counters; Pantry; Soaking tub; Separate shower; Tub/shower; Ceiling fans
- Laundry & utility: Washer hookup; Electric dryer hookup; Washer; Dryer
Neighborhood map
What this means for you Summary
Snapshot
- This is a 3-bed/2.0-bath manufactured listed at $130k.
Deal economics
- At list price, monthly cash flow is $771 ($9k/yr) — positive.
- The deal already cash-flows at list — no discount required.
- Meets the 1% rule at list price ($2k rent vs $130k).
- Recommended offer: $126k (3.0% below list) — sets the bar for market timing.
- Cap rate 13.4% vs local median 3.1% in Conroe — top-decile yield for the area; either an underpriced asset or a hidden risk that comps aren't pricing in. Stress-test before assuming the spread holds.
Location & tenants
- Location reads 74/100 on livability (#169 in TX, #4,447 nationally) — a middle-class / working-renter tenant base. Strengths: cost of living A+, housing A+, amenities B; Watch: commute F, health & safety F.
- Willis ISD (rural): math 33% / reading 40% proficiency, ranked #458 of 826 in TX (top 55%) — families likely to look elsewhere, expect single-tenant / working-renter base with shorter leases.
- Zoned schools: Robert P Brabham Middle (math 33% / reading 41%, grade F, #756 of 1,662 statewide, top 47%, 1,117 students, 52% FRL); Willis H S (math 19% / reading 46%, grade F, #1,029 of 1,632 statewide, top 64%, 2,521 students, 57% FRL) — zoned schools at 54% FRL track the district average.
- Market conditions: Rents soft (-2.1%/yr); 1189 active listings in the ZIP; 4 comparable units currently listed for rent nearby; rentals leasing fast (median 4d on market — plan ~1-2 weeks tenant-placement turnaround); solid renter incomes; 13,259 units permitted in Montgomery County in 2024 (1,402 in 5+ unit buildings).
Forward outlook
- Local home prices are declining (-3.0%/yr); year-one equity from $898 of loan paydown is wiped out by about $4k of value loss. Plan a longer hold.
- Montgomery County population projected at +65% by 2050 — long-run rental-demand tailwind backs the buy-and-hold thesis.
- At projected returns (-3.0% appreciation + 0.0% rent growth), your $36k cash investment doubles in ~6 years — after that, you're playing with house money.
Negotiation context
- It's been on market 32 days — a 3% lower offer ($126k) is reasonable based on typical stale-listing flexibility.
Risks & watch-outs
- Climate carrying-cost: severe wind risk, 99% chance of damaging wind over 30y; extreme-heat days projected 7→23/yr by 2055 (HVAC capex compounding) — expect insurance premiums to compound above CPI over the hold.
Questions for the listing agent
- It's been on market 32 days. Have you received any prior offers? Is the seller open to a 3% concession, seller financing, or rate buy-down credit?
- What does the HOA fee cover, when was the last increase, and are there any pending special assessments or reserve-fund shortfalls?
- Is there a deadline driving the sale (1031 exchange, divorce, estate, relocation)? That informs how much negotiation room exists.
- Schools are D-rated, which usually means shorter tenancies and higher turnover. Who's the typical renter profile here, and what's been the actual vacancy rate?
- What's the average days-on-market for RENTAL listings here right now (not sales)? A rising rental-DOM trend means longer vacancies and softer asking-rent achievability than the comps imply.
- What's the recent tenant-quality profile in this submarket — average credit score on applications, eviction rate, late-payment / NSF rate, and stable-employment percentage? A property-management company in the area should have these aggregated.
- How much new for-sale + rental construction is in the pipeline within 1–3 miles? Heavy new supply typically softens prices + rents 12–24 months out; constrained supply supports both.
Investment metrics
- 1% rule
- 1.66% ✓
- Cap rate
- 13.42%
- Cash-on-cash
- 25.44%
- DSCR
- 2.13
- GRM
- 5.0
CMA / ARV
No comps found within radius.
Projected returns pro-forma
-3.0% appreciation · 0.0% rent growth · sell at horizon
- IRR
- 15.5%
- Equity multiple
- 1.60×
- Total profit
- $21,781
- Equity at exit
- $19,369
- IRR
- 21.8%
- Equity multiple
- 2.59×
- Total profit
- $57,944
- Equity at exit
- $11,231
Cash invested: $36,372 (down + closing). Projections, not guarantees.
Landlord ↔ Tenant lean methodology
- Overall (STATE)
- 87 Strongly Landlord-Friendly
- State Texas
- 87 Strongly Landlord-Friendly · R+5
- County
- — inherits STATE
- City
- — inherits STATE
ZIP-level market 77318
- Home prices YoY
- -32.7%
- Rents YoY
- -2.1%
- Active inventory
- 1189
- Price-to-rent
- 5.0×
Monthly cashflow live
- Estimated rent
- $2,162 medium interval (Pro) →
- Mortgage (P&I)
- −$681
- Tax from tax record
- −$137 /mo · $1,643/yr
- Insurance
- −$54
- HOA
- −$65
- Vacancy / Maint / Mgmt
- −$454
- Net cashflow
- $771
Break-even live
UW: 25.0% down · 7.5% · 30yr · 1.5% tax · 5.0% vac · 8.0% maint · 8.0% mgmt
Financing live
Cash to close
- Down payment
- $32,475
- Closing costs
- $3,897
- Reserves months
- —
- Total cash needed
- —
Loan-product check · same deal, 3 products live
Conventional
25% down · 7.5% · 30yr
- Down + closing
- —
- Monthly P&I
- —
- Monthly cashflow
- —
- DSCR
- —
- Eligible?
- —
Personal DTI + credit; lowest rate.
DSCR
20% down · 8.5% · 30yr
- Down + closing
- —
- Monthly P&I
- —
- Monthly cashflow
- —
- DSCR
- —
- Eligible?
- —
No personal income docs; deal must DSCR.
Hard money
10% down · 12.0% · 12mo
- Down + closing
- —
- Monthly P&I
- —
- Monthly cashflow
- —
- DSCR
- —
- Eligible?
- —
Short-term bridge; refi at stabilization.
Rent comps 4 comps
| Address | Beds | Baths | Sqft | Rent | $/sqft | DOM | Units | Dist |
|---|---|---|---|---|---|---|---|---|
| 14156 Shadow Bay Dr Willis, TX | 3.0 | 2.0 | 1432 | $2,195 | $1.53 | 1d | 1 | 0.22mi |
| 14214 Green Wing Cir Willis, TX | 3.0 | 2.0 | 1200 | $1,950 | $1.62 | 43d | 1 | 0.97mi |
| 14210 Green Wing Cir Willis, TX | 4.0 | 2.0 | 1603 | $1,850 | $1.15 | 4d | 1 | 0.97mi |
| 14190 Green Wing Cir Willis, TX | 3.0 | 2.0 | 1402 | $1,795 | $1.28 | 4d | 1 | 0.98mi |
HOA detail
- Monthly dues
- $65 · $780/yr
Listing history 14 events
-
2026-06-18days on market $129,900 Active 32 DOM
-
2026-06-17days on market $129,900 Active 31 DOM
-
2026-06-16days on market $129,900 Active 30 DOM
-
2026-06-15days on market $129,900 Active 29 DOM
-
2026-06-13days on market $129,900 Active 27 DOM
-
2026-06-09days on market $129,900 Active 23 DOM
-
2026-06-08days on market $129,900 Active 22 DOM
-
2026-06-07days on market $129,900 Active 21 DOM
-
2026-06-04days on market $129,900 Active 18 DOM
-
2026-06-03days on market $129,900 Active 17 DOM
-
2026-06-02days on market $129,900 Active 16 DOM
-
2026-06-01days on market $129,900 Active 15 DOM
-
2026-05-31days on market $129,900 Active 14 DOM
-
2026-05-17$129,900 Active
ⓘ Source: listings_history table (triggers on properties + properties_extension) + one-shot
backfill from property_details.listing_events for pre-trigger history.
Tax reassessment forecast TX · Resets to sale price
- Current annual tax
- $1,643 · $137/mo
- Projected year-2 tax
- $2,377 · $198/mo
- Expected delta
- +$734/yr (+$61/mo · 44.7%)
ⓘ Screening estimate from a state-policy table — verify with the county assessor before closing.
Climate risk First Street
- Flood 1/10 Low FEMA zone X (unshaded) · 0% chance over 30 yrs
- Wildfire 3/10 Moderate
- Heat 8/10 Severe 7 d/yr ≥111°F today · 23 d/yr by 30 yrs out
- Wind 8/10 Severe 99% chance of damaging wind over 30 yrs
- Air quality 2/10 Low 1 unhealthy d/yr today · 1 by 30 yrs out
Nearby sold comps map
Loading sold comps map…
Walkable amenities ~0.75 mi
Loading nearby amenities…
Taxation est. · year 1
- Rental income
- $25,950
- − Mortgage interest
- −$7,276
- − Property taxes
- −$1,643
- − Insurance
- −$650
- − Repairs & maintenance
- −$2,076
- − Management
- −$2,076
- − HOA
- −$780
- − Depreciation
- −$3,779
- Taxable income
- $7,670
- Est. tax owed @ 24.0%
- −$1,841
- After-tax cash flow
- $7,412/yr
For passive investors: Depreciation is non-cash, so a rental often shows a tax loss while cash-flowing — sheltering income. Rental losses are passive: they offset passive income freely, and up to $25,000/yr can offset ordinary (W-2) income if you actively participate and your MAGI is under $100k (phasing out to $0 by $150k); unused losses carry forward. On sale, claimed depreciation is recaptured at up to 25%, and gains may owe capital-gains tax (a 1031 exchange can defer both). Figures are a year-1 estimate at your 24.0% rate — not tax advice; consult a CPA.
Schools (NCES district)
- District
- Willis ISD
- NCES district ID
- 4845900
- Math proficiency
- 33% ▼ -15.00%
- Reading proficiency
- 40% ▼ -2.00%
- Median HH income
- $57,828
- Composite
- 32.32/100
- National rank
- #5746
- State rank
- #458 of 826 in TX
Livability — Conroe
- Score
- 74/100
- State rank
- #169
- US rank
- #4447
Category grades
Schools grade is shown separately in the Schools card above.
Census & demographics
- County
- Montgomery County · 663,713 people
- City population
- 205,417
- Metro
- Houston-The Woodlands-Sugar Land, TX
- Population (ZIP)
- 20,792
- Household income
- $92,415
- Rent vs Own
- Severe rent burden
- 279.0
Population outlook (Montgomery County) Hauer SSP2
- Today (2025)
- 713,896 people
- By 2030
- 805,263 · +12.8%
- By 2040
- 992,708 · +39.1%
- By 2050
- 1,179,590 · +65.2%
- By 2075
- 1,628,084 · +128.1%
- By 2100
- 1,937,880 · +171.5%
Race, ethnicity, and origin ACS 2023
- Neighborhood character
- Predominantly White (72%)
- Race & ethnicity
- White 72% Hispanic / Latino 17% Two or more races 14% Black 3%
- Hispanic origin (detail)
- Mexican 12%
- Common ancestry
- Lithuanian 4% Slovak 2% Serbian 2%
- Foreign-born
- 6% · Canada, Jamaica
- Languages at home
- 88% English-only · Spanish 10%
Political lean MEDSL · Montgomery
- 2024 margin
- Solid R (+45.5) · D 26.8% · R 72.3%
- 2008→2024 swing
- +7.2pp toward D · 2008: -52.7pp · 2024: -45.5pp
- All cycles
- 2024: R+45.5 2020: R+43.8 2016: R+51.4 2012: R+60.7 2008: R+52.7
Not yet ingested
- Civics
- —
Market trends
- HPI YoY
- ▼ -114.58%
- Current HPI
- 236.256
- Rent YoY
- ▼ -2.09%
- Metro
- Houston-The Woodlands-Sugar Land, TX
- State GDP YoY
- ▲ 3.95%
- F500 in state
- 110
Industry mix (Fortune 500 HQ in TX)
| Industry | F500 HQs | Revenue |
|---|---|---|
| Energy | 16 | $1,198B |
|
||
| Technology | 5 | $198B |
|
||
| Engineering / Construction | 4 | $72B |
|
||
| Energy Services | 3 | $60B |
|
||
| Utilities | 3 | $41B |
|
||
| Healthcare | 2 | $330B |
|
||
Price history
1 event — show timeline
- 2026-05-17 Listed $129,900 HARMLS
Property tax history
+2.6%/yrLatest (2025): $1,643 · -7.2% YoY. Source: county tax records.
Cash-flow waterfall
monthlySold comps — $/sqft
last 12 mo · ≤1 miLoading sold comps…