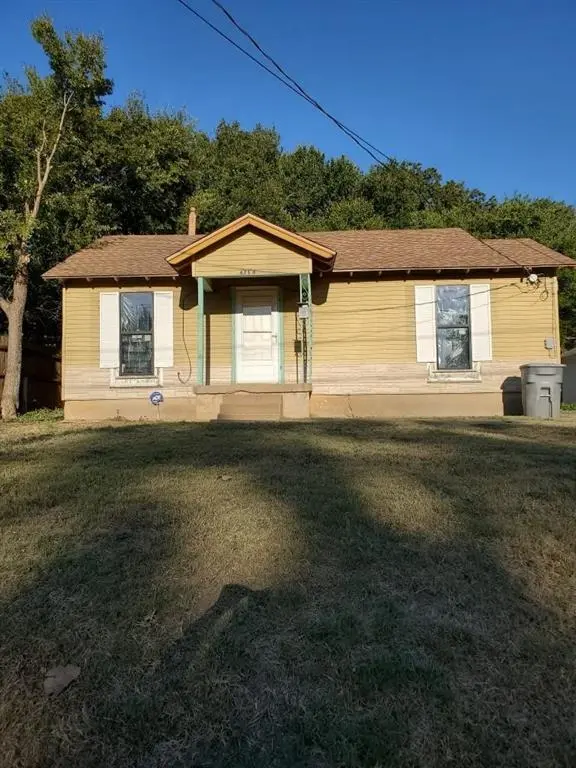
4714 Kildare Ave · Dallas, TX
Flood risk 1/10 · Minimal
- FEMA flood zone
- X (unshaded)
- Chance of flooding over 30 yrs
- 0.0%
- Est. flood insurance / yr
- $507 – $1,088
Fire risk 1/10 · Minimal
- Est. fire insurance / yr
- $1,222 – $2,270
Heat risk 7/10 · Major
- Hot days now (above 110°F)
- 7 days/yr
- Hot days in 30 yrs
- 23 days/yr
Wind risk 6/10 · Moderate
- Chance of severe wind over 30 yrs
- 27.0%
Air-quality risk 2/10 · Minimal
- Unhealthy air days now
- 1 days/yr
- Unhealthy air days in 30 yrs
- 2 days/yr
Risk factors via First Street. Map © Google.
Why this score? — see what drove the C grade
The composite is a weighted blend of 9 inputs, each scored 0–100. Each bar is that input's sub-score; the figure is the points it added to the 100-point composite (weight × sub-score).
- Cash flow +18.2/30.0
- ARV discount +15.0/15.0
- 1% rule +6.3/10.0
- DSCR +5.7/10.0
- Livability +4.0/5.0
- Rent growth +3.6/5.0
- Schools +2.8/10.0
- Condition / age +2.5/5.0
- Appreciation +0.0/10.0
$165,000
🖨 Deal sheet 📄 Offer letter ✓ Due diligence
Listing remarks MLS
Updated family home in a great neighborhood looking for a its next owner! 3 bedrooms and 2 bathrooms in a split style with gorgeous updated kitchen and bathrooms. New paint, laminate flooring, and carpet in bathrooms with a tasteful neutral paint job. Home is in the heart of Dallas close to restaurants, shops, and great schools! This property is easy to show with 24 hours notice. Will not last long!
Key facts
- Close to restaurants
- Close to shops
- Updated kitchen
Tags
Neighborhood map
What this means for you Summary
Snapshot
- This is a 3-bed/2.0-bath single-family listed at $165k.
Deal economics
- At list price, monthly cash flow is $147 ($2k/yr) — positive.
- The deal already cash-flows at list — no discount required.
- Meets the 1% rule at list price ($2k rent vs $165k).
- Recommended offer: $155k (6.0% below list) — sets the bar for market timing.
- Cap rate 7.4% vs local median 2.3% in Dallas — top-decile yield for the area; either an underpriced asset or a hidden risk that comps aren't pricing in. Stress-test before assuming the spread holds.
Location & tenants
- Location reads 81/100 on livability (#24 in TX, #1,380 nationally) — a professional / high-income tenant draw. Strengths: amenities A+, commute A+, housing A+; Watch: schools C-, crime F.
- Dallas ISD (urban): math 31% / reading 36% proficiency, ranked #559 of 826 in TX (top 68%) — families likely to look elsewhere, expect single-tenant / working-renter base with shorter leases; 83% free/reduced lunch — lower-income household profile, screen leases tightly.
- Market conditions: Rents rising fast (+4.2%/yr); 249 active listings in the ZIP; 26 comparable units currently listed for rent nearby; rentals leasing fast (median 7d on market — plan ~1-2 weeks tenant-placement turnaround); lower-income renter base — watch delinquency; 12,577 units permitted in Dallas County in 2024 (6,829 in 5+ unit buildings).
- At $1,858/mo this rent would consume 54% of the median local household income ($41k/yr) (locally 2465% of renters already pay >50% of income on rent) — very limited rent-growth headroom before tenants either downsize or default.
Forward outlook
- Local home prices are declining (-3.0%/yr); year-one equity from $1k of loan paydown is wiped out by about $5k of value loss. Plan a longer hold.
- Dallas County population projected at +35% by 2050 — long-run rental-demand tailwind backs the buy-and-hold thesis.
Negotiation context
- It's been on market 68 days — a 6% lower offer ($155k) is reasonable based on typical stale-listing flexibility.
- 3 sale attempts since 3y ago; this cycle's ask has dropped $15k (8%) from the opening price — seller is motivated, your offer sets the floor, not the list.
Risks & watch-outs
- Watch-outs: property tax is 2.8% of price; built in 1948 — expect roof / HVAC / electrical / plumbing capex.
- Climate carrying-cost: major wind risk, 27% chance of damaging wind over 30y; extreme-heat days projected 7→23/yr by 2055 (HVAC capex compounding) — expect insurance premiums to compound above CPI over the hold.
Questions for the listing agent
- It's been on market 68 days. Have you received any prior offers? Is the seller open to a 6% concession, seller financing, or rate buy-down credit?
- Built in 1948 — when were the roof, HVAC, electrical panel, plumbing, and water heater last replaced?
- Property tax is high relative to price — has the assessment been appealed recently, and will the sale trigger a re-assessment?
- Why hasn't it sold? Are there any deal-killer items the seller is aware of (foundation, flood, title, zoning, code violations)?
- Is there a deadline driving the sale (1031 exchange, divorce, estate, relocation)? That informs how much negotiation room exists.
- Crime grade is F in this area — have there been break-ins, vandalism, or insurance claims at this property in the last 3 years? What carrier currently insures it and at what premium?
- What's the average days-on-market for RENTAL listings here right now (not sales)? A rising rental-DOM trend means longer vacancies and softer asking-rent achievability than the comps imply.
- What's the recent tenant-quality profile in this submarket — average credit score on applications, eviction rate, late-payment / NSF rate, and stable-employment percentage? A property-management company in the area should have these aggregated.
- How much new for-sale + rental construction is in the pipeline within 1–3 miles? Heavy new supply typically softens prices + rents 12–24 months out; constrained supply supports both.
Investment metrics
- 1% rule
- 1.13% ✓
- Cap rate
- 7.36%
- Cash-on-cash
- 3.81%
- DSCR
- 1.17
- GRM
- 7.4
CMA / ARV
- ARV (median comp)
- $210,219
- List price
- $165,000
- Delta
- -21.51%
- Verdict
- UNDERPRICED
- Comps
- 20 within 1.0 mi
Show comp detail 12 sales within ~0.75 mi
| Address | Dist | Beds/Ba | Sqft | Sold | Price | $/sf | Match |
|---|---|---|---|---|---|---|---|
| 1606 Mentor Ave | 0.34mi | 3/2.0 | 1,226 (-1%) | 1mo | $190,000 | $155 | 82 |
| 1833 Atlas Dr | 0.05mi | 3/2.0 | 1,380 (+11%) | 5mo | $314,900 | $228 | 74 |
| 4726 Bartlett Ave | 0.07mi | 3/2.0 | 1,131 (-9%) | 9mo | $230,000 | $203 | 74 |
| 1434 Owega Ave | 0.45mi | 3/2.0 | 1,230 (-1%) | 5mo | $225,000 | $183 | 74 |
| 1727 Mentor Ave | 0.23mi | 3/1.0 | 1,138 (-8%) | 5mo | $119,900 | $105 | 67 |
| 5122 Patonia Ave | 0.44mi | 2/1.0 (-1) | 1,211 (-2%) | 2mo | $180,000 | $149 | 65 |
| 2365 Clover Ridge Dr | 0.61mi | 3/1.5 | 1,212 (-2%) | 4mo | $194,500 | $160 | 63 |
| 2309 52nd St | 0.46mi | 4/2.0 (+1) | 1,332 (+7%) | 2mo | $239,000 | $179 | 59 |
| 2306 Clover Ridge Dr | 0.52mi | 3/2.0 | 1,359 (+10%) | 4mo | $224,999 | $166 | 56 |
| 1204 Adelaide Dr | 0.73mi | 3/1.5 | 1,207 (-3%) | 4mo | $160,000 | $133 | 56 |
| 1406 Mentor Ave | 0.55mi | 4/2.0 (+1) | 1,360 (+10%) | 8mo | $274,500 | $202 | 47 |
| 4550 Malden Ln | 0.72mi | 3/1.0 | 1,160 (-6%) | 9mo | $155,000 | $134 | 44 |
Match score weights: distance 35% · size 25% · config 20% · recency 20%. Top-matched comps best support the ARV.
Projected returns pro-forma
-3.0% appreciation · 4.2% rent growth · sell at horizon
- IRR
- -8.7%
- Equity multiple
- 0.68×
- Total profit
- $-14,992
- Equity at exit
- $24,602
- IRR
- 2.6%
- Equity multiple
- 1.20×
- Total profit
- $9,078
- Equity at exit
- $14,266
Cash invested: $46,200 (down + closing). Projections, not guarantees.
Landlord ↔ Tenant lean methodology
- Overall (STATE)
- 87 Strongly Landlord-Friendly
- State Texas
- 87 Strongly Landlord-Friendly · R+5
- County
- — inherits STATE
- City
- — inherits STATE
ZIP-level market 75216
- Home prices YoY
- -29.7%
- Rents YoY
- 4.2%
- Active inventory
- 249
- Price-to-rent
- 7.4×
Monthly cashflow live
- Estimated rent
- $1,858 high interval (Pro) →
- Mortgage (P&I)
- −$865
- Tax from tax record
- −$387 /mo · $4,647/yr
- Insurance
- −$69
- HOA
- −$0
- Vacancy / Maint / Mgmt
- −$390
- Net cashflow
- $147
Break-even live
UW: 25.0% down · 7.5% · 30yr · 1.5% tax · 5.0% vac · 8.0% maint · 8.0% mgmt
Financing live
Cash to close
- Down payment
- $41,250
- Closing costs
- $4,950
- Reserves months
- —
- Total cash needed
- —
Loan-product check · same deal, 3 products live
Conventional
25% down · 7.5% · 30yr
- Down + closing
- —
- Monthly P&I
- —
- Monthly cashflow
- —
- DSCR
- —
- Eligible?
- —
Personal DTI + credit; lowest rate.
DSCR
20% down · 8.5% · 30yr
- Down + closing
- —
- Monthly P&I
- —
- Monthly cashflow
- —
- DSCR
- —
- Eligible?
- —
No personal income docs; deal must DSCR.
Hard money
10% down · 12.0% · 12mo
- Down + closing
- —
- Monthly P&I
- —
- Monthly cashflow
- —
- DSCR
- —
- Eligible?
- —
Short-term bridge; refi at stabilization.
Rent comps 26 comps
| Address | Beds | Baths | Sqft | Rent | $/sqft | DOM | Units | Dist |
|---|---|---|---|---|---|---|---|---|
| 4417 S Lancaster Rd Dallas, TX | 2.0 | 1.0–2.0 | 874 | $1,595 | $1.82 | 2d | 1 | 0.28mi |
| 4934 Kildare Ave Dallas, TX | 3.0 | 2.0 | 1118 | $1,595 | $1.43 | 24d | 1 | 0.30mi |
| 3930 S Denley Dr Dallas, TX | 3.0 | 2.0 | 1135 | $1,900 | $1.67 | 7d | 1 | 0.66mi |
| 1214 Adelaide Dr Dallas, TX | 3.0 | 1.0 | 1200 | $1,875 | $1.56 | 1d | 1 | 0.73mi |
| 1214 Adelaide Dr Dallas, TX | 3.0 | 1.0 | 1040 | $2,350 | $2.26 | 7d | 1 | 0.73mi |
| 1618 Marfa Ave Dallas, TX | 3.0 | 2.0 | 1100 | $1,900 | $1.73 | 43d | 1 | 0.85mi |
| 1334 Marfa Ave Dallas, TX | 3.0 | 2.0 | 1100 | $1,475 | $1.34 | 43d | 1 | 0.88mi |
| 5722 Old Ox Rd Dallas, TX | 3.0 | 2.0 | 1464 | $2,200 | $1.50 | 7d | 1 | 0.90mi |
| 1435 Whispering Trl Dallas, TX | 3.0 | 1.0 | 1047 | $1,660 | $1.59 | 7d | 1 | 0.95mi |
| 5828 Lazy River Dr Dallas, TX | 3.0 | 1.5 | 1134 | $1,600 | $1.41 | 44d | 1 | 0.97mi |
| 1706 Caravan Trl Dallas, TX | 3.0 | 2.0 | 1263 | $1,700 | $1.35 | 24d | 1 | 1.01mi |
| 1754 E Red Bird Ln Dallas, TX | 3.0 | 1.5 | 1115 | $1,675 | $1.50 | 7d | 1 | 1.06mi |
| 2751 E Ledbetter Dr Dallas, TX | 1.0–3.0 | 1.0–1.5 | 794 | $1,410 | $1.78 | 43d | 3 | 1.12mi |
| 4306 Landrum Ave Dallas, TX | 3.0 | 2.0 | 1226 | $1,695 | $1.38 | 1d | 1 | 1.18mi |
| 4306 Landrum Ave Dallas, TX | 3.0 | 2.0 | 1226 | $1,695 | $1.38 | 6d | 1 | 1.18mi |
| 4117 S Marsalis Ave Dallas, TX | 3.0 | 2.0 | 1296 | $2,200 | $1.70 | 7d | 1 | 1.19mi |
| 3608 S Marsalis Ave Dallas, TX | 2.0 | 1.0 | 907 | $1,400 | $1.54 | 43d | 1 | 1.30mi |
| 5160 Cardiff St Dallas, TX | 4.0 | 2.0 | 1251 | $1,950 | $1.56 | 3d | 1 | 1.37mi |
| 2602 Ripple Rd Dallas, TX | 3.0 | 2.0 | 1232 | $1,700 | $1.38 | 43d | 1 | 1.37mi |
| 2520 Fatima Ave Dallas, TX | 3.0 | 2.0 | 1176 | $1,950 | $1.66 | 7d | 1 | 1.37mi |
| 4836 Sunnyvale St Dallas, TX | 1.0–3.0 | 1.0–2.0 | 515 | $1,512 | $2.94 | 43d | 7 | 1.39mi |
| 5175 Cardiff St Dallas, TX | 3.0 | 1.0 | 1248 | $1,650 | $1.32 | 43d | 1 | 1.40mi |
| 2503 Stovall Dr Dallas, TX | 2.0 | 2.0 | 768 | $2,300 | $2.99 | 43d | 1 | 1.43mi |
| 2703 Kool Ave Dallas, TX | 3.0 | 2.0 | 1248 | $1,700 | $1.36 | 24d | 1 | 1.43mi |
| 3015 E Ledbetter Dr Dallas, TX | 2.0–3.0 | 2.0 | 1030 | $1,475 | $1.43 | 3d | 1 | 1.48mi |
| 2538 Stovall Dr Dallas, TX | 3.0 | 1.0 | 986 | $1,625 | $1.65 | 5d | 1 | 1.49mi |
Listing history 5 events
-
2026-04-23price $165,000 402-char remark
Show marketing remark (402 chars)
Updated family home in a great neighborhood looking for a its next owner! 3 bedrooms and 2 bathrooms in a split style with gorgeous updated kitchen and bathrooms. New paint, laminate flooring, and carpet in bathrooms with a tasteful neutral paint job. Home is in the heart of Dallas close to restaurants, shops, and great schools! This property is easy to show with 24 hours notice. Will not last long!
-
2026-03-18$179,900 Active 402-char remark
Show marketing remark (402 chars)
Updated family home in a great neighborhood looking for a its next owner! 3 bedrooms and 2 bathrooms in a split style with gorgeous updated kitchen and bathrooms. New paint, laminate flooring, and carpet in bathrooms with a tasteful neutral paint job. Home is in the heart of Dallas close to restaurants, shops, and great schools! This property is easy to show with 24 hours notice. Will not last long!
-
2025-09-11$179,900 Active
-
2023-11-07$225,000 Active
-
1986-01-01soldstatus
ⓘ Source: listings_history table (triggers on properties + properties_extension) + one-shot
backfill from property_details.listing_events for pre-trigger history.
Tax reassessment forecast TX · Resets to sale price
- Current annual tax
- $4,647 · $387/mo
- Projected year-2 tax
- $4,647 · $387/mo
- Expected delta
- $0/yr ($0/mo · 0.0%)
ⓘ Screening estimate from a state-policy table — verify with the county assessor before closing.
Climate risk First Street
- Flood 1/10 Low FEMA zone X (unshaded) · 0% chance over 30 yrs
- Wildfire 1/10 Low
- Heat 7/10 Severe 7 d/yr ≥110°F today · 23 d/yr by 30 yrs out
- Wind 6/10 Major 27% chance of damaging wind over 30 yrs
- Air quality 2/10 Low 1 unhealthy d/yr today · 2 by 30 yrs out
Nearby sold comps map
Loading sold comps map…
Walkable amenities ~0.75 mi
Loading nearby amenities…
Taxation est. · year 1
- Rental income
- $22,296
- − Mortgage interest
- −$9,243
- − Property taxes
- −$4,647
- − Insurance
- −$825
- − Repairs & maintenance
- −$1,784
- − Management
- −$1,784
- − Depreciation
- −$4,800
- Taxable loss
- −$785
- Est. tax savings @ 24.0%
- +$189
- After-tax cash flow
- $1,947/yr
For passive investors: Depreciation is non-cash, so a rental often shows a tax loss while cash-flowing — sheltering income. Rental losses are passive: they offset passive income freely, and up to $25,000/yr can offset ordinary (W-2) income if you actively participate and your MAGI is under $100k (phasing out to $0 by $150k); unused losses carry forward. On sale, claimed depreciation is recaptured at up to 25%, and gains may owe capital-gains tax (a 1031 exchange can defer both). Figures are a year-1 estimate at your 24.0% rate — not tax advice; consult a CPA.
Schools (NCES district)
- District
- Dallas ISD
- NCES district ID
- 4816230
- Math proficiency
- 31% ▼ -16.00%
- Reading proficiency
- 36% ▼ -4.00%
- Median HH income
- $42,881
- Composite
- 28.41/100
- National rank
- #6763
- State rank
- #559 of 826 in TX
Livability — Dallas
- Score
- 81/100
- State rank
- #24
- US rank
- #1380
Category grades
Schools grade is shown separately in the Schools card above.
Census & demographics
- Census place
- Dallas, TX
- County
- Dallas County · 2,612,404 people
- City population
- 1,168,437
- Metro
- Dallas-Fort Worth-Arlington, TX
- Population (ZIP)
- 55,894
- Household income
- $41,386
- Rent vs Own
- Severe rent burden
- 2465.0
Population outlook (Dallas County) Hauer SSP2
- Today (2025)
- 2,979,839 people
- By 2030
- 3,191,823 · +7.1%
- By 2040
- 3,619,611 · +21.5%
- By 2050
- 4,026,915 · +35.1%
- By 2075
- 4,957,073 · +66.4%
- By 2100
- 5,508,725 · +84.9%
Race, ethnicity, and origin ACS 2023
- Neighborhood character
- Majority Black (51%)
- Race & ethnicity
- Black 51% Hispanic / Latino 44% Two or more races 14% White 3%
- Hispanic origin (detail)
- Mexican 40%
- Common ancestry
- Hispanic 1%
- Foreign-born
- 17% · Canada
- Languages at home
- 62% English-only · Spanish 37%
Political lean MEDSL · Dallas
- 2024 margin
- Strong D (+22.2) · D 60.2% · R 38.0% · Other 1.8%
- 2008→2024 swing
- +6.9pp toward D · 2008: 15.3pp · 2024: 22.2pp
- All cycles
- 2024: D+22.2 2020: D+31.6 2016: D+26.2 2012: D+15.4 2008: D+15.3
Not yet ingested
- Civics
- —
Market trends
- HPI YoY
- ▼ -126.35%
- Current HPI
- 299.1825
- Rent YoY
- ▲ 4.20%
- Metro
- Dallas-Fort Worth-Arlington, TX
- State GDP YoY
- ▲ 3.95%
- F500 in state
- 110
Industry mix (Fortune 500 HQ in TX)
| Industry | F500 HQs | Revenue |
|---|---|---|
| Energy | 16 | $1,198B |
|
||
| Technology | 5 | $198B |
|
||
| Engineering / Construction | 4 | $72B |
|
||
| Energy Services | 3 | $60B |
|
||
| Utilities | 3 | $41B |
|
||
| Healthcare | 2 | $330B |
|
||
Price history
-26.7% since first listed5 events — show timeline
- 2026-04-23 Price Changed $165,000 NTREIS
- 2026-03-18 Listed $179,900 NTREIS
- 2025-09-11 Listed $179,900 NTREIS
- 2023-11-07 Listed $225,000 NTREIS
- 1986-01-01 Sold (Public Records) — Public Records
Property tax history
+9.8%/yrLatest (2025): $4,647 · -0.4% YoY. Source: county tax records.
Cash-flow waterfall
monthlySold comps — $/sqft
last 12 mo · ≤1 miLoading sold comps…