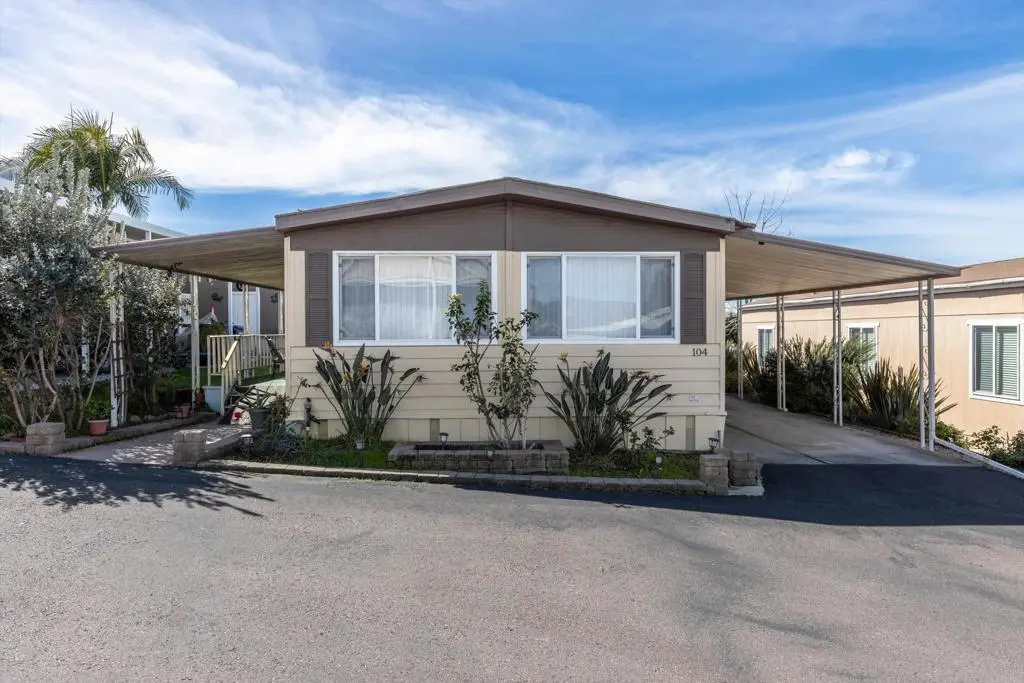
718 Sycamore #104 · Vista, CA
Flood risk 1/10 · Minimal
- FEMA flood zone
- X (unshaded)
- Chance of flooding over 30 yrs
- 0.0%
- Est. flood insurance / yr
- $507 – $1,088
Fire risk 2/10 · Minimal
- Est. fire insurance / yr
- $659 – $1,223
Heat risk 4/10 · Minor
- Hot days now (above 91°F)
- 7 days/yr
- Hot days in 30 yrs
- 21 days/yr
Wind risk 1/10 · Minimal
- Chance of severe wind over 30 yrs
- —
Air-quality risk 3/10 · Minor
- Unhealthy air days now
- 4 days/yr
- Unhealthy air days in 30 yrs
- 4 days/yr
Risk factors via First Street. Map © Google.
Why this score? — see what drove the B grade
The composite is a weighted blend of 9 inputs, each scored 0–100. Each bar is that input's sub-score; the figure is the points it added to the 100-point composite (weight × sub-score).
- Cash flow +30.0/30.0
- 1% rule +10.0/10.0
- DSCR +10.0/10.0
- ARV discount +7.2/15.0
- Schools +5.4/10.0
- Rent growth +3.4/5.0
- Livability +3.0/5.0
- Condition / age +2.5/5.0
- Appreciation +0.0/10.0
$139,000
🖨 Deal sheet (PDF) 📄 Offer letter ✓ Due diligence
Key facts
- 1,900 sq ft lot
- 2 garage spots
- Community pool
Neighborhood map
What this means for you Summary
Snapshot
- This is a 2-bed/2.0-bath manufactured listed at $139k.
Deal economics
- At list price, monthly cash flow is $1k ($17k/yr) — positive.
- The deal already cash-flows at list — no discount required.
- Meets the 1% rule at list price ($3k rent vs $139k).
- Recommended offer: $131k (6.0% below list) — sets the bar for market timing.
- Cap rate 18.3% vs local median 2.4% in Vista — top-decile yield for the area; either an underpriced asset or a hidden risk that comps aren't pricing in. Stress-test before assuming the spread holds.
Location & tenants
- Location reads 60/100 on livability (#584 in CA) — a middle-class / working-renter tenant base. Strengths: commute A+, employment A-; Watch: schools F, amenities F, cost of living F.
- San Marcos Unified (suburban): math 52% / reading 67% proficiency, ranked #249 of 1,400 in CA (top 18%) — acceptable for families but not a draw, mixed tenant base, ~2y average lease.
- Market conditions: Rents rising (+3.4%/yr); 74 active listings in the ZIP; 18 comparable units currently listed for rent nearby; rentals leasing fast (median 13d on market — plan ~1-2 weeks tenant-placement turnaround); solid renter incomes; 11,759 units permitted in San Diego County in 2024 (7,244 in 5+ unit buildings).
- This rent runs 41% of the median local income ($87k/yr) — at the standard rent-burdened threshold; future hikes will face affordability resistance.
Forward outlook
- Local home prices are declining (-3.0%/yr); year-one equity from $961 of loan paydown is wiped out by about $4k of value loss. Plan a longer hold.
- San Diego County population projected at +20% by 2050 — long-run rental-demand tailwind backs the buy-and-hold thesis.
- At projected returns (-3.0% appreciation + 3.4% rent growth), your $39k cash investment doubles in ~3 years — after that, you're playing with house money.
Negotiation context
- It's been on market 88 days — a 6% lower offer ($131k) is reasonable based on typical stale-listing flexibility.
- 3 sale attempts since 16y ago; this cycle's ask is 8% above the opening price — seller raised mid-cycle; expect resistance to lowballs.
Questions for the listing agent
- It's been on market 88 days. Have you received any prior offers? Is the seller open to a 6% concession, seller financing, or rate buy-down credit?
- Built in 1972 — when were the roof, HVAC, electrical panel, plumbing, and water heater last replaced?
- Why hasn't it sold? Are there any deal-killer items the seller is aware of (foundation, flood, title, zoning, code violations)?
- Is there a deadline driving the sale (1031 exchange, divorce, estate, relocation)? That informs how much negotiation room exists.
- Schools are F-rated, which usually means shorter tenancies and higher turnover. Who's the typical renter profile here, and what's been the actual vacancy rate?
- What's the average days-on-market for RENTAL listings here right now (not sales)? A rising rental-DOM trend means longer vacancies and softer asking-rent achievability than the comps imply.
- What's the recent tenant-quality profile in this submarket — average credit score on applications, eviction rate, late-payment / NSF rate, and stable-employment percentage? A property-management company in the area should have these aggregated.
- How much new for-sale + rental construction is in the pipeline within 1–3 miles? Heavy new supply typically softens prices + rents 12–24 months out; constrained supply supports both.
Investment metrics
- 1% rule
- 2.14% ✓
- Cap rate
- 18.33%
- Cash-on-cash
- 42.98%
- DSCR
- 2.91
- GRM
- 3.9
CMA / ARV
- ARV (median comp)
- $137,929
- List price
- $139,000
- Delta
- 0.78%
- Verdict
- FAIR
- Comps
- 5 within 1.0 mi
Show comp detail 5 sales within ~0.75 mi
| Address | Dist | Beds/Ba | Sqft | Sold | Price | $/sf | Match |
|---|---|---|---|---|---|---|---|
| 718 Sycamore Ave #134 | 0.00mi | 2/2.0 | 1,120 (-2%) | 6mo | $140,000 | $125 | 92 |
| 718 Sycamore #22 | 0.07mi | 2/2.5 | 1,116 (-2%) | 20mo | $250,000 | $224 | 74 |
| 718 Sycamore Ave #100 | 0.00mi | 3/2.0 (+1) | 1,173 (+3%) | 20mo | $282,000 | $240 | 73 |
| 718 Sycamore Ave #145 | 0.00mi | 2/2.0 | 1,040 (-9%) | 16mo | $190,000 | $183 | 72 |
| 718 Sycamore Ave Ave #157 | 0.11mi | 2/2.0 | 1,260 (+10%) | 15mo | $195,000 | $155 | 65 |
Match score weights: distance 35% · size 25% · config 20% · recency 20%. Top-matched comps best support the ARV.
Projected returns pro-forma
-3.0% appreciation · 3.44% rent growth · sell at horizon
- IRR
- 40.3%
- Equity multiple
- 2.74×
- Total profit
- $67,620
- Equity at exit
- $20,725
- IRR
- 46.8%
- Equity multiple
- 5.60×
- Total profit
- $178,862
- Equity at exit
- $12,018
Cash invested: $38,920 (down + closing). Projections, not guarantees.
Landlord ↔ Tenant lean methodology
- Overall (STATE)
- 18 Strongly Tenant-Friendly
- State California
- 18 Strongly Tenant-Friendly · D+13
- County
- — inherits STATE
- City
- — inherits STATE
ZIP-level market 92083
- Rents YoY
- 3.4%
- Active inventory
- 74
- Price-to-rent
- 3.9×
Monthly cashflow live
- Estimated rent
- $2,980 high interval (Pro) →
- Mortgage (P&I)
- −$729
- Tax est. 1.5%
- −$174 /mo · $2,085/yr
- Insurance
- −$58
- HOA
- −$0
- Vacancy / Maint / Mgmt
- −$626
- Net cashflow
- $1,394
Break-even live
Sensitivity live
| Price | -10% $1,490 | -5% $1,442 | +0% $1,394 | +5% $1,346 | +10% $1,298 |
|---|---|---|---|---|---|
| Rent | -10% $1,158 | -5% $1,276 | +0% $1,394 | +5% $1,512 | +10% $1,629 |
| Rate | -1.0pp $1,464 | -0.5pp $1,429 | base $1,394 | +0.5pp $1,358 | +1.0pp $1,321 |
UW: 25.0% down · 7.5% · 30yr · 1.5% tax · 5.0% vac · 8.0% maint · 8.0% mgmt
Financing live
Cash to close
- Down payment
- $34,750
- Closing costs
- $4,170
- Reserves months
- —
- Total cash needed
- —
Loan-product check · same deal, 3 products live
Conventional
25% down · 7.5% · 30yr
- Down + closing
- —
- Monthly P&I
- —
- Monthly cashflow
- —
- DSCR
- —
- Eligible?
- —
Personal DTI + credit; lowest rate.
DSCR
20% down · 8.5% · 30yr
- Down + closing
- —
- Monthly P&I
- —
- Monthly cashflow
- —
- DSCR
- —
- Eligible?
- —
No personal income docs; deal must DSCR.
Hard money
10% down · 12.0% · 12mo
- Down + closing
- —
- Monthly P&I
- —
- Monthly cashflow
- —
- DSCR
- —
- Eligible?
- —
Short-term bridge; refi at stabilization.
Rent comps 18 comps
| Address | Beds | Baths | Sqft | Rent | $/sqft | DOM | Units | Dist |
|---|---|---|---|---|---|---|---|---|
| 1982 Wellington Ln Vista, CA | 1.0–2.0 | 1.0–2.0 | 852 | $3,036 | $3.56 | 3d | 3 | 0.50mi |
| 1941 Wellington Ln #7 Vista, CA | 2.0 | 2.0 | 924 | $2,750 | $2.98 | 44d | 1 | 0.50mi |
| 2183 Primrose Ave Unit B Vista, CA | 1.0 | 1.0 | 850 | $2,075 | $2.44 | 24d | 1 | 0.51mi |
| 856 Heatherwood Ln Vista, CA | 1.0–2.0 | 1.0–2.0 | 786 | $2,950 | $3.75 | 3d | 8 | 0.53mi |
| 1961 Anna Ln Vista, CA | 3.0 | 2.0 | 1407 | $3,700 | $2.63 | 13d | 1 | 0.56mi |
| 920 Sycamore Ave Vista, CA | 2.0 | 2.0 | 950 | $2,675 | $2.82 | 3d | 1 | 0.57mi |
| 221 Smilax Rd Vista, CA | 1.0–2.0 | 1.0–2.0 | 855 | $2,799 | $3.27 | 2d | 8 | 0.57mi |
| 1906 Northbrook Ct Vista, CA | 3.0 | 2.0 | 1488 | $4,500 | $3.02 | 2d | 1 | 0.60mi |
| 122 Palmyra Dr Vista, CA | 2.0 | 1.5 | 1054 | $2,588 | $2.46 | 44d | 1 | 0.66mi |
| 320 Smilax Rd San Marcos, CA | 2.0 | 1.0 | 875 | $2,675 | $3.06 | 44d | 1 | 0.67mi |
| 320 Smilax Rd San Marcos, CA | 2.0 | 1.0 | 875 | $2,675 | $3.06 | 24d | 1 | 0.67mi |
| 972 Ashton Ct Vista, CA | 3.0 | 2.5 | 1482 | $4,388 | $2.96 | 5d | 1 | 0.68mi |
| 300 Smilax Rd Unit 11 San Marcos, CA | 2.0 | 1.0 | 875 | $2,675 | $3.06 | 24d | 1 | 0.68mi |
| 266 Avenida de Suerte San Marcos, CA | 3.0 | 2.0 | 1132 | $3,495 | $3.09 | 22d | 1 | 0.72mi |
| 2144 University Dr Vista, CA | 2.0 | 1.0–2.0 | 748 | $2,815 | $3.76 | 10d | 1 | 0.73mi |
| 420 Smilax Rd San Marcos, CA | 2.0 | 2.0 | 896 | $2,445 | $2.73 | 3d | 3 | 0.86mi |
| 2080 Buena Creek Rd Vista, CA | 2.0 | 1.0 | 978 | $3,000 | $3.07 | 3d | 1 | 1.05mi |
| 258 Mar Vista Dr Vista, CA | 3.0 | 2.0 | 1134 | $4,250 | $3.75 | 18d | 1 | 1.24mi |
Listing history 7 events
-
2026-03-18price $139,000
-
2026-02-26$129,000 Active
-
2011-12-03historical
-
2011-07-12historical
-
2011-07-06price $37,000
-
2010-12-03$34,500 Active
-
2010-12-03$37,000
ⓘ Source: listings_history table (triggers on properties + properties_extension) + one-shot
backfill from property_details.listing_events for pre-trigger history.
Climate risk First Street
- Flood 1/10 Low FEMA zone X (unshaded) · 0% chance over 30 yrs
- Wildfire 2/10 Low
- Heat 4/10 Moderate 7 d/yr ≥91°F today · 21 d/yr by 30 yrs out
- Wind 1/10 Low
- Air quality 3/10 Moderate 4 unhealthy d/yr today · 4 by 30 yrs out
Nearby sold comps map
Loading sold comps map…
Walkable amenities ~0.75 mi
Loading nearby amenities…
Taxation est. · year 1
- Rental income
- $35,763
- − Mortgage interest
- −$7,786
- − Property taxes
- −$2,085
- − Insurance
- −$695
- − Repairs & maintenance
- −$2,861
- − Management
- −$2,861
- − Depreciation
- −$4,044
- Taxable income
- $15,432
- Est. tax owed @ 24.0%
- −$3,704
- After-tax cash flow
- $13,022/yr
For passive investors: Depreciation is non-cash, so a rental often shows a tax loss while cash-flowing — sheltering income. Rental losses are passive: they offset passive income freely, and up to $25,000/yr can offset ordinary (W-2) income if you actively participate and your MAGI is under $100k (phasing out to $0 by $150k); unused losses carry forward. On sale, claimed depreciation is recaptured at up to 25%, and gains may owe capital-gains tax (a 1031 exchange can defer both). Figures are a year-1 estimate at your 24.0% rate — not tax advice; consult a CPA.
Schools (NCES district)
- District
- San Marcos Unified
- NCES district ID
- 0634880
- Math proficiency
- 52% ▲ 1.00%
- Reading proficiency
- 67% ▲ 2.00%
- Median HH income
- $64,752
- Composite
- 53.67/100
- National rank
- #3093
- State rank
- #249 of 1400 in CA
Livability — Vista
- Score
- 60/100
- State rank
- #584
- US rank
- #18990
Category grades
Schools grade is shown separately in the Schools card above.
Census & demographics
- County
- San Diego County · 3,178,799 people
- City population
- 117,104
- Metro
- San Diego-Chula Vista-Carlsbad, CA
- Population (ZIP)
- 38,375
- Household income
- $86,974
- Rent vs Own
- Severe rent burden
- 1813.0
Population outlook (San Diego County) Hauer SSP2
- Today (2025)
- 3,678,185 people
- By 2030
- 3,856,546 · +4.8%
- By 2040
- 4,171,407 · +13.4%
- By 2050
- 4,421,607 · +20.2%
- By 2075
- 4,831,599 · +31.4%
- By 2100
- 4,832,502 · +31.4%
Race, ethnicity, and origin ACS 2023
- Neighborhood character
- Majority Hispanic (62%)
- Race & ethnicity
- Hispanic / Latino 62% Two or more races 33% White 27% Asian 4% Black 2% Native American 2% Pacific Islander 1%
- Hispanic origin (detail)
- Mexican 57%
- Common ancestry
- Lithuanian 2% Slovak 1% Romanian 1%
- Foreign-born
- 28% · Canada, Vietnam
- Languages at home
- 49% English-only · Spanish 47% Other Asian/Pacific 1% Tagalog/Filipino 1%
Political lean MEDSL · San Diego
- 2024 margin
- D (+16.8) · D 56.9% · R 40.1% · Other 2.9%
- 2008→2024 swing
- +6.6pp toward D · 2008: 10.2pp · 2024: 16.8pp
- All cycles
- 2024: D+16.8 2020: D+22.8 2016: D+17.8 2012: D+5.1 2008: D+10.2
Not yet ingested
- Civics
- —
Market trends
- HPI YoY
- ▼ -560.30%
- Current HPI
- 417.0863
- Rent YoY
- ▲ 3.44%
- Metro
- San Diego-Chula Vista-Carlsbad, CA
- State GDP YoY
- ▲ 3.21%
- F500 in state
- 116
Industry mix (Fortune 500 HQ in CA)
| Industry | F500 HQs | Revenue |
|---|---|---|
| Technology | 27 | $1,492B |
|
||
| Financial Services | 3 | $174B |
|
||
| Retail | 3 | $44B |
|
||
| Insurance | 3 | $26B |
|
||
| Media / Entertainment | 2 | $115B |
|
||
| Pharmaceuticals / Biotech | 2 | $62B |
|
||
Price history
+275.7% since first listed7 events — show timeline
- 2026-03-18 Price Changed $139,000 CRMLS
- 2026-02-26 Listed $129,000 CRMLS
- 2011-12-03 Listing Removed — CRMLS
- 2011-07-12 Listing Removed — SDMLS
- 2011-07-06 Price Changed $37,000 SDMLS
- 2010-12-03 Listed $34,500 SDMLS
- 2010-12-03 Listed $37,000 CRMLS
Cash-flow waterfall
monthlySold comps — $/sqft
last 12 mo · ≤1 miLoading sold comps…