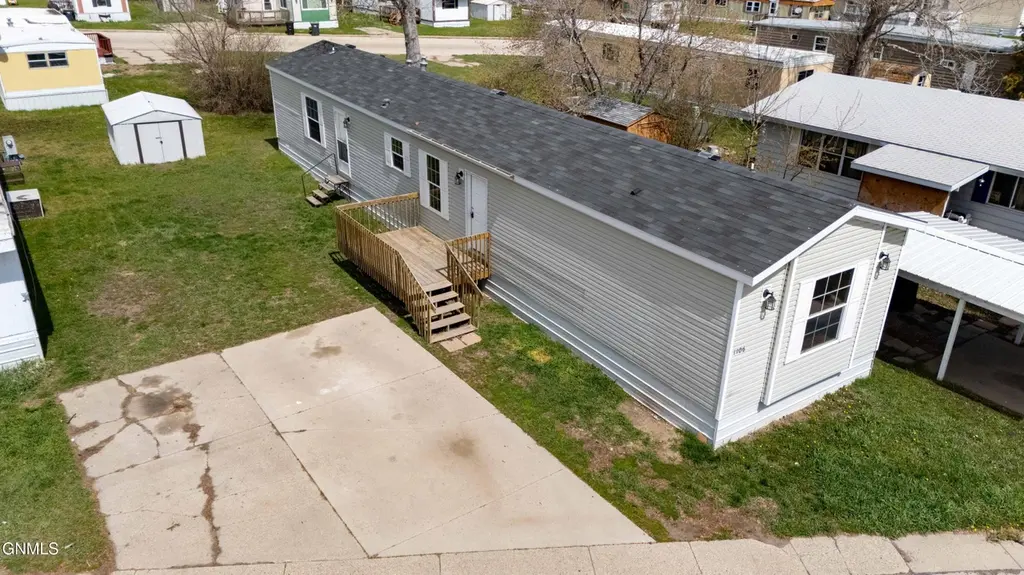
1106 South Frontier Trl · Mandan, ND
Flood risk 4/10 · Minor
- FEMA flood zone
- X (shaded)
- Chance of flooding over 30 yrs
- 0.24%
- Est. flood insurance / yr
- $507 – $1,088
Fire risk 4/10 · Minor
- Est. fire insurance / yr
- $1,289 – $2,393
Heat risk 2/10 · Minimal
- Hot days now (above 97°F)
- 7 days/yr
- Hot days in 30 yrs
- 12 days/yr
Wind risk 2/10 · Minimal
- Chance of severe wind over 30 yrs
- —
Air-quality risk 4/10 · Minor
- Unhealthy air days now
- 4 days/yr
- Unhealthy air days in 30 yrs
- 4 days/yr
Risk factors via First Street. Map © Google.
Why this score? — see what drove the B grade
The composite is a weighted blend of 9 inputs, each scored 0–100. Each bar is that input's sub-score; the figure is the points it added to the 100-point composite (weight × sub-score).
- Cash flow +30.0/30.0
- 1% rule +10.0/10.0
- DSCR +10.0/10.0
- ARV discount +7.3/15.0
- Rent growth +5.0/5.0
- Condition / age +3.8/5.0
- Livability +3.5/5.0
- Schools +3.3/10.0
- Appreciation +0.0/10.0
$55,000
🖨 Deal sheet 📄 Offer letter ✓ Due diligence
Key facts
- Central heat
- Air conditioning
- Manufactured home
Tags
Property features AI
Finance
- HOA & community: Located in Gateway Mobile Home Park
Exterior
- Parking: Parking pad
- Utilities: Public water; Public sewer
- Home design: Manufactured home (single wide); Residential property
- Construction: Built with other construction materials
- Exterior features: On-site storage
Interior
- Kitchen: Dishwasher, Range, Refrigerator
- Bathrooms: 2 full bathrooms
- Heating & cooling: Central air conditioning; Electric heating
- Interior features: Dishwasher, Range, Refrigerator
Neighborhood map
What this means for you Summary
Snapshot
- This is a 3-bed/2.0-bath manufactured listed at $55k. Condition is rated good.
Deal economics
- At list price, monthly cash flow is $589 ($7k/yr) — positive.
- The deal already cash-flows at list — no discount required.
- Meets the 1% rule at list price ($1k rent vs $55k).
- Cap rate 19.1% vs local median 2.7% in Mandan — top-decile yield for the area; either an underpriced asset or a hidden risk that comps aren't pricing in. Stress-test before assuming the spread holds.
Location & tenants
- Location reads 70/100 on livability (#76 in ND) — a middle-class / working-renter tenant base. Strengths: cost of living A+, housing A+, employment A; Watch: crime C-, amenities F, commute F.
- Mandan 1 (suburban): math 35% / reading 38% proficiency, ranked #32 of 53 in ND (top 60%) — families likely to look elsewhere, expect single-tenant / working-renter base with shorter leases.
- Zoned schools: Mandan Middle School (math 36% / reading 40%, grade F, #21 of 35 statewide, top 59%, 928 students, 30% FRL); Mandan High School (math 18% / reading 42%, grade F, #90 of 144 statewide, top 66%, 1,138 students, 25% FRL) — zoned schools at 28% FRL track the district average.
- Market conditions: Rents rising fast (+14.0%/yr); 304 active listings in the ZIP; 4 comparable units currently listed for rent nearby; rentals at typical pace (median 21d on market — plan ~3-4 weeks tenant-placement turnaround); solid renter incomes; 94 units permitted in Morton County in 2024 (5 in 5+ unit buildings).
Forward outlook
- Local home prices are declining (-3.0%/yr); year-one equity from $380 of loan paydown is wiped out by about $2k of value loss. Plan a longer hold.
- Morton County population projected at +48% by 2050 — long-run rental-demand tailwind backs the buy-and-hold thesis.
- At projected returns (-3.0% appreciation + 8.0% rent growth), your $15k cash investment doubles in ~3 years — after that, you're playing with house money.
Negotiation context
- Only 3 days on market — expect competitive offers; lowballing is unlikely to land.
Questions for the listing agent
- Is there a deadline driving the sale (1031 exchange, divorce, estate, relocation)? That informs how much negotiation room exists.
- What's the average days-on-market for RENTAL listings here right now (not sales)? A rising rental-DOM trend means longer vacancies and softer asking-rent achievability than the comps imply.
- What's the recent tenant-quality profile in this submarket — average credit score on applications, eviction rate, late-payment / NSF rate, and stable-employment percentage? A property-management company in the area should have these aggregated.
- How much new for-sale + rental construction is in the pipeline within 1–3 miles? Heavy new supply typically softens prices + rents 12–24 months out; constrained supply supports both.
Investment metrics
- 1% rule
- 2.23% ✓
- Cap rate
- 19.13%
- Cash-on-cash
- 45.86%
- DSCR
- 3.04
- GRM
- 3.7
CMA / ARV
- ARV (on-the-fly)
- $54,720
- Comps found
- 12
Show comp detail 12 sales within ~0.75 mi
| Address | Dist | Beds/Ba | Sqft | Sold | Price | $/sf | Match |
|---|---|---|---|---|---|---|---|
| 1106 South Frontier Trl | 0.00mi | 3/2.0 | 1,216 (0%) | 0mo | $55,000 | $45 | 100 |
| 1401 Pioneer Trl | 0.13mi | 3/2.0 | 1,216 (0%) | 4mo | $59,900 | $49 | 91 |
| 105 Gateway Trl | 0.14mi | 3/2.0 | 1,280 (+5%) | 3mo | $30,000 | $23 | 82 |
| 1305 Pioneer Trl | 0.08mi | 3/2.0 | 1,056 (-13%) | 4mo | $45,000 | $43 | 71 |
| 1615 Fox Dr SE | 0.19mi | 3/2.0 | 1,320 (+9%) | 8mo | $222,900 | $169 | 70 |
| 1205 South Frontier Trl | 0.08mi | 3/2.0 | 1,056 (-13%) | 7mo | $40,000 | $38 | 69 |
| 403 E Prairie Ln | 0.64mi | 3/2.0 | 1,216 (0%) | 3mo | $65,000 | $53 | 68 |
| 105 Countryside Ln | 0.68mi | 3/2.0 | 1,250 (+3%) | 2mo | $66,000 | $53 | 62 |
| 210 S Prairie Ln | 0.61mi | 3/2.0 | 1,216 (0%) | 13mo | $25,000 | $21 | 61 |
| 1203 Frontier Trl | 0.06mi | 2/2.0 (-1) | 1,056 (-13%) | 13mo | $29,000 | $27 | 60 |
| 703 6th Ave SE Unit C16 | 0.60mi | 3/1.0 | 1,140 (-6%) | 7mo | $79,999 | $70 | 52 |
| 405 Prairie Ln | 0.65mi | 2/2.0 (-1) | 1,076 (-12%) | 8mo | $26,000 | $24 | 39 |
Match score weights: distance 35% · size 25% · config 20% · recency 20%. Top-matched comps best support the ARV.
Projected returns pro-forma
-3.0% appreciation · 8.0% rent growth · sell at horizon
- IRR
- 48.6%
- Equity multiple
- 3.28×
- Total profit
- $35,069
- Equity at exit
- $8,201
- IRR
- 56.3%
- Equity multiple
- 8.04×
- Total profit
- $108,369
- Equity at exit
- $4,755
Cash invested: $15,400 (down + closing). Projections, not guarantees.
Landlord ↔ Tenant lean methodology
- Overall (STATE)
- 82 Strongly Landlord-Friendly
- State North Dakota
- 82 Strongly Landlord-Friendly · R+20
- County
- — inherits STATE
- City
- — inherits STATE
ZIP-level market 58554
- Rents YoY
- 14.0%
- Active inventory
- 304
- Price-to-rent
- 3.7×
Monthly cashflow live
- Estimated rent
- $1,226 medium interval (Pro) →
- Mortgage (P&I)
- −$288
- Tax est. 1.5%
- −$69 /mo · $825/yr
- Insurance
- −$23
- HOA
- −$0
- Vacancy / Maint / Mgmt
- −$257
- Net cashflow
- $589
Break-even live
UW: 25.0% down · 7.5% · 30yr · 1.5% tax · 5.0% vac · 8.0% maint · 8.0% mgmt
Financing live
Cash to close
- Down payment
- $13,750
- Closing costs
- $1,650
- Reserves months
- —
- Total cash needed
- —
Loan-product check · same deal, 3 products live
Conventional
25% down · 7.5% · 30yr
- Down + closing
- —
- Monthly P&I
- —
- Monthly cashflow
- —
- DSCR
- —
- Eligible?
- —
Personal DTI + credit; lowest rate.
DSCR
20% down · 8.5% · 30yr
- Down + closing
- —
- Monthly P&I
- —
- Monthly cashflow
- —
- DSCR
- —
- Eligible?
- —
No personal income docs; deal must DSCR.
Hard money
10% down · 12.0% · 12mo
- Down + closing
- —
- Monthly P&I
- —
- Monthly cashflow
- —
- DSCR
- —
- Eligible?
- —
Short-term bridge; refi at stabilization.
Rent comps 4 comps
| Address | Beds | Baths | Sqft | Rent | $/sqft | DOM | Units | Dist |
|---|---|---|---|---|---|---|---|---|
| 100 1st St NW Mandan, ND | 1.0–2.0 | 1.0 | 887 | $1,150 | $1.30 | 21d | 11 | 0.79mi |
| 406 4th St NW Mandan, ND | 3.0 | 1.5 | 1208 | $1,200 | $0.99 | 21d | 1 | 1.07mi |
| 1504 Shannon Dr NE Mandan, ND | 2.0 | 1.0 | 1000 | $1,000 | $1.00 | 21d | 1 | 1.10mi |
| 611 9th Ave SW Mandan, ND | 2.0 | 1.0 | 942 | $1,125 | $1.19 | 21d | 1 | 1.50mi |
Listing history 2 events
-
2026-05-21status Pending
-
2026-05-18$55,000 Active
ⓘ Source: listings_history table (triggers on properties + properties_extension) + one-shot
backfill from property_details.listing_events for pre-trigger history.
Climate risk First Street
- Flood 4/10 Moderate FEMA zone X (shaded) · 24% chance over 30 yrs
- Wildfire 4/10 Moderate
- Heat 2/10 Low 7 d/yr ≥97°F today · 12 d/yr by 30 yrs out
- Wind 2/10 Low
- Air quality 4/10 Moderate 4 unhealthy d/yr today · 4 by 30 yrs out
Nearby sold comps map
Loading sold comps map…
Walkable amenities ~0.75 mi
Loading nearby amenities…
Taxation est. · year 1
- Rental income
- $14,713
- − Mortgage interest
- −$3,081
- − Property taxes
- −$825
- − Insurance
- −$275
- − Repairs & maintenance
- −$1,177
- − Management
- −$1,177
- − Depreciation
- −$1,600
- Taxable income
- $6,578
- Est. tax owed @ 24.0%
- −$1,579
- After-tax cash flow
- $5,483/yr
For passive investors: Depreciation is non-cash, so a rental often shows a tax loss while cash-flowing — sheltering income. Rental losses are passive: they offset passive income freely, and up to $25,000/yr can offset ordinary (W-2) income if you actively participate and your MAGI is under $100k (phasing out to $0 by $150k); unused losses carry forward. On sale, claimed depreciation is recaptured at up to 25%, and gains may owe capital-gains tax (a 1031 exchange can defer both). Figures are a year-1 estimate at your 24.0% rate — not tax advice; consult a CPA.
Condition & rehab AI · 12 photos
This manufactured home is in good condition with a cosmetic rehab level, featuring a modern kitchen and bathrooms. It has a good roof and flooring, and the interior walls and paint are in good condition. The exterior could benefit from painting and new railings to enhance curb appeal and resale value.
Value-add opportunities
- Both paint exterior — enhances curb appeal and resale value
- Both replace deck railings — improves safety and adds aesthetic value
Renovation cost estimate screening
Value-add ROI direction
- Both paint exterior — enhances curb appeal and resale value ↑
- Both replace deck railings — improves safety and adds aesthetic value ↑
ⓘ Cost ranges are severity-bucket heuristics (US national rule-of-thumb). Get contractor quotes + a written scope before underwriting a rehab budget.
Schools (NCES district)
- District
- Mandan 1
- NCES district ID
- 3811820
- Math proficiency
- 35% ▼ -11.00%
- Reading proficiency
- 38% ▼ -5.00%
- Median HH income
- $60,131
- Composite
- 32.55/100
- National rank
- #5692
- State rank
- #32 of 53 in ND
Livability — Mandan
- Score
- 70/100
- State rank
- #76
- US rank
- #7567
Category grades
Schools grade is shown separately in the Schools card above.
Census & demographics
- Census place
- Mandan, ND
- County
- Morton County · 29,479 people
- City population
- 29,479
- Metro
- Bismarck, ND
- Population (ZIP)
- 29,479
- Household income
- $80,120
- Rent vs Own
- Severe rent burden
- 915.0
Population outlook (Morton County) Hauer SSP2
- Today (2025)
- 36,682 people
- By 2030
- 39,967 · +9.0%
- By 2040
- 46,921 · +27.9%
- By 2050
- 54,157 · +47.6%
- By 2075
- 73,661 · +100.8%
- By 2100
- 89,885 · +145.0%
Race, ethnicity, and origin ACS 2023
- Neighborhood character
- Predominantly White (87%)
- Race & ethnicity
- White 87% Hispanic / Latino 5% Native American 4% Two or more races 4% Black 2%
- Common ancestry
- Portuguese 14% Scotch-Irish 4% Iranian 2%
- Foreign-born
- 1% · Canada
- Languages at home
- 95% English-only · Spanish 3% German/W. Germanic 1%
Political lean MEDSL · Morton
- 2024 margin
- Solid R (+53.8) · D 22.2% · R 75.9% · Other 1.9%
- 2008→2024 swing
- -32.7pp toward R · 2008: -21.0pp · 2024: -53.8pp
- All cycles
- 2024: R+53.8 2020: R+50.4 2016: R+53.0 2012: R+31.1 2008: R+21.0
Not yet ingested
- Civics
- —
Market trends
- HPI YoY
- ▼ -161.81%
- Current HPI
- 137.8984
- Rent YoY
- ▲ 14.00%
- Metro
- Bismarck, ND
- State GDP YoY
- ▲ 2.09%
- F500 in state
- 2
Industry mix (Fortune 500 HQ in ND)
| Industry | F500 HQs | Revenue |
|---|---|---|
| Utilities / Construction | 1 | $6B |
|
||
Price history
2 events — show timeline
- 2026-05-21 Pending — GNMLS
- 2026-05-18 Listed $55,000 GNMLS
Cash-flow waterfall
monthlySold comps — $/sqft
last 12 mo · ≤1 miLoading sold comps…