275 N Maple St · Schell City, MO
Flood risk 1/10 · Minimal
- FEMA flood zone
- X (unshaded)
- Chance of flooding over 30 yrs
- 0.0%
- Est. flood insurance / yr
- $507 – $1,088
Fire risk 3/10 · Minor
- Est. fire insurance / yr
- $1,054 – $1,958
Heat risk 5/10 · Moderate
- Hot days now (above 108°F)
- 7 days/yr
- Hot days in 30 yrs
- 18 days/yr
Wind risk 2/10 · Minimal
- Chance of severe wind over 30 yrs
- 1.0%
Air-quality risk 2/10 · Minimal
- Unhealthy air days now
- 0 days/yr
- Unhealthy air days in 30 yrs
- 1 days/yr
Risk factors via First Street. Map © Google.
Why this score? — see what drove the B- grade
The composite is a weighted blend of 9 inputs, each scored 0–100. Each bar is that input's sub-score; the figure is the points it added to the 100-point composite (weight × sub-score).
- Cash flow +27.3/30.0
- DSCR +9.5/10.0
- ARV discount +7.5/15.0
- 1% rule +6.1/10.0
- Appreciation +6.0/10.0
- Livability +2.8/5.0
- Schools +2.6/10.0
- Rent growth +2.5/5.0
- Condition / age +2.5/5.0
$74,900
🖨 Deal sheet (PDF) 📄 Offer letter ✓ Due diligence
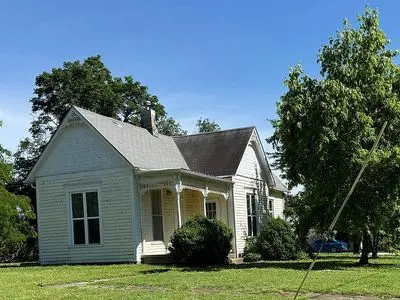
Listing remarks
Our beautifully charming little home is filled with stunning classic hand turned woodwork throughout. The transom windows were necessary to provide light to interior rooms before electricity was available in our rural town! High ceilings were necessary for comfort in summer! Closets and ceiling fans brought other needed accessories! Prior to our purchase the west side maple trees were felled, so we planted new ones to bring beautiful shade and majestic fall color! The south side garden spot grows delicious vegetables and brings pleasure to our quaint, classic property! We added a concrete floor to the garage.
Key facts
- Transom windows
- Ceiling fans
- Hand turned woodwork
Tags
Neighborhood map
What this means for you Summary
Snapshot
- This is a 1-bed/1.0-bath single-family listed at $75k.
Deal economics
- At list price, monthly cash flow is $216 ($3k/yr) — positive.
- The deal already cash-flows at list — no discount required.
- Meets the 1% rule at list price ($835 rent vs $75k).
- Recommended offer: $74k (1.5% below list) — sets the bar for market timing.
Location & tenants
- Location reads 56/100 on livability (#711 in MO) — a working-class tenant base; expect higher turnover. Strengths: cost of living A+, housing A+; Watch: schools F, crime F, amenities F.
- Northeast Vernon County R-I (rural): math 20% / reading 35% proficiency, ranked #485 of 535 in MO (top 91%) — low school quality limits family demand, transient renter base, plan for 1-2y turnover.
- Market conditions: 5 active listings in the ZIP; 57 units permitted in Vernon County in 2024 (38 in 5+ unit buildings).
Forward outlook
- In year one you build about $2k of equity ($518 loan paydown + $1k appreciation (2.0% local appreciation)).
- Vernon County population projected at -13% by 2050 — secular population decline; favor cash flow + early exit over multi-decade hold.
- At projected returns (2.0% appreciation + 3.0% rent growth), your $21k cash investment doubles in ~5 years — after that, you're playing with house money.
Negotiation context
- It's been on market 26 days — a 2% lower offer ($74k) is reasonable based on typical stale-listing flexibility.
- Current owner paid $22k; list at $75k implies a 240% gain — meaningful room to come down on a strong offer.
Risks & watch-outs
- Watch-outs: built in 1890 — expect roof / HVAC / electrical / plumbing capex.
- Climate carrying-cost: extreme-heat days projected 7→18/yr by 2055 (HVAC capex compounding) — expect insurance premiums to compound above CPI over the hold.
Questions for the listing agent
- Built in 1890 — when were the roof, HVAC, electrical panel, plumbing, and water heater last replaced?
- Is there a deadline driving the sale (1031 exchange, divorce, estate, relocation)? That informs how much negotiation room exists.
- Schools are F-rated, which usually means shorter tenancies and higher turnover. Who's the typical renter profile here, and what's been the actual vacancy rate?
- Crime grade is F in this area — have there been break-ins, vandalism, or insurance claims at this property in the last 3 years? What carrier currently insures it and at what premium?
- What's the average days-on-market for RENTAL listings here right now (not sales)? A rising rental-DOM trend means longer vacancies and softer asking-rent achievability than the comps imply.
- What's the recent tenant-quality profile in this submarket — average credit score on applications, eviction rate, late-payment / NSF rate, and stable-employment percentage? A property-management company in the area should have these aggregated.
- How much new for-sale + rental construction is in the pipeline within 1–3 miles? Heavy new supply typically softens prices + rents 12–24 months out; constrained supply supports both.
Investment metrics
- 1% rule
- 1.11% ✓
- Cap rate
- 9.75%
- Cash-on-cash
- 12.35%
- DSCR
- 1.55
- GRM
- 7.5
CMA / ARV
No comps found within radius.
Projected returns pro-forma
1.99% appreciation · 3.0% rent growth · sell at horizon
- IRR
- 16.6%
- Equity multiple
- 1.90×
- Total profit
- $18,816
- Equity at exit
- $29,504
- IRR
- 19.0%
- Equity multiple
- 3.52×
- Total profit
- $52,769
- Equity at exit
- $42,456
Cash invested: $20,972 (down + closing). Projections, not guarantees.
Landlord ↔ Tenant lean methodology
- Overall (STATE)
- 81 Strongly Landlord-Friendly
- State Missouri
- 81 Strongly Landlord-Friendly · R+10
- County
- — inherits STATE
- City
- — inherits STATE
ZIP-level market 64783
- Home prices YoY
- 1.5%
- Active inventory
- 5
- Price-to-rent
- 7.5×
Monthly cashflow live
- Estimated rent
- $835 medium interval (Pro) →
- Mortgage (P&I)
- −$393
- Tax from tax record
- −$20 /mo · $238/yr
- Insurance
- −$31
- HOA
- −$0
- Vacancy / Maint / Mgmt
- −$175
- Net cashflow
- $216
Break-even live
Sensitivity live
| Price | -10% $258 | -5% $237 | +0% $216 | +5% $195 | +10% $173 |
|---|---|---|---|---|---|
| Rent | -10% $150 | -5% $183 | +0% $216 | +5% $249 | +10% $282 |
| Rate | -1.0pp $254 | -0.5pp $235 | base $216 | +0.5pp $196 | +1.0pp $177 |
UW: 25.0% down · 7.5% · 30yr · 1.5% tax · 5.0% vac · 8.0% maint · 8.0% mgmt
Financing live
Cash to close
- Down payment
- $18,725
- Closing costs
- $2,247
- Reserves months
- —
- Total cash needed
- —
Loan-product check · same deal, 3 products live
Conventional
25% down · 7.5% · 30yr
- Down + closing
- —
- Monthly P&I
- —
- Monthly cashflow
- —
- DSCR
- —
- Eligible?
- —
Personal DTI + credit; lowest rate.
DSCR
20% down · 8.5% · 30yr
- Down + closing
- —
- Monthly P&I
- —
- Monthly cashflow
- —
- DSCR
- —
- Eligible?
- —
No personal income docs; deal must DSCR.
Hard money
10% down · 12.0% · 12mo
- Down + closing
- —
- Monthly P&I
- —
- Monthly cashflow
- —
- DSCR
- —
- Eligible?
- —
Short-term bridge; refi at stabilization.
Listing history 21 events
-
2026-06-21days on market $74,900 Active 26 DOM
-
2026-06-18days on market $74,900 Active 24 DOM
-
2026-06-17days on market $74,900 Active 23 DOM
-
2026-06-16pricedays on market $74,900 Active 22 DOM
-
2026-06-15days on market $79,900 Active 21 DOM
-
2026-06-13days on market $79,900 Active 19 DOM
-
2026-06-12days on market $79,900 Active 18 DOM
-
2026-06-09days on market $79,900 Active 15 DOM
-
2026-06-08days on market $79,900 Active 14 DOM
-
2026-06-07days on market $79,900 Active 13 DOM
-
2026-06-07days on market $79,900 Active 12 DOM
-
2026-06-04days on market $79,900 Active 9 DOM
-
2026-06-02days on market $79,900 Active 8 DOM
-
2026-06-01days on market $79,900 Active 7 DOM
-
2026-05-31days on market $79,900 Active 6 DOM
-
2026-05-26$79,900 Active
-
2014-05-27soldstatus $22,000
-
2008-12-02soldstatus
-
2008-07-18soldstatus
-
2001-04-25soldstatus
-
1996-10-01soldstatus
ⓘ Source: listings_history table (triggers on properties + properties_extension) + one-shot
backfill from property_details.listing_events for pre-trigger history.
Tax reassessment forecast MO · Resets to sale price
- Current annual tax
- $238 · $20/mo
- Projected year-2 tax
- $727 · $61/mo
- Expected delta
- +$488/yr (+$41/mo · 205.1%)
ⓘ Screening estimate from a state-policy table — verify with the county assessor before closing.
Climate risk First Street
- Flood 1/10 Low FEMA zone X (unshaded) · 0% chance over 30 yrs
- Wildfire 3/10 Moderate
- Heat 5/10 Major 7 d/yr ≥108°F today · 18 d/yr by 30 yrs out
- Wind 2/10 Low 100% chance of damaging wind over 30 yrs
- Air quality 2/10 Low 0 unhealthy d/yr today · 1 by 30 yrs out
Nearby sold comps map
Loading sold comps map…
Walkable amenities ~0.75 mi
Loading nearby amenities…
Taxation est. · year 1
- Rental income
- $10,021
- − Mortgage interest
- −$4,196
- − Property taxes
- −$238
- − Insurance
- −$374
- − Repairs & maintenance
- −$802
- − Management
- −$802
- − Depreciation
- −$2,179
- Taxable income
- $1,431
- Est. tax owed @ 24.0%
- −$343
- After-tax cash flow
- $2,247/yr
For passive investors: Depreciation is non-cash, so a rental often shows a tax loss while cash-flowing — sheltering income. Rental losses are passive: they offset passive income freely, and up to $25,000/yr can offset ordinary (W-2) income if you actively participate and your MAGI is under $100k (phasing out to $0 by $150k); unused losses carry forward. On sale, claimed depreciation is recaptured at up to 25%, and gains may owe capital-gains tax (a 1031 exchange can defer both). Figures are a year-1 estimate at your 24.0% rate — not tax advice; consult a CPA.
Schools (NCES district)
- District
- Northeast Vernon County R-I
- NCES district ID
- 2927600
- Math proficiency
- 20% ▼ -5.00%
- Reading proficiency
- 35% ▼ -5.00%
- Median HH income
- $34,463
- Composite
- 25.55/100
- National rank
- #12840
- State rank
- #485 of 535 in MO
Livability — Schell City
- Score
- 56/100
- State rank
- #711
- US rank
- #22956
Category grades
Schools grade is shown separately in the Schools card above.
Census & demographics
- Census place
- Schell City, MO
- Population (ZIP)
- 575
Population outlook (Vernon County) Hauer SSP2
- Today (2025)
- 20,169 people
- By 2030
- 19,639 · -2.6%
- By 2040
- 18,551 · -8.0%
- By 2050
- 17,549 · -13.0%
- By 2075
- 15,314 · -24.1%
- By 2100
- 13,132 · -34.9%
Race, ethnicity, and origin ACS 2023
- Neighborhood character
- Predominantly White (98%)
- Race & ethnicity
- White 98% Two or more races 2%
- Common ancestry
- Italian 3% Slovak 2% Romanian 1%
- Foreign-born
- 0%
Political lean MEDSL · Vernon
- 2024 margin
- Solid R (+59.5) · D 19.8% · R 79.3%
- 2008→2024 swing
- -37.5pp toward R · 2008: -22.0pp · 2024: -59.5pp
- All cycles
- 2024: R+59.5 2020: R+57.2 2016: R+56.2 2012: R+37.3 2008: R+22.0
Not yet ingested
- Civics
- —
Market trends
- HPI YoY
- ▲ 1.99%
- Current HPI
- 133.2176
- Rent YoY
- —
- Metro
- —
- State GDP YoY
- ▲ 1.84%
- F500 in state
- 20
Industry mix (Fortune 500 HQ in MO)
| Industry | F500 HQs | Revenue |
|---|---|---|
| Healthcare | 1 | $163B |
|
||
| Insurance | 1 | $21B |
|
||
| Industrial Technology | 1 | $17B |
|
||
| Retail | 1 | $16B |
|
||
| Industrial Distribution | 1 | $10B |
|
||
| Utilities | 1 | $9B |
|
||
Price history
+263.2% since first listed6 events — show timeline
- 2026-05-26 Listed $79,900 FSBO.com
- 2014-05-27 Sold (Public Records) $22,000 Public Records
- 2008-12-02 Sold (Public Records) — Public Records
- 2008-07-18 Sold (Public Records) — Public Records
- 2001-04-25 Sold (Public Records) — Public Records
- 1996-10-01 Sold (Public Records) — Public Records
Property tax history
+4.2%/yrLatest (2025): $238 · -2.7% YoY. Source: county tax records.
Cash-flow waterfall
monthlySold comps — $/sqft
last 12 mo · ≤1 miLoading sold comps…