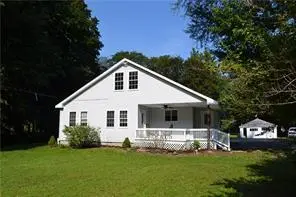
95 Tinker Town Rd · Dover Plains, NY
Flood risk 6/10 · Moderate
- FEMA flood zone
- X (unshaded)
- Chance of flooding over 30 yrs
- 0.7%
- Est. flood insurance / yr
- $507 – $1,088
Fire risk 3/10 · Minor
- Est. fire insurance / yr
- $691 – $1,283
Heat risk 4/10 · Minor
- Hot days now (above 96°F)
- 7 days/yr
- Hot days in 30 yrs
- 16 days/yr
Wind risk 4/10 · Minor
- Chance of severe wind over 30 yrs
- 15.0%
Air-quality risk 2/10 · Minimal
- Unhealthy air days now
- 2 days/yr
- Unhealthy air days in 30 yrs
- 2 days/yr
Risk factors via First Street. Map © Google.
Why this score? — see what drove the D grade
The composite is a weighted blend of 9 inputs, each scored 0–100. Each bar is that input's sub-score; the figure is the points it added to the 100-point composite (weight × sub-score).
- Cash flow +12.7/30.0
- Appreciation +10.0/10.0
- Schools +4.0/10.0
- DSCR +3.8/10.0
- 1% rule +3.6/10.0
- Livability +3.2/5.0
- Rent growth +2.5/5.0
- Condition / age +2.5/5.0
- ARV discount +0.0/15.0
$398,000
🖨 Deal sheet (PDF) 📄 Offer letter ✓ Due diligence
Listing remarks
Incredible value meets timeless country charm in this truly special property, tucked away on nearly a full acre of beautifully landscaped land. Set back from the road, this serene retreat is defined by a rare and captivating feature. .. a true whitewater stream that runs the entire length of the property, offering a peaceful soundtrack and a setting that feels like a getaway every single day. The grounds are nothing short of enchanting. Enjoy level, usable land adorned with mature landscaping, including a magnificent 100-year-old ginkgo tree, delicate cherry blossoms, vibrant rose bushes, lush hostas, and a variety of other plantings that create color and texture throughout the seasons. Whe
Key facts
- Charming gazebo
- Above ground pool
- Inviting firepit
Tags
Neighborhood map
What this means for you Summary
Snapshot
- This is a 2-bed/2.0-bath single-family listed at $398k.
Deal economics
- At list price, monthly cash flow is $-45 ($-544/yr) — negative.
- To cash-flow at today's rent, offer at most $390k (2.0% below list).
- To meet the 1% rule (rent ≥ 1% of price), the offer needs to be $341k (14.4% below list).
- Recommended offer: $341k (14.4% below list) — sets the bar for 1% rule.
Location & tenants
- Location reads 63/100 on livability (#818 in NY) — a middle-class / working-renter tenant base. Strengths: crime A, cost of living B; Watch: schools C-, commute C-, housing D+.
- Dover Union Free School District (rural): math 44% / reading 48% proficiency, ranked #433 of 590 in NY (top 73%) — families likely to look elsewhere, expect single-tenant / working-renter base with shorter leases.
- Market conditions: 38 active listings in the ZIP; 620 units permitted in Dutchess County in 2024 (242 in 5+ unit buildings).
Forward outlook
- In year one you build about $43k of equity ($3k loan paydown + $40k appreciation (10.0% local appreciation)).
- Dutchess County population projected at -11% by 2050 — secular population decline; favor cash flow + early exit over multi-decade hold.
- At projected returns (10.0% appreciation + 3.0% rent growth), your $111k cash investment doubles in ~3 years — after that, you're playing with house money.
- By year 2, paydown + projected appreciation supports a ~$68k cash-out refi (75% LTV) — recoverable capital for the next deal without selling this one.
Negotiation context
- It's been on market 17 days — a 2% lower offer ($392k) is reasonable based on typical stale-listing flexibility.
- 10 sale attempts since 22y ago with the ask held roughly flat each time — persistent listings suggest the price (not the market) is what's stuck; bring a comps-based counter.
- Current owner paid $184k; list at $398k implies a 116% gain — meaningful room to come down on a strong offer.
Risks & watch-outs
- Watch-outs: built in 1930 — expect roof / HVAC / electrical / plumbing capex.
- Climate carrying-cost: major flood risk — expect insurance premiums to compound above CPI over the hold.
Questions for the listing agent
- What do current leases actually rent for vs. the listed asking? Can we see a recent rent roll and the last 12 months of T-12 income?
- Built in 1930 — when were the roof, HVAC, electrical panel, plumbing, and water heater last replaced?
- Is there a deadline driving the sale (1031 exchange, divorce, estate, relocation)? That informs how much negotiation room exists.
- The area grade is low — what's the realistic commute time and amenity access for the typical tenant pool here? Any planned neighborhood developments (good or bad) we should know about?
- What's the average days-on-market for RENTAL listings here right now (not sales)? A rising rental-DOM trend means longer vacancies and softer asking-rent achievability than the comps imply.
- What's the recent tenant-quality profile in this submarket — average credit score on applications, eviction rate, late-payment / NSF rate, and stable-employment percentage? A property-management company in the area should have these aggregated.
- How much new for-sale + rental construction is in the pipeline within 1–3 miles? Heavy new supply typically softens prices + rents 12–24 months out; constrained supply supports both.
Investment metrics
- 1% rule
- 0.86% ✗
- Cap rate
- 6.16%
- Cash-on-cash
- -0.49%
- DSCR
- 0.98
- GRM
- 9.7
CMA / ARV
- ARV (median comp)
- $308,611
- List price
- $398,000
- Delta
- 28.96%
- Verdict
- OVERPRICED
- Comps
- 8 within 1.0 mi
Show comp detail 4 sales within ~0.75 mi
| Address | Dist | Beds/Ba | Sqft | Sold | Price | $/sf | Match |
|---|---|---|---|---|---|---|---|
| 96 Tinker Town Rd | 0.09mi | 3/2.0 (+1) | 1,912 (-4%) | 18mo | $275,000 | $144 | 68 |
| 3465 Route 22 | 0.27mi | 2/2.0 | 1,836 (-8%) | 9mo | $256,000 | $139 | 67 |
| 53 Glen Ave | 0.15mi | 3/1.0 (+1) | 1,786 (-11%) | 10mo | $375,000 | $210 | 58 |
| 4-6 Neighborly Ln | 0.52mi | 3/1.0 (+1) | 1,728 (-14%) | 13mo | $115,000 | $67 | 33 |
Match score weights: distance 35% · size 25% · config 20% · recency 20%. Top-matched comps best support the ARV.
Projected returns pro-forma
10.0% appreciation · 3.0% rent growth · sell at horizon
- IRR
- 23.9%
- Equity multiple
- 2.92×
- Total profit
- $213,917
- Equity at exit
- $358,550
- IRR
- 21.2%
- Equity multiple
- 6.67×
- Total profit
- $632,307
- Equity at exit
- $773,226
Cash invested: $111,440 (down + closing). Projections, not guarantees.
Landlord ↔ Tenant lean methodology
- Overall (STATE)
- 15 Strongly Tenant-Friendly
- State New York
- 15 Strongly Tenant-Friendly · D+10
- County
- — inherits STATE
- City
- — inherits STATE
ZIP-level market 12522
- Home prices YoY
- 17.7%
- Active inventory
- 38
- Price-to-rent
- 9.7×
Monthly cashflow live
- Estimated rent
- $3,407 medium interval (Pro) →
- Mortgage (P&I)
- −$2,087
- Tax from tax record
- −$484 /mo · $5,808/yr
- Insurance
- −$166
- HOA
- −$0
- Vacancy / Maint / Mgmt
- −$716
- Net cashflow
- $-45
Break-even live
Sensitivity live
| Price | -10% $180 | -5% $67 | +0% $-45 | +5% $-158 | +10% $-271 |
|---|---|---|---|---|---|
| Rent | -10% $-315 | -5% $-180 | +0% $-45 | +5% $89 | +10% $224 |
| Rate | -1.0pp $155 | -0.5pp $56 | base $-45 | +0.5pp $-148 | +1.0pp $-253 |
UW: 25.0% down · 7.5% · 30yr · 1.5% tax · 5.0% vac · 8.0% maint · 8.0% mgmt
Financing live
Cash to close
- Down payment
- $99,500
- Closing costs
- $11,940
- Reserves months
- —
- Total cash needed
- —
Loan-product check · same deal, 3 products live
Conventional
25% down · 7.5% · 30yr
- Down + closing
- —
- Monthly P&I
- —
- Monthly cashflow
- —
- DSCR
- —
- Eligible?
- —
Personal DTI + credit; lowest rate.
DSCR
20% down · 8.5% · 30yr
- Down + closing
- —
- Monthly P&I
- —
- Monthly cashflow
- —
- DSCR
- —
- Eligible?
- —
No personal income docs; deal must DSCR.
Hard money
10% down · 12.0% · 12mo
- Down + closing
- —
- Monthly P&I
- —
- Monthly cashflow
- —
- DSCR
- —
- Eligible?
- —
Short-term bridge; refi at stabilization.
Listing history 29 events
-
2026-06-09statusdays on market $398,000 Pending 17 DOM
-
2026-04-21$398,000 Active
-
2024-02-02historical
-
2018-06-07soldstatus $184,200
-
2018-04-26soldstatus $184,200 Sold
-
2018-02-21historical Pending
-
2017-11-29price $185,000
-
2017-10-12price $219,000
-
2017-09-13$225,000 Active
-
2017-07-11soldstatus $69,500
-
2017-05-31soldstatus $69,012
-
2017-01-16$74,900
-
2017-01-12historical
-
2016-10-14$80,263
-
2016-10-10historical Withdrawn
-
2016-10-10historical
-
2016-07-16price
-
2016-06-22Active
-
2016-06-22$149,900
-
2016-06-22$149,900
-
2016-06-21historical
-
2015-11-25$154,900
-
2015-07-25historical
-
2015-01-26$319,000
-
2004-10-15soldstatus $196,000
-
2004-09-27soldstatus $185,000
-
2004-08-19historical
-
2004-08-19price $189,900
-
2004-04-12$185,000
ⓘ Source: listings_history table (triggers on properties + properties_extension) + one-shot
backfill from property_details.listing_events for pre-trigger history.
Tax reassessment forecast NY · Partial reset (capped growth)
- Current annual tax
- $5,808 · $484/mo
- Projected year-2 tax
- $6,267 · $522/mo
- Expected delta
- +$459/yr (+$38/mo · 7.9%)
ⓘ Screening estimate from a state-policy table — verify with the county assessor before closing.
Climate risk First Street
- Flood 6/10 Major FEMA zone X (unshaded) · 70% chance over 30 yrs
- Wildfire 3/10 Moderate
- Heat 4/10 Moderate 7 d/yr ≥96°F today · 16 d/yr by 30 yrs out
- Wind 4/10 Moderate 15% chance of damaging wind over 30 yrs
- Air quality 2/10 Low 2 unhealthy d/yr today · 2 by 30 yrs out
Nearby sold comps map
Loading sold comps map…
Walkable amenities ~0.75 mi
Loading nearby amenities…
Taxation est. · year 1
- Rental income
- $40,886
- − Mortgage interest
- −$22,294
- − Property taxes
- −$5,808
- − Insurance
- −$1,990
- − Repairs & maintenance
- −$3,271
- − Management
- −$3,271
- − Depreciation
- −$11,578
- Taxable loss
- −$7,326
- Est. tax savings @ 24.0%
- +$1,758
- After-tax cash flow
- $1,214/yr
For passive investors: Depreciation is non-cash, so a rental often shows a tax loss while cash-flowing — sheltering income. Rental losses are passive: they offset passive income freely, and up to $25,000/yr can offset ordinary (W-2) income if you actively participate and your MAGI is under $100k (phasing out to $0 by $150k); unused losses carry forward. On sale, claimed depreciation is recaptured at up to 25%, and gains may owe capital-gains tax (a 1031 exchange can defer both). Figures are a year-1 estimate at your 24.0% rate — not tax advice; consult a CPA.
Schools (NCES district)
- District
- Dover Union Free School District
- NCES district ID
- 3609210
- Math proficiency
- 44% ▼ -8.00%
- Reading proficiency
- 48% ▲ 3.00%
- Median HH income
- $58,267
- Composite
- 40.25/100
- National rank
- #3768
- State rank
- #433 of 590 in NY
Livability — Dover Plains
- Score
- 63/100
- State rank
- #818
- US rank
- #15806
Category grades
Schools grade is shown separately in the Schools card above.
Census & demographics
- Population (ZIP)
- 5,074
Population outlook (Dutchess County) Hauer SSP2
- Today (2025)
- 291,768 people
- By 2030
- 287,131 · -1.6%
- By 2040
- 274,881 · -5.8%
- By 2050
- 259,971 · -10.9%
- By 2075
- 235,366 · -19.3%
- By 2100
- 208,786 · -28.4%
Race, ethnicity, and origin ACS 2023
- Neighborhood character
- Predominantly White (76%)
- Race & ethnicity
- White 76% Hispanic / Latino 14% Two or more races 10% Asian 2% Black 1%
- Hispanic origin (detail)
- Puerto Rican 5% Cuban 2%
- Common ancestry
- Lithuanian 3% Scandinavian 2% Slovak 2%
- Foreign-born
- 12% · Canada, China
- Languages at home
- 85% English-only · Spanish 6% Other Indo-European 4% Chinese 2%
Political lean MEDSL · Dutchess
- 2024 margin
- Lean D (+5.4) · D 52.7% · R 47.3%
- 2008→2024 swing
- -3.2pp toward R · 2008: 8.6pp · 2024: 5.4pp
- All cycles
- 2024: D+5.4 2020: D+9.6 2016: R+1.1 2012: D+6.6 2008: D+8.6
Not yet ingested
- Civics
- —
Market trends
- HPI YoY
- ▲ 39.50%
- Current HPI
- 262.8121
- Rent YoY
- —
- Metro
- —
- State GDP YoY
- ▲ 2.60%
- F500 in state
- 92
Industry mix (Fortune 500 HQ in NY)
| Industry | F500 HQs | Revenue |
|---|---|---|
| Financial Services | 10 | $950B |
|
||
| Consumer Goods | 9 | $162B |
|
||
| Insurance | 4 | $225B |
|
||
| Telecommunications | 2 | $144B |
|
||
| Pharmaceuticals | 2 | $112B |
|
||
| Media / Entertainment | 2 | $69B |
|
||
Price history
+115.1% since first listed28 events — show timeline
- 2026-04-21 Listed $398,000 OneKey® MLS as Distributed by MLS Grid
- 2024-02-02 Listing Removed — OneKey® MLS as Distributed by MLS Grid
- 2018-06-07 Sold (Public Records) $184,200 Public Records
- 2018-04-26 Sold (MLS) $184,200 OneKey® MLS as Distributed by MLS Grid
- 2018-02-21 Contingent — OneKey® MLS as Distributed by MLS Grid
- 2017-11-29 Price Changed $185,000 OneKey® MLS as Distributed by MLS Grid
- 2017-10-12 Price Changed $219,000 OneKey® MLS as Distributed by MLS Grid
- 2017-09-13 Listed $225,000 OneKey® MLS as Distributed by MLS Grid
- 2017-07-11 Sold (Public Records) $69,500 Public Records
- 2017-05-31 Sold (MLS) $69,012 OneKey® MLS as Distributed by MLS Grid
- 2017-01-16 Listed $74,900 OneKey® MLS as Distributed by MLS Grid
- 2017-01-12 Listing Removed — OneKey® MLS as Distributed by MLS Grid
- 2016-10-14 Listed $80,263 OneKey® MLS as Distributed by MLS Grid
- 2016-10-10 Delisted — HGMLS
- 2016-10-10 Listing Removed — OneKey® MLS as Distributed by MLS Grid
- 2016-07-16 Price Changed — HGMLS
- 2016-06-22 Listed — HGMLS
- 2016-06-22 Listed $149,900 OneKey® MLS as Distributed by MLS Grid
- 2016-06-22 Listed $149,900 OneKey® MLS as Distributed by MLS Grid
- 2016-06-21 Listing Removed — OneKey® MLS as Distributed by MLS Grid
- 2015-11-25 Listed $154,900 OneKey® MLS as Distributed by MLS Grid
- 2015-07-25 Listing Removed — OneKey® MLS as Distributed by MLS Grid
- 2015-01-26 Listed $319,000 OneKey® MLS as Distributed by MLS Grid
- 2004-10-15 Sold (Public Records) $196,000 Public Records
- 2004-09-27 Sold (MLS) $185,000 HGMLS
- 2004-08-19 Price Changed $189,900 HGMLS
- 2004-08-19 Delisted — HGMLS
- 2004-04-12 Listed $185,000 HGMLS
Property tax history
-2.1%/yrLatest (2025): $5,808 · +2.7% YoY. Source: county tax records.
Cash-flow waterfall
monthlySold comps — $/sqft
last 12 mo · ≤1 miLoading sold comps…