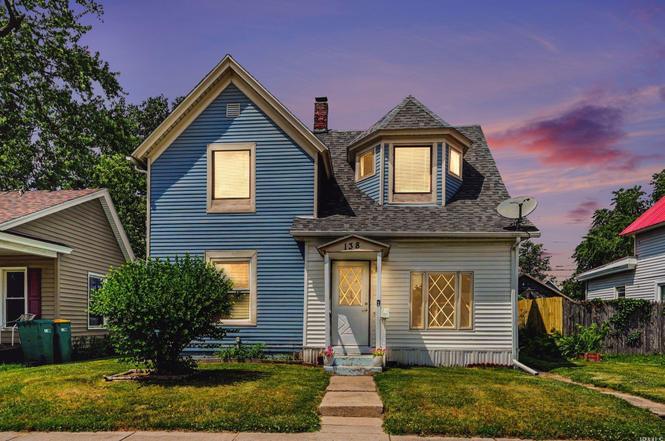
138 W Broadway St · Mishawaka, IN
Flood risk 1/10 · Minimal
- FEMA flood zone
- X (unshaded)
- Chance of flooding over 30 yrs
- 0.0%
- Est. flood insurance / yr
- $473 – $860
Fire risk 1/10 · Minimal
- Est. fire insurance / yr
- $717 – $1,331
Heat risk 3/10 · Minor
- Hot days now (above 100°F)
- 7 days/yr
- Hot days in 30 yrs
- 16 days/yr
Wind risk 2/10 · Minimal
- Chance of severe wind over 30 yrs
- —
Air-quality risk 3/10 · Minor
- Unhealthy air days now
- 2 days/yr
- Unhealthy air days in 30 yrs
- 3 days/yr
Risk factors via First Street. Map © Google.
Why this score? — see what drove the C- grade
The composite is a weighted blend of 9 inputs, each scored 0–100. Each bar is that input's sub-score; the figure is the points it added to the 100-point composite (weight × sub-score).
- Cash flow +19.5/30.0
- ARV discount +11.9/15.0
- DSCR +6.2/10.0
- 1% rule +4.9/10.0
- Rent growth +3.8/5.0
- Livability +3.8/5.0
- Condition / age +2.5/5.0
- Schools +2.2/10.0
- Appreciation +0.0/10.0
$199,900
🖨 Deal sheet (PDF) 📄 Offer letter ✓ Due diligence
Listing remarks MLS
Investors alert, cash only sold as is. Great location, close to Bethel College and shopping, newer roof, furnace and A/C, first floor laundry and formal dining room, some flooring and paint will make this house wonderful!!
Key facts
- Local attractions
- Thoughtful updates
- Mishawaka riverwalk
Tags
Property features AI
Finance
- Other: Lot dimensions approximately 43 x 120 (0.12 acre)
Exterior
- Parking: Detached garage with 1 garage space
- Utilities: Public water; Public sewer
- Home design: Single-family residence (site-built); 2 stories; Vinyl siding
- Construction: Asphalt shingle roof; Concrete perimeter and block foundation; Built with vinyl siding
- Exterior features: Deck; Enclosed porch; Chain link and privacy fencing; Level lot
Interior
- Kitchen: Refrigerator; Gas oven
- Bedrooms: Total of 8 rooms (bedroom count not specified)
- Flooring: Hardwood; Carpet; Laminate
- Bathrooms: 2 full bathrooms; 1 main-level bathroom
- Heating & cooling: Natural gas heating with forced air; Central air conditioning
- Interior features: Entrance foyer; Laminate counters; Window treatments; Partial unfinished basement
- Laundry & utility: Washer and dryer; Laundry on main level
Neighborhood map
What this means for you Summary
Snapshot
- This is a 5-bed/2.0-bath single-family listed at $200k.
Deal economics
- At list price, monthly cash flow is $228 ($3k/yr) — positive.
- The deal already cash-flows at list — no discount required.
- To meet the 1% rule (rent ≥ 1% of price), the offer needs to be $198k (1.0% below list).
- Recommended offer: $198k (1.0% below list) — sets the bar for 1% rule.
- Cap rate 7.7% vs local median 5.3% in Mishawaka — top-decile yield for the area; either an underpriced asset or a hidden risk that comps aren't pricing in. Stress-test before assuming the spread holds.
Location & tenants
- Location reads 76/100 on livability (#53 in IN, #3,586 nationally) — a middle-class / working-renter tenant base. Strengths: cost of living A+, housing A+, health & safety B; Watch: amenities F, employment F.
- School City Of Mishawaka (urban): math 23% / reading 30% proficiency, ranked #260 of 301 in IN (top 86%) — low school quality limits family demand, transient renter base, plan for 1-2y turnover.
- Zoned schools: Liberty Elementary School (math 23% / reading 22%, grade F, #788 of 994 statewide, top 79%, 417 students, 80% FRL); John J Young Middle School (math 17% / reading 30%, grade F, #257 of 330 statewide, top 79%, 735 students, 74% FRL); Mishawaka High School (math 24% / reading 60%, grade F, #197 of 369 statewide, top 57%, 1,488 students, 65% FRL) — zoned schools average 73% FRL vs 54% district-wide (19 pts higher); higher-poverty schools than district average — tighter screening recommended.
- Market conditions: Rents rising fast (+5.2%/yr); 78 active listings in the ZIP; 1 comparable units currently listed for rent nearby; 754 units permitted in St. Joseph County in 2024 (460 in 5+ unit buildings).
- This rent runs 42% of the median local income ($57k/yr) — at the standard rent-burdened threshold; future hikes will face affordability resistance.
Forward outlook
- Local home prices are declining (-3.0%/yr); year-one equity from $1k of loan paydown is wiped out by about $6k of value loss. Plan a longer hold.
Negotiation context
- Only 10 days on market — expect competitive offers; lowballing is unlikely to land.
- 3 sale attempts since 5y ago with the ask held roughly flat each time — persistent listings suggest the price (not the market) is what's stuck; bring a comps-based counter.
- Current owner paid $70k; list at $200k implies a 184% gain — meaningful room to come down on a strong offer.
Risks & watch-outs
- Watch-outs: built in 1895 — expect roof / HVAC / electrical / plumbing capex.
Questions for the listing agent
- Built in 1895 — when were the roof, HVAC, electrical panel, plumbing, and water heater last replaced?
- Is there a deadline driving the sale (1031 exchange, divorce, estate, relocation)? That informs how much negotiation room exists.
- What's the average days-on-market for RENTAL listings here right now (not sales)? A rising rental-DOM trend means longer vacancies and softer asking-rent achievability than the comps imply.
- What's the recent tenant-quality profile in this submarket — average credit score on applications, eviction rate, late-payment / NSF rate, and stable-employment percentage? A property-management company in the area should have these aggregated.
- How much new for-sale + rental construction is in the pipeline within 1–3 miles? Heavy new supply typically softens prices + rents 12–24 months out; constrained supply supports both.
Investment metrics
- 1% rule
- 0.99% ✗
- Cap rate
- 7.66%
- Cash-on-cash
- 4.88%
- DSCR
- 1.22
- GRM
- 8.4
CMA / ARV
- ARV (on-the-fly)
- $221,400
- Comps found
- 9
Show comp detail 9 sales within ~0.75 mi
| Address | Dist | Beds/Ba | Sqft | Sold | Price | $/sf | Match |
|---|---|---|---|---|---|---|---|
| 112 W Grove St | 0.20mi | 4/2.0 (-1) | 1,799 (+10%) | 2mo | $258,000 | $143 | 68 |
| 1016 Division St | 0.32mi | 4/1.5 (-1) | 1,456 (-11%) | 3mo | $215,000 | $148 | 56 |
| 901 E Lawrence St | 0.67mi | 4/2.0 (-1) | 1,695 (+3%) | 7mo | $221,000 | $130 | 52 |
| 611 W Mishawaka Ave | 0.47mi | 4/2.0 (-1) | 1,774 (+8%) | 20mo | $214,000 | $121 | 43 |
| 119 Towle Ave | 0.61mi | 4/2.0 (-1) | 1,788 (+9%) | 11mo | $242,500 | $136 | 42 |
| 1015 W Battell St | 0.67mi | 4/2.5 (-1) | 1,760 (+7%) | 11mo | $237,500 | $135 | 41 |
| 540 Webster St | 0.63mi | 4/1.5 (-1) | 1,456 (-11%) | 8mo | $107,000 | $73 | 38 |
| 540 Webster St | 0.63mi | 4/1.5 (-1) | 1,456 (-11%) | 8mo | $107,000 | $73 | 38 |
| 3120 Falling Oak Dr | 0.54mi | 4/2.5 (-1) | 1,830 (+12%) | 14mo | $369,900 | $202 | 37 |
Match score weights: distance 35% · size 25% · config 20% · recency 20%. Top-matched comps best support the ARV.
Projected returns pro-forma
-3.0% appreciation · 5.2% rent growth · sell at horizon
- IRR
- -6.3%
- Equity multiple
- 0.76×
- Total profit
- $-13,405
- Equity at exit
- $29,806
- IRR
- 5.8%
- Equity multiple
- 1.47×
- Total profit
- $26,225
- Equity at exit
- $17,284
Cash invested: $55,972 (down + closing). Projections, not guarantees.
Landlord ↔ Tenant lean methodology
- Overall (STATE)
- 90 Strongly Landlord-Friendly
- State Indiana
- 90 Strongly Landlord-Friendly · R+11
- County
- — inherits STATE
- City
- — inherits STATE
ZIP-level market 46545
- Rents YoY
- 5.2%
- Active inventory
- 78
- Price-to-rent
- 8.4×
Monthly cashflow live
- Estimated rent
- $1,978 medium interval (Pro) →
- Mortgage (P&I)
- −$1,048
- Tax from tax record
- −$203 /mo · $2,440/yr
- Insurance
- −$83
- HOA
- −$0
- Lot rent
- −$0
- Vacancy / Maint / Mgmt
- −$415
- Net cashflow
- $228
Break-even live
Sensitivity live
| Price | -10% $341 | -5% $284 | +0% $228 | +5% $171 | +10% $115 |
|---|---|---|---|---|---|
| Rent | -10% $72 | -5% $150 | +0% $228 | +5% $306 | +10% $384 |
| Rate | -1.0pp $329 | -0.5pp $279 | base $228 | +0.5pp $176 | +1.0pp $123 |
UW: 25.0% down · 7.5% · 30yr · 1.5% tax · 5.0% vac · 8.0% maint · 8.0% mgmt
Financing live
Cash to close
- Down payment
- $49,975
- Closing costs
- $5,997
- Reserves months
- —
- Total cash needed
- —
Loan-product check · same deal, 3 products live
Conventional
25% down · 7.5% · 30yr
- Down + closing
- —
- Monthly P&I
- —
- Monthly cashflow
- —
- DSCR
- —
- Eligible?
- —
Personal DTI + credit; lowest rate.
DSCR
20% down · 8.5% · 30yr
- Down + closing
- —
- Monthly P&I
- —
- Monthly cashflow
- —
- DSCR
- —
- Eligible?
- —
No personal income docs; deal must DSCR.
Hard money
10% down · 12.0% · 12mo
- Down + closing
- —
- Monthly P&I
- —
- Monthly cashflow
- —
- DSCR
- —
- Eligible?
- —
Short-term bridge; refi at stabilization.
Rent comps 1 comps
| Address | Beds | Baths | Sqft | Rent | $/sqft | DOM | Units | Dist |
|---|---|---|---|---|---|---|---|---|
| 211 Columbia St Mishawaka, IN | 4.0 | 2.5 | 1500 | $1,795 | $1.20 | 23d | 1 | 1.01mi |
Listing history 8 events
-
2026-06-22days on market $199,900 Active 10 DOM
-
2026-06-18days on market $199,900 Active 7 DOM
-
2026-06-17days on market $199,900 Active 6 DOM
-
2026-06-16days on market $199,900 Active 5 DOM
-
2026-06-15days on market $199,900 Active 4 DOM
-
2026-06-14days on market $199,900 Active 2 DOM
-
2026-06-13remarks 681-char remark
-
2026-06-13$199,900 Active 1 DOM
ⓘ Source: listings_history table (triggers on properties + properties_extension) + one-shot
backfill from property_details.listing_events for pre-trigger history.
Tax reassessment forecast IN · Partial reset (capped growth)
- Current annual tax
- $2,440 · $203/mo
- Projected year-2 tax
- $2,440 · $203/mo
- Expected delta
- $0/yr ($0/mo · 0.0%)
ⓘ Screening estimate from a state-policy table — verify with the county assessor before closing.
Climate risk First Street
- Flood 1/10 Low FEMA zone X (unshaded) · 0% chance over 30 yrs
- Wildfire 1/10 Low
- Heat 3/10 Moderate 7 d/yr ≥100°F today · 16 d/yr by 30 yrs out
- Wind 2/10 Low
- Air quality 3/10 Moderate 2 unhealthy d/yr today · 3 by 30 yrs out
Nearby sold comps map
Loading sold comps map…
Walkable amenities ~0.75 mi
Loading nearby amenities…
Taxation est. · year 1
- Rental income
- $23,738
- − Mortgage interest
- −$11,198
- − Property taxes
- −$2,440
- − Insurance
- −$1,000
- − Repairs & maintenance
- −$1,899
- − Management
- −$1,899
- − Depreciation
- −$5,815
- Taxable loss
- −$512
- Est. tax savings @ 24.0%
- +$123
- After-tax cash flow
- $2,857/yr
For passive investors: Depreciation is non-cash, so a rental often shows a tax loss while cash-flowing — sheltering income. Rental losses are passive: they offset passive income freely, and up to $25,000/yr can offset ordinary (W-2) income if you actively participate and your MAGI is under $100k (phasing out to $0 by $150k); unused losses carry forward. On sale, claimed depreciation is recaptured at up to 25%, and gains may owe capital-gains tax (a 1031 exchange can defer both). Figures are a year-1 estimate at your 24.0% rate — not tax advice; consult a CPA.
Schools (NCES district)
- District
- School City Of Mishawaka
- NCES district ID
- 1806840
- Math proficiency
- 23% ▼ -9.00%
- Reading proficiency
- 30% ▼ -7.00%
- Median HH income
- $39,290
- Composite
- 22.26/100
- National rank
- #8143
- State rank
- #260 of 301 in IN
Livability — Mishawaka
- Score
- 76/100
- State rank
- #53
- US rank
- #3586
Category grades
Schools grade is shown separately in the Schools card above.
Census & demographics
- Census place
- Mishawaka, IN
- County
- Saint Joseph County · 189,048 people
- City population
- 57,683
- Metro
- South Bend-Mishawaka, IN-MI
- Population (ZIP)
- 26,606
- Household income
- $56,865
- Rent vs Own
- Severe rent burden
- 1243.0
Population outlook (St. Joseph County) Hauer SSP2
- Today (2025)
- 273,186 people
- By 2030
- 273,594 · +0.1%
- By 2040
- 271,641 · -0.6%
- By 2050
- 269,187 · -1.5%
- By 2075
- 263,136 · -3.7%
- By 2100
- 245,659 · -10.1%
Race, ethnicity, and origin ACS 2023
- Neighborhood character
- Predominantly White (78%)
- Race & ethnicity
- White 78% Two or more races 8% Black 7% Hispanic / Latino 6% Asian 3%
- Hispanic origin (detail)
- Mexican 2%
- Common ancestry
- Romanian 6% Lithuanian 2% English 2%
- Foreign-born
- 8% · Canada, China, South Korea
- Languages at home
- 90% English-only · Spanish 4% Chinese 1% Other Indo-European 1%
Political lean MEDSL · St. Joseph
- 2024 margin
- Toss-up / Even · D 50.0% · R 48.5% · Other 1.5%
- 2008→2024 swing
- -15.6pp toward R · 2008: 17.1pp · 2024: 1.5pp
- All cycles
- 2024: D+1.5 2020: D+5.8 2016: D+0.2 2012: D+3.5 2008: D+17.1
Not yet ingested
- Civics
- —
Market trends
- HPI YoY
- ▼ -114.83%
- Current HPI
- 188.2811
- Rent YoY
- ▲ 5.20%
- Metro
- South Bend-Mishawaka, IN-MI
- State GDP YoY
- ▲ 2.90%
- F500 in state
- 18
Industry mix (Fortune 500 HQ in IN)
| Industry | F500 HQs | Revenue |
|---|---|---|
| Industrial Machinery | 2 | $37B |
|
||
| Healthcare | 1 | $177B |
|
||
| Pharmaceuticals | 1 | $45B |
|
||
| Metals / Steel | 1 | $18B |
|
||
| Agriculture | 1 | $17B |
|
||
| Packaging | 1 | $12B |
|
||
Price history
+124.6% since first listed4 events — show timeline
- 2026-06-11 Listed $199,900 IRMLS
- 2021-10-29 Sold (MLS) $70,500 IRMLS
- 2021-09-23 Listed $75,000 IRMLS
- 2021-07-27 Listed $89,000 IRMLS
Property tax history
+5.2%/yrLatest (2025): $2,440 · +31.7% YoY. Source: county tax records.
Cash-flow waterfall
monthlySold comps — $/sqft
last 12 mo · ≤1 miLoading sold comps…