24 Stonewood Ter · Vernon, CT
Flood risk 1/10 · Minimal
- FEMA flood zone
- X
- Chance of flooding over 30 yrs
- 0.0%
- Est. flood insurance / yr
- $507 – $1,088
Fire risk 4/10 · Minor
- Est. fire insurance / yr
- $829 – $1,539
Heat risk 4/10 · Minor
- Hot days now (above 93°F)
- 7 days/yr
- Hot days in 30 yrs
- 16 days/yr
Wind risk 6/10 · Moderate
- Chance of severe wind over 30 yrs
- 27.0%
Air-quality risk 3/10 · Minor
- Unhealthy air days now
- 3 days/yr
- Unhealthy air days in 30 yrs
- 4 days/yr
Risk factors via First Street. Map © Google.
Why this score? — see what drove the C+ grade
The composite is a weighted blend of 9 inputs, each scored 0–100. Each bar is that input's sub-score; the figure is the points it added to the 100-point composite (weight × sub-score).
- Cash flow +25.1/30.0
- 1% rule +10.0/10.0
- DSCR +8.2/10.0
- ARV discount +7.5/15.0
- Rent growth +3.7/5.0
- Schools +3.6/10.0
- Livability +2.5/5.0
- Condition / age +2.5/5.0
- Appreciation +0.0/10.0
$110,000
🖨 Deal sheet 📄 Offer letter ✓ Due diligence
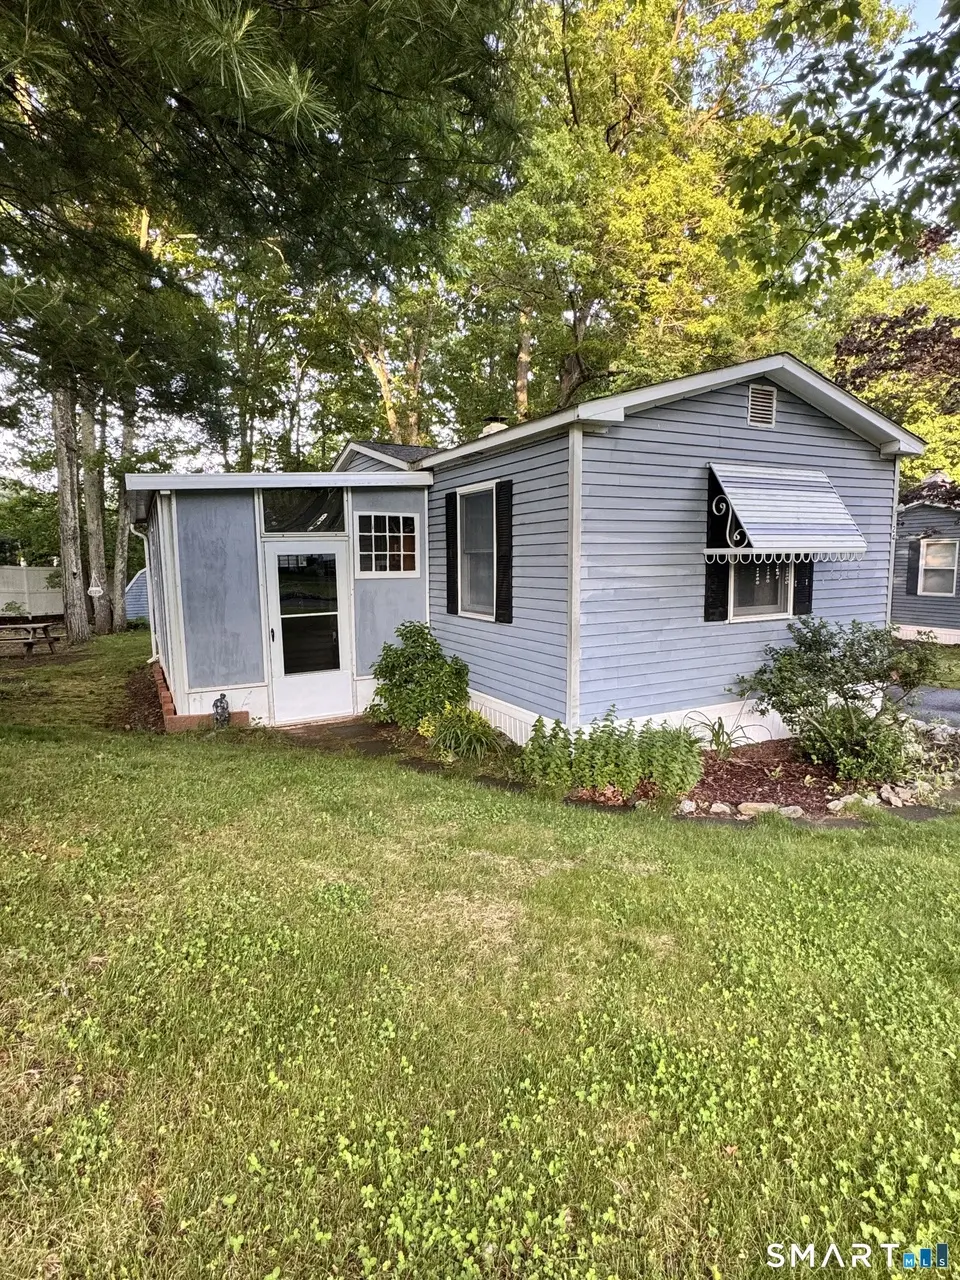
Listing remarks
This unt sits at the back of the complex. Nice yard area to enjoy, 2 bedrooms 1.5 baths, Living has a fireplace, large eat in kitchen, laundry just off the kitchen. Great home to relax in. Being sold in as is condition. Inspections for information purposes only. Park approval is needed before an offer can be submitted. Buyer must have credit score of 650 or higher and income of $1800+ a month.
Key facts
- Eat in kitchen
- Laundry off kitchen
- Yard area
Tags
Property features AI
Finance
- HOA & community: Homeowners association with $500 monthly fee; HOA covers snow removal, water and sewer
Exterior
- Utilities: Public water connected; Public sewer connected; Electric hot water
- Home design: Single-family home; Prefabricated construction
- Construction: Asphalt shingle roof; Prefab construction; No foundation specified
- Exterior features: Level lot; Vinyl siding
Interior
- Kitchen: Oven/Range; Refrigerator
- Bedrooms: 2 bedrooms
- Bathrooms: 1 full bathroom; 1 half bathroom
- Heating & cooling: Central air conditioning; Hot air heating (oil-fired), above-ground fuel tank
- Interior features: One fireplace; No basement
- Laundry & utility: Washer; Dryer; Main-level laundry
Neighborhood map
What this means for you Summary
Snapshot
- This is a 2-bed/1.0-bath manufactured listed at $110k.
Deal economics
- At list price, monthly cash flow is $242 ($3k/yr) — positive.
- The deal already cash-flows at list — no discount required.
- Meets the 1% rule at list price ($2k rent vs $110k).
- Recommended offer: $108k (1.5% below list) — sets the bar for market timing.
Location & tenants
- Location reads: area grade C — affects rentability + tenant quality, not the cash-flow math above.
- Vernon School District (suburban): math 34% / reading 48% proficiency, ranked #97 of 153 in CT (top 63%) — families likely to look elsewhere, expect single-tenant / working-renter base with shorter leases.
- Zoned schools: Rockville High School (math 22% / reading 52%, grade F, #112 of 194 statewide, top 60%, 932 students, 48% FRL).
- Market conditions: Rents rising fast (+4.7%/yr); 81 active listings in the ZIP; 9 comparable units currently listed for rent nearby; rentals leasing fast (median 3d on market — plan ~1-2 weeks tenant-placement turnaround); solid renter incomes; 1,867 units permitted in Capitol Planning Region in 2024 (1,399 in 5+ unit buildings).
Forward outlook
- Local home prices are declining (-3.0%/yr); year-one equity from $761 of loan paydown is wiped out by about $3k of value loss. Plan a longer hold.
- At projected returns (-3.0% appreciation + 4.7% rent growth), your $31k cash investment doubles in ~9 years — after that, you're playing with house money.
Negotiation context
- It's been on market 21 days — a 2% lower offer ($108k) is reasonable based on typical stale-listing flexibility.
- 2 sale attempts since 11y ago with the ask held roughly flat each time — persistent listings suggest the price (not the market) is what's stuck; bring a comps-based counter.
- Current owner paid $7k; list at $110k implies a 1471% gain — meaningful room to come down on a strong offer.
Risks & watch-outs
- Watch-outs: HOA is 28% of rent.
- Climate carrying-cost: major wind risk, 27% chance of damaging wind over 30y — expect insurance premiums to compound above CPI over the hold.
Questions for the listing agent
- What does the HOA fee cover, when was the last increase, and are there any pending special assessments or reserve-fund shortfalls?
- Is there a deadline driving the sale (1031 exchange, divorce, estate, relocation)? That informs how much negotiation room exists.
- What's the average days-on-market for RENTAL listings here right now (not sales)? A rising rental-DOM trend means longer vacancies and softer asking-rent achievability than the comps imply.
- What's the recent tenant-quality profile in this submarket — average credit score on applications, eviction rate, late-payment / NSF rate, and stable-employment percentage? A property-management company in the area should have these aggregated.
- How much new for-sale + rental construction is in the pipeline within 1–3 miles? Heavy new supply typically softens prices + rents 12–24 months out; constrained supply supports both.
Investment metrics
- 1% rule
- 1.64% ✓
- Cap rate
- 8.93%
- Cash-on-cash
- 9.43%
- DSCR
- 1.42
- GRM
- 5.1
CMA / ARV
No comps found within radius.
Projected returns pro-forma
-3.0% appreciation · 4.73% rent growth · sell at horizon
- IRR
- 0.9%
- Equity multiple
- 1.03×
- Total profit
- $1,073
- Equity at exit
- $16,401
- IRR
- 13.0%
- Equity multiple
- 2.15×
- Total profit
- $35,546
- Equity at exit
- $9,511
Cash invested: $30,800 (down + closing). Projections, not guarantees.
Landlord ↔ Tenant lean methodology
- Overall (STATE)
- 27 Tenant-Leaning
- State Connecticut
- 27 Tenant-Leaning · D+7
- County
- — inherits STATE
- City
- — inherits STATE
ZIP-level market 06066
- Rents YoY
- 4.7%
- Active inventory
- 81
- Price-to-rent
- 5.1×
Monthly cashflow live
- Estimated rent
- $1,806 high interval (Pro) →
- Mortgage (P&I)
- −$577
- Tax from tax record
- −$62 /mo · $749/yr
- Insurance
- −$46
- HOA
- −$500
- Vacancy / Maint / Mgmt
- −$379
- Net cashflow
- $242
Break-even live
UW: 25.0% down · 7.5% · 30yr · 1.5% tax · 5.0% vac · 8.0% maint · 8.0% mgmt
Financing live
Cash to close
- Down payment
- $27,500
- Closing costs
- $3,300
- Reserves months
- —
- Total cash needed
- —
Loan-product check · same deal, 3 products live
Conventional
25% down · 7.5% · 30yr
- Down + closing
- —
- Monthly P&I
- —
- Monthly cashflow
- —
- DSCR
- —
- Eligible?
- —
Personal DTI + credit; lowest rate.
DSCR
20% down · 8.5% · 30yr
- Down + closing
- —
- Monthly P&I
- —
- Monthly cashflow
- —
- DSCR
- —
- Eligible?
- —
No personal income docs; deal must DSCR.
Hard money
10% down · 12.0% · 12mo
- Down + closing
- —
- Monthly P&I
- —
- Monthly cashflow
- —
- DSCR
- —
- Eligible?
- —
Short-term bridge; refi at stabilization.
Rent comps 9 comps
| Address | Beds | Baths | Sqft | Rent | $/sqft | DOM | Units | Dist |
|---|---|---|---|---|---|---|---|---|
| 1134 Hartford Tpke Vernon, CT | 2.0 | 1.0 | 910 | $1,750 | $1.92 | 1d | 1 | 0.52mi |
| 23 Bancroft Rd Vernon, CT | 3.0 | 1.0 | 1020 | $3,000 | $2.94 | 43d | 1 | 0.88mi |
| 85 Vernon Ave Unit 1 Vernon, CT | 1.0 | 1.0 | 600 | $1,250 | $2.08 | 3d | 1 | 0.95mi |
| 37 S Grove St Unit 37 Vernon, CT | 2.0 | 1.0 | 931 | $1,850 | $1.99 | 1d | 1 | 1.07mi |
| 31 Vernon Ave Vernon, CT | 1.0 | 1.0 | 720 | $1,295 | $1.80 | 1d | 1 | 1.16mi |
| 105 Brooklyn St Fl 2 Vernon, CT | 2.0 | 1.0 | 980 | $1,780 | $1.82 | 3d | 1 | 1.24mi |
| 10 Cemetary Ave Vernon, CT | 2.0 | 1.0 | 1008 | $2,100 | $2.08 | 43d | 1 | 1.25mi |
| 9 Morrison St Unit 2 Vernon, CT | 1.0 | 1.0 | 525 | $1,200 | $2.29 | 19d | 1 | 1.31mi |
| 98 W Main St Unit 2B Vernon, CT | 1.0 | 1.0 | 715 | $1,200 | $1.68 | 2d | 1 | 1.33mi |
HOA detail
- Monthly dues
- $500 · $6,000/yr
Listing history 19 events
-
2026-06-18days on market $110,000 Active 21 DOM
-
2026-06-17days on market $110,000 Active 20 DOM
-
2026-06-16days on market $110,000 Active 19 DOM
-
2026-06-15days on market $110,000 Active 18 DOM
-
2026-06-13days on market $110,000 Active 16 DOM
-
2026-06-13days on market $110,000 Active 15 DOM
-
2026-06-10days on market $110,000 Active 13 DOM
-
2026-06-09days on market $110,000 Active 12 DOM
-
2026-06-08days on market $110,000 Active 11 DOM
-
2026-06-07days on market $110,000 Active 10 DOM
-
2026-06-03days on market $110,000 Active 6 DOM
-
2026-06-02days on market $110,000 Active 5 DOM
-
2026-06-02remarks 396-char remark
-
2026-06-01days on market $110,000 Active 4 DOM
-
2026-05-31days on market $110,000 Active 3 DOM
-
2026-05-28$110,000 Active
-
2015-09-14soldstatus $7,000
-
2015-09-11soldstatus $7,000
-
2015-03-28$11,900
ⓘ Source: listings_history table (triggers on properties + properties_extension) + one-shot
backfill from property_details.listing_events for pre-trigger history.
Tax reassessment forecast CT · Partial reset (capped growth)
- Current annual tax
- $749 · $62/mo
- Projected year-2 tax
- $1,552 · $129/mo
- Expected delta
- +$802/yr (+$67/mo · 107.1%)
ⓘ Screening estimate from a state-policy table — verify with the county assessor before closing.
Climate risk First Street
- Flood 1/10 Low FEMA zone X · 0% chance over 30 yrs
- Wildfire 4/10 Moderate
- Heat 4/10 Moderate 7 d/yr ≥93°F today · 16 d/yr by 30 yrs out
- Wind 6/10 Major 27% chance of damaging wind over 30 yrs
- Air quality 3/10 Moderate 3 unhealthy d/yr today · 4 by 30 yrs out
Nearby sold comps map
Loading sold comps map…
Walkable amenities ~0.75 mi
Loading nearby amenities…
Taxation est. · year 1
- Rental income
- $21,677
- − Mortgage interest
- −$6,162
- − Property taxes
- −$749
- − Insurance
- −$550
- − Repairs & maintenance
- −$1,734
- − Management
- −$1,734
- − HOA
- −$6,000
- − Depreciation
- −$3,200
- Taxable income
- $1,548
- Est. tax owed @ 24.0%
- −$371
- After-tax cash flow
- $2,532/yr
For passive investors: Depreciation is non-cash, so a rental often shows a tax loss while cash-flowing — sheltering income. Rental losses are passive: they offset passive income freely, and up to $25,000/yr can offset ordinary (W-2) income if you actively participate and your MAGI is under $100k (phasing out to $0 by $150k); unused losses carry forward. On sale, claimed depreciation is recaptured at up to 25%, and gains may owe capital-gains tax (a 1031 exchange can defer both). Figures are a year-1 estimate at your 24.0% rate — not tax advice; consult a CPA.
Schools (NCES district)
- District
- Vernon School District
- NCES district ID
- 0904680
- Math proficiency
- 34% ▼ -11.00%
- Reading proficiency
- 48% ▼ -6.00%
- Median HH income
- $60,342
- Composite
- 36.26/100
- National rank
- #4704
- State rank
- #97 of 153 in CT
Livability — Vernon
No livability data for this city. (Only ~50 U.S. cities are tracked.)
Census & demographics
- County
- Tolland County · 46,815 people
- Metro
- Hartford-East Hartford-Middletown, CT
- Population (ZIP)
- 30,577
- Household income
- $85,356
- Rent vs Own
- Severe rent burden
- 1140.0
Population outlook (Capitol County) Hauer SSP2
- By 2040
- 1,063,519
Race, ethnicity, and origin ACS 2023
- Neighborhood character
- Predominantly White (71%)
- Race & ethnicity
- White 71% Hispanic / Latino 12% Two or more races 7% Asian 6% Black 5%
- Hispanic origin (detail)
- Mexican 1% Puerto Rican 9%
- Common ancestry
- Lithuanian 8% Romanian 7% Slovak 2%
- Foreign-born
- 11% · Canada, China, South Korea
- Languages at home
- 84% English-only · Spanish 6% Other Indo-European 5% Russian/Polish/Slavic 1%
Political lean MEDSL · Capitol
- 2024 margin
- Strong D (+21.9) · D 60.1% · R 38.2% · Other 1.7%
- All cycles
- 2024: D+21.9
Not yet ingested
- Civics
- —
Market trends
- HPI YoY
- ▼ -136.25%
- Current HPI
- 249.7888
- Rent YoY
- ▲ 4.73%
- Metro
- Hartford-East Hartford-Middletown, CT
- State GDP YoY
- ▲ 1.06%
- F500 in state
- 38
Industry mix (Fortune 500 HQ in CT)
| Industry | F500 HQs | Revenue |
|---|---|---|
| Industrial Machinery | 4 | $38B |
|
||
| Insurance | 3 | $71B |
|
||
| Financial Services | 2 | $25B |
|
||
| Transportation / Logistics | 2 | $18B |
|
||
| Healthcare | 1 | $247B |
|
||
| Telecommunications | 1 | $55B |
|
||
Price history
+824.4% since first listed4 events — show timeline
- 2026-05-28 Listed $110,000 Smart MLS
- 2015-09-14 Sold (Public Records) $7,000 Public Records
- 2015-09-11 Sold (MLS) $7,000 Smart MLS
- 2015-03-28 Listed $11,900 Smart MLS
Property tax history
-2.9%/yrLatest (2023): $749 · +0.0% YoY. Source: county tax records.
Cash-flow waterfall
monthlySold comps — $/sqft
last 12 mo · ≤1 miLoading sold comps…