11045 Woodview Dr · Conroe, TX
Flood risk 1/10 · Minimal
- FEMA flood zone
- X (unshaded)
- Chance of flooding over 30 yrs
- 0.0%
- Est. flood insurance / yr
- $507 – $1,088
Fire risk 5/10 · Moderate
- Est. fire insurance / yr
- $1,222 – $2,270
Heat risk 8/10 · Major
- Hot days now (above 110°F)
- 7 days/yr
- Hot days in 30 yrs
- 24 days/yr
Wind risk 8/10 · Major
- Chance of severe wind over 30 yrs
- 99.0%
Air-quality risk 2/10 · Minimal
- Unhealthy air days now
- 1 days/yr
- Unhealthy air days in 30 yrs
- 1 days/yr
Risk factors via First Street. Map © Google.
Why this score? — see what drove the D+ grade
The composite is a weighted blend of 9 inputs, each scored 0–100. Each bar is that input's sub-score; the figure is the points it added to the 100-point composite (weight × sub-score).
- Cash flow +14.4/30.0
- ARV discount +12.1/15.0
- Schools +5.1/10.0
- DSCR +4.4/10.0
- Livability +3.7/5.0
- 1% rule +3.3/10.0
- Condition / age +2.5/5.0
- Rent growth +2.4/5.0
- Appreciation +0.0/10.0
$209,900
🖨 Deal sheet (PDF) 📄 Offer letter ✓ Due diligence
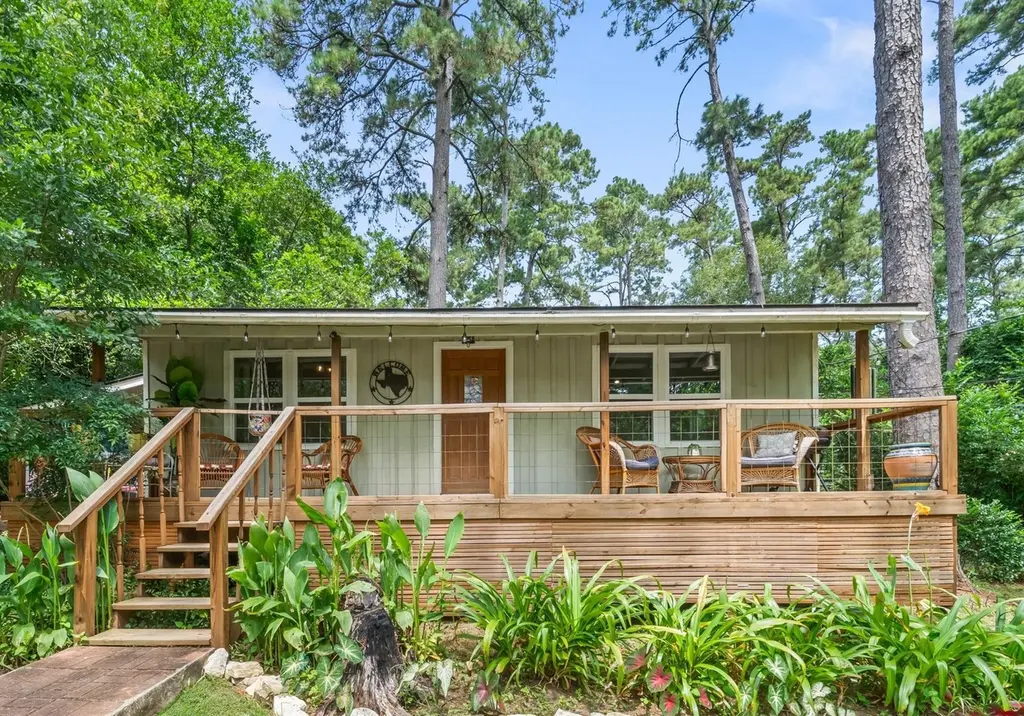
Listing remarks
Welcome to Lake Rollingwood. This is a fantastic opportunity to own an affordable home, with proven success as an income producing investment property. (previous Airbnb, now owner occupied) OR, the perfect home nestled in the woods. This cottage style home offers 3 bedrooms, 1 full bath in a quiet wooded subdivision. UPGRADES including stainless steel appliances, all new flooring, new windows, interior painting, new cabinetry/countertops, completely remodeled bathroom. The kitchen is open to the large family room which creates a welcoming space for you, family, & guests. Generously sized primary bedroom as well as the 2 secondary bedrooms are equally spacious & comfortable. Wheth
Key facts
- Remodeled bathroom
- New flooring
- Interior painting
Tags
Property features AI
Finance
- Other: Building area listed as 1,156; Lot size about 0.1864 acres
Exterior
- Parking: No designated parking listed
- Utilities: Septic tank
- Home design: Residential property; Faces south; Single-story entry (first-floor living areas)
- Construction: Wood siding; Composition roof; Pillar/post/pier foundation; Built in 1970
- Exterior features: Wooded lot; Asphalt road access
Interior
- Kitchen: Electric cooktop; Oven; Microwave; Garbage disposal
- Bedrooms: Primary bedroom on the first floor (approx. 13x14); Two additional first-floor bedrooms (approx. 10x10 and 10x14)
- Flooring: Laminate
- Bathrooms: 1 full bathroom
- Heating & cooling: Central heating (gas); Central air conditioning (electric)
- Interior features: Kitchen and family room combined; Free-standing fireplace (1)
- Laundry & utility: Washer hookup; Electric dryer hookup
Neighborhood map
What this means for you Summary
Snapshot
- This is a 3-bed/1.0-bath single-family listed at $210k.
Deal economics
- At list price, monthly cash flow is $41 ($492/yr) — positive.
- The deal already cash-flows at list — no discount required.
- To meet the 1% rule (rent ≥ 1% of price), the offer needs to be $174k (17.0% below list).
- Recommended offer: $174k (17.0% below list) — sets the bar for 1% rule.
- Cap rate 6.5% vs local median 3.1% in Conroe — top-decile yield for the area; either an underpriced asset or a hidden risk that comps aren't pricing in. Stress-test before assuming the spread holds.
Location & tenants
- Location reads 74/100 on livability (#169 in TX, #4,447 nationally) — a middle-class / working-renter tenant base. Strengths: cost of living A+, housing A+, amenities B; Watch: commute F, health & safety F.
- Conroe ISD (other): math 57% / reading 57% proficiency, ranked #69 of 826 in TX (top 8%) — acceptable for families but not a draw, mixed tenant base, ~2y average lease.
- Zoned schools: Patterson El (math 33% / reading 35%, grade F, #2,149 of 4,322 statewide, top 50%, 977 students, 74% FRL); Bozman Int (math 44% / reading 40%, grade D-, #572 of 1,662 statewide, top 36%, 988 students, 68% FRL); Conroe H S (math 32% / reading 51%, grade F, #767 of 1,632 statewide, top 47%, 4,915 students, 61% FRL) — zoned schools average 68% FRL vs 34% district-wide (33 pts higher); higher-poverty schools than district average — tighter screening recommended.
- Zoned-school proficiency averages 39% at this address vs 57% district-wide (-18 pts) — the specific schools serving this property underperform the Conroe ISD average; the district grade overstates school quality for this exact location.
- Market conditions: Rents soft (-0.3%/yr); 721 active listings in the ZIP; 2 comparable units currently listed for rent nearby; solid renter incomes; 13,259 units permitted in Montgomery County in 2024 (1,402 in 5+ unit buildings).
Forward outlook
- Local home prices are declining (-3.0%/yr); year-one equity from $1k of loan paydown is wiped out by about $6k of value loss. Plan a longer hold.
- Montgomery County population projected at +65% by 2050 — long-run rental-demand tailwind backs the buy-and-hold thesis.
Negotiation context
- It's been on market 31 days — a 3% lower offer ($204k) is reasonable based on typical stale-listing flexibility.
- 8 sale attempts since 22y ago with the ask held roughly flat each time — persistent listings suggest the price (not the market) is what's stuck; bring a comps-based counter.
Risks & watch-outs
- Climate carrying-cost: severe wind risk, 99% chance of damaging wind over 30y; moderate wildfire risk; extreme-heat days projected 7→24/yr by 2055 (HVAC capex compounding) — expect insurance premiums to compound above CPI over the hold.
Questions for the listing agent
- It's been on market 31 days. Have you received any prior offers? Is the seller open to a 17% concession, seller financing, or rate buy-down credit?
- Built in 1970 — when were the roof, HVAC, electrical panel, plumbing, and water heater last replaced?
- Is there a deadline driving the sale (1031 exchange, divorce, estate, relocation)? That informs how much negotiation room exists.
- Schools are D-rated, which usually means shorter tenancies and higher turnover. Who's the typical renter profile here, and what's been the actual vacancy rate?
- The area grade is low — what's the realistic commute time and amenity access for the typical tenant pool here? Any planned neighborhood developments (good or bad) we should know about?
- What's the average days-on-market for RENTAL listings here right now (not sales)? A rising rental-DOM trend means longer vacancies and softer asking-rent achievability than the comps imply.
- What's the recent tenant-quality profile in this submarket — average credit score on applications, eviction rate, late-payment / NSF rate, and stable-employment percentage? A property-management company in the area should have these aggregated.
- How much new for-sale + rental construction is in the pipeline within 1–3 miles? Heavy new supply typically softens prices + rents 12–24 months out; constrained supply supports both.
Investment metrics
- 1% rule
- 0.83% ✗
- Cap rate
- 6.53%
- Cash-on-cash
- 0.84%
- DSCR
- 1.04
- GRM
- 10.0
CMA / ARV
- ARV (on-the-fly)
- $233,512
- Comps found
- 3
Show comp detail 3 sales within ~0.75 mi
| Address | Dist | Beds/Ba | Sqft | Sold | Price | $/sf | Match |
|---|---|---|---|---|---|---|---|
| 12340 Rollingwood Loop | 0.02mi | 3/1.5 | 1,240 (+7%) | 18mo | $170,000 | $137 | 70 |
| 11630 Greenfield Dr | 0.53mi | 2/2.0 (-1) | 1,044 (-10%) | 12mo | $235,000 | $225 | 40 |
| 10505 Champion Village Rd | 0.59mi | 2/1.5 (-1) | 1,210 (+5%) | 22mo | $245,000 | $202 | 40 |
Match score weights: distance 35% · size 25% · config 20% · recency 20%. Top-matched comps best support the ARV.
Projected returns pro-forma
-3.0% appreciation · 0.0% rent growth · sell at horizon
- IRR
- -18.1%
- Equity multiple
- 0.38×
- Total profit
- $-36,553
- Equity at exit
- $31,297
- IRR
- -17.1%
- Equity multiple
- 0.18×
- Total profit
- $-48,387
- Equity at exit
- $18,148
Cash invested: $58,772 (down + closing). Projections, not guarantees.
Landlord ↔ Tenant lean methodology
- Overall (STATE)
- 87 Strongly Landlord-Friendly
- State Texas
- 87 Strongly Landlord-Friendly · R+5
- County
- — inherits STATE
- City
- — inherits STATE
ZIP-level market 77303
- Home prices YoY
- -22.4%
- Rents YoY
- -0.3%
- Active inventory
- 721
- Price-to-rent
- 10.0×
Monthly cashflow live
- Estimated rent
- $1,743 medium interval (Pro) →
- Mortgage (P&I)
- −$1,101
- Tax from tax record
- −$148 /mo · $1,775/yr
- Insurance
- −$87
- HOA
- −$0
- Vacancy / Maint / Mgmt
- −$366
- Net cashflow
- $41
Break-even live
Sensitivity live
| Price | -10% $160 | -5% $100 | +0% $41 | +5% $-18 | +10% $-78 |
|---|---|---|---|---|---|
| Rent | -10% $-97 | -5% $-28 | +0% $41 | +5% $110 | +10% $179 |
| Rate | -1.0pp $147 | -0.5pp $94 | base $41 | +0.5pp $-13 | +1.0pp $-69 |
UW: 25.0% down · 7.5% · 30yr · 1.5% tax · 5.0% vac · 8.0% maint · 8.0% mgmt
Financing live
Cash to close
- Down payment
- $52,475
- Closing costs
- $6,297
- Reserves months
- —
- Total cash needed
- —
Loan-product check · same deal, 3 products live
Conventional
25% down · 7.5% · 30yr
- Down + closing
- —
- Monthly P&I
- —
- Monthly cashflow
- —
- DSCR
- —
- Eligible?
- —
Personal DTI + credit; lowest rate.
DSCR
20% down · 8.5% · 30yr
- Down + closing
- —
- Monthly P&I
- —
- Monthly cashflow
- —
- DSCR
- —
- Eligible?
- —
No personal income docs; deal must DSCR.
Hard money
10% down · 12.0% · 12mo
- Down + closing
- —
- Monthly P&I
- —
- Monthly cashflow
- —
- DSCR
- —
- Eligible?
- —
Short-term bridge; refi at stabilization.
Rent comps 2 comps
| Address | Beds | Baths | Sqft | Rent | $/sqft | DOM | Units | Dist |
|---|---|---|---|---|---|---|---|---|
| 10828 Champion Forest Loop Unit 110124 Conroe, TX | 2.0 | 2.0 | 1308 | $1,293 | $0.99 | 45d | 1 | 0.93mi |
| 1516 Sunset Ridge Dr Conroe, TX | 3.0 | 2.0 | 1273 | $1,600 | $1.26 | 45d | 1 | 1.41mi |
Listing history 37 events
-
2026-06-21days on market $209,900 Active 31 DOM
-
2026-06-18days on market $209,900 Active 28 DOM
-
2026-06-17days on market $209,900 Active 27 DOM
-
2026-06-16days on market $209,900 Active 26 DOM
-
2026-06-15days on market $209,900 Active 25 DOM
-
2026-06-13days on market $209,900 Active 23 DOM
-
2026-06-09days on market $209,900 Active 19 DOM
-
2026-06-08days on market $209,900 Active 18 DOM
-
2026-06-07days on market $209,900 Active 17 DOM
-
2026-06-04days on market $209,900 Active 14 DOM
-
2026-06-03days on market $209,900 Active 13 DOM
-
2026-06-02days on market $209,900 Active 12 DOM
-
2026-06-01days on market $209,900 Active 11 DOM
-
2026-05-31days on market $209,900 Active 10 DOM
-
2026-05-21$209,900 Active
-
2025-11-12historical
-
2025-08-25price $199,000
-
2025-08-02$209,900 Active
-
2024-08-29historical
-
2024-07-17$209,900 Active
-
2024-07-10historical
-
2024-04-04price $214,900
-
2024-03-18$224,900 Active
-
2024-03-18historical
-
2024-03-01$224,900 Active
-
2024-02-27historical
-
2022-10-03soldstatus
-
2022-09-30soldstatus Sold
-
2022-09-06status Pending
-
2022-08-27status Option Pending
-
2022-07-05price $1,570
-
2022-06-18price $152,990
-
2022-05-03$162,990 Active
-
2004-09-22historical
-
2004-06-22$64,990
-
2004-06-13historical
-
2004-01-09$69,990
ⓘ Source: listings_history table (triggers on properties + properties_extension) + one-shot
backfill from property_details.listing_events for pre-trigger history.
Tax reassessment forecast TX · Resets to sale price
- Current annual tax
- $1,775 · $148/mo
- Projected year-2 tax
- $3,841 · $320/mo
- Expected delta
- +$2,067/yr (+$172/mo · 116.5%)
ⓘ Screening estimate from a state-policy table — verify with the county assessor before closing.
Climate risk First Street
- Flood 1/10 Low FEMA zone X (unshaded) · 0% chance over 30 yrs
- Wildfire 5/10 Major
- Heat 8/10 Severe 7 d/yr ≥110°F today · 24 d/yr by 30 yrs out
- Wind 8/10 Severe 99% chance of damaging wind over 30 yrs
- Air quality 2/10 Low 1 unhealthy d/yr today · 1 by 30 yrs out
Nearby sold comps map
Loading sold comps map…
Walkable amenities ~0.75 mi
Loading nearby amenities…
Taxation est. · year 1
- Rental income
- $20,918
- − Mortgage interest
- −$11,758
- − Property taxes
- −$1,775
- − Insurance
- −$1,050
- − Repairs & maintenance
- −$1,673
- − Management
- −$1,673
- − Depreciation
- −$6,106
- Taxable loss
- −$3,117
- Est. tax savings @ 24.0%
- +$748
- After-tax cash flow
- $1,240/yr
For passive investors: Depreciation is non-cash, so a rental often shows a tax loss while cash-flowing — sheltering income. Rental losses are passive: they offset passive income freely, and up to $25,000/yr can offset ordinary (W-2) income if you actively participate and your MAGI is under $100k (phasing out to $0 by $150k); unused losses carry forward. On sale, claimed depreciation is recaptured at up to 25%, and gains may owe capital-gains tax (a 1031 exchange can defer both). Figures are a year-1 estimate at your 24.0% rate — not tax advice; consult a CPA.
Schools (NCES district)
- District
- Conroe ISD
- NCES district ID
- 4815000
- Math proficiency
- 57% ▼ -6.00%
- Reading proficiency
- 57% ▼ -1.00%
- Median HH income
- $71,541
- Composite
- 50.65/100
- National rank
- #1833
- State rank
- #69 of 826 in TX
Livability — Conroe
- Score
- 74/100
- State rank
- #169
- US rank
- #4447
Category grades
Schools grade is shown separately in the Schools card above.
Census & demographics
- County
- Montgomery County · 663,713 people
- Metro
- Houston-The Woodlands-Sugar Land, TX
- Population (ZIP)
- 28,854
- Household income
- $75,348
- Rent vs Own
- Severe rent burden
- 464.0
Population outlook (Montgomery County) Hauer SSP2
- Today (2025)
- 713,896 people
- By 2030
- 805,263 · +12.8%
- By 2040
- 992,708 · +39.1%
- By 2050
- 1,179,590 · +65.2%
- By 2075
- 1,628,084 · +128.1%
- By 2100
- 1,937,880 · +171.5%
Race, ethnicity, and origin ACS 2023
- Neighborhood character
- Diverse neighborhood (Simpson 0.56)
- Race & ethnicity
- White 54% Hispanic / Latino 38% Two or more races 17% Black 4%
- Hispanic origin (detail)
- Mexican 25%
- Common ancestry
- Lithuanian 1% Romanian 1% Slovak 1%
- Foreign-born
- 13% · Canada, Jamaica
- Languages at home
- 69% English-only · Spanish 31%
Political lean MEDSL · Montgomery
- 2024 margin
- Solid R (+45.5) · D 26.8% · R 72.3%
- 2008→2024 swing
- +7.2pp toward D · 2008: -52.7pp · 2024: -45.5pp
- All cycles
- 2024: R+45.5 2020: R+43.8 2016: R+51.4 2012: R+60.7 2008: R+52.7
Not yet ingested
- Civics
- —
Market trends
- HPI YoY
- ▼ -77.71%
- Current HPI
- 269.5367
- Rent YoY
- ▼ -0.31%
- Metro
- Houston-The Woodlands-Sugar Land, TX
- State GDP YoY
- ▲ 3.95%
- F500 in state
- 110
Industry mix (Fortune 500 HQ in TX)
| Industry | F500 HQs | Revenue |
|---|---|---|
| Energy | 16 | $1,198B |
|
||
| Technology | 5 | $198B |
|
||
| Engineering / Construction | 4 | $72B |
|
||
| Energy Services | 3 | $60B |
|
||
| Utilities | 3 | $41B |
|
||
| Healthcare | 2 | $330B |
|
||
Price history
+199.9% since first listed23 events — show timeline
- 2026-05-21 Listed $209,900 HARMLS
- 2025-11-12 Listing Removed — HARMLS
- 2025-08-25 Price Changed $199,000 HARMLS
- 2025-08-02 Listed $209,900 HARMLS
- 2024-08-29 Listing Removed — HARMLS
- 2024-07-17 Listed $209,900 HARMLS
- 2024-07-10 Listing Removed — HARMLS
- 2024-04-04 Price Changed $214,900 HARMLS
- 2024-03-18 Listing Removed — HARMLS
- 2024-03-18 Listed $224,900 HARMLS
- 2024-03-01 Listed $224,900 HARMLS
- 2024-02-27 Coming Soon — HARMLS
- 2022-10-03 Sold (Public Records) — Public Records
- 2022-09-30 Sold (MLS) — HARMLS
- 2022-09-06 Pending — HARMLS
- 2022-08-27 Pending — HARMLS
- 2022-07-05 Price Changed $1,570 RENT.
- 2022-06-18 Price Changed $152,990 HARMLS
- 2022-05-03 Listed $162,990 HARMLS
- 2004-09-22 Listing Removed — HARMLS
- 2004-06-22 Listed $64,990 HARMLS
- 2004-06-13 Listing Removed — HARMLS
- 2004-01-09 Listed $69,990 HARMLS
Property tax history
+10.0%/yrLatest (2025): $1,775 · +9.6% YoY. Source: county tax records.
Cash-flow waterfall
monthlySold comps — $/sqft
last 12 mo · ≤1 miLoading sold comps…