 🏗️ New Construction
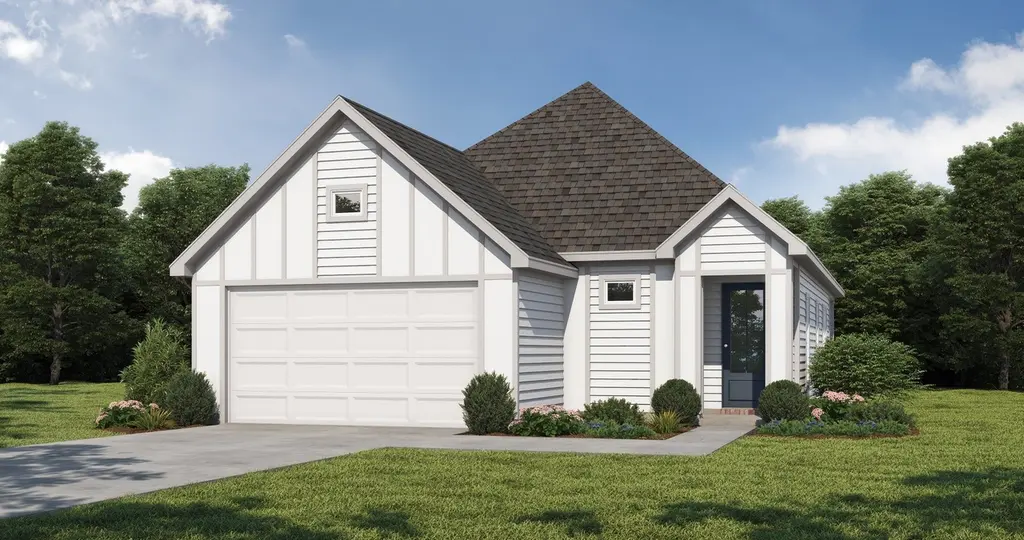
April Plan · Sulphur, LA
Flood risk No data
- FEMA flood zone
- —
- Chance of flooding over 30 yrs
- —
- Est. flood insurance / yr
- —
Fire risk No data
- Est. fire insurance / yr
- —
Heat risk No data
- Hot days now (above threshold)
- —
- Hot days in 30 yrs
- —
Wind risk No data
- Chance of severe wind over 30 yrs
- —
Air-quality risk No data
- Unhealthy air days now
- —
- Unhealthy air days in 30 yrs
- —
Risk factors via First Street. Map © Google.
Why this score? — see what drove the B- grade
The composite is a weighted blend of 9 inputs, each scored 0–100. Each bar is that input's sub-score; the figure is the points it added to the 100-point composite (weight × sub-score).
- Cash flow +30.0/30.0
- DSCR +10.0/10.0
- 1% rule +8.7/10.0
- ARV discount +7.5/15.0
- Livability +3.6/5.0
- Schools +3.1/10.0
- Rent growth +2.5/5.0
- Condition / age +1.0/5.0
- Appreciation +0.0/10.0
$252,600
🖨 Deal sheet 📄 Offer letter ✓ Due diligence
Listing remarks MLS
None
Key facts
- 2 garage spots
- Listed 106 days
Neighborhood map
What this means for you Summary
Snapshot
- This is a 3-bed/2.0-bath single-family listed at $253k. Condition is rated poor.
Deal economics
- At list price, monthly cash flow is $937 ($11k/yr) — positive.
- The deal already cash-flows at list — no discount required.
- Meets the 1% rule at list price ($3k rent vs $253k).
- Recommended offer: $230k (9.0% below list) — sets the bar for market timing.
- Cap rate 11.0% vs local median 8.8% in Sulphur — meaningfully above typical; check what's discounted (condition, days-on-market, listing class) to confirm the premium yield is real.
Location & tenants
- Location reads 71/100 on livability (#48 in LA) — a middle-class / working-renter tenant base. Strengths: cost of living A+, housing A+, schools A; Watch: crime D-, amenities F, commute F.
- Calcasieu Parish (other): math 30% / reading 44% proficiency, ranked #29 of 98 in LA (top 30%) — families likely to look elsewhere, expect single-tenant / working-renter base with shorter leases.
- Market conditions: 236 active listings in the ZIP; 3 comparable units currently listed for rent nearby; rentals lingering (median 44d on market — plan ~5-8 weeks vacancy on turnover, expect pricing pressure); 67% of comp listings sitting > 30 days — soft ceiling on asking rent; 1,298 units permitted in Calcasieu Parish in 2024 (526 in 5+ unit buildings).
Forward outlook
- Local home prices are declining (-3.0%/yr); year-one equity from $2k of loan paydown is wiped out by about $7k of value loss. Plan a longer hold.
- Calcasieu County population projected at +11% by 2050 — modest demand growth; plan on rents tracking national, not racing it.
- At projected returns (-3.0% appreciation + 3.0% rent growth), your $67k cash investment doubles in ~8 years — after that, you're playing with house money.
Negotiation context
- It's been on market 107 days — a 9% lower offer ($230k) is reasonable based on typical stale-listing flexibility.
Questions for the listing agent
- It's been on market 107 days. Have you received any prior offers? Is the seller open to a 9% concession, seller financing, or rate buy-down credit?
- Have any recent inspections been done? Can we get a copy of the seller's disclosures and any deferred-maintenance estimates?
- Why hasn't it sold? Are there any deal-killer items the seller is aware of (foundation, flood, title, zoning, code violations)?
- Is there a deadline driving the sale (1031 exchange, divorce, estate, relocation)? That informs how much negotiation room exists.
- Schools are A-rated — typically a magnet for longer-tenancy family renters. What's the average tenant stay here, and is there a school-zone premium baked into asking?
- Crime grade is D in this area — have there been break-ins, vandalism, or insurance claims at this property in the last 3 years? What carrier currently insures it and at what premium?
- What's the average days-on-market for RENTAL listings here right now (not sales)? A rising rental-DOM trend means longer vacancies and softer asking-rent achievability than the comps imply.
- What's the recent tenant-quality profile in this submarket — average credit score on applications, eviction rate, late-payment / NSF rate, and stable-employment percentage? A property-management company in the area should have these aggregated.
- How much new for-sale + rental construction is in the pipeline within 1–3 miles? Heavy new supply typically softens prices + rents 12–24 months out; constrained supply supports both.
Investment metrics
- 1% rule
- 1.37% ✓
- Cap rate
- 10.98%
- Cash-on-cash
- 16.75%
- DSCR
- 1.75
- GRM
- 6.1
CMA / ARV
- ARV (median comp)
- $239,758
- List price
- $252,600
- Delta
- 5.36%
- Verdict
- FAIR
- Comps
- 20 within 1.0 mi
Show comp detail 12 sales within ~0.75 mi
| Address | Dist | Beds/Ba | Sqft | Sold | Price | $/sf | Match |
|---|---|---|---|---|---|---|---|
| 300 Oak Hampton Dr | 0.23mi | 3/2.0 | 1,508 (-2%) | 15mo | $199,900 | $133 | 74 |
| 277 Paisley Pkwy | 0.47mi | 3/2.0 | 1,616 (+6%) | 2mo | $214,000 | $132 | 67 |
| 305 Paisley Pkwy | 0.44mi | 3/2.0 | 1,618 (+6%) | 4mo | $217,000 | $134 | 67 |
| 235 Aston Ln | 0.49mi | 3/2.0 | 1,563 (+2%) | 10mo | $214,000 | $137 | 65 |
| 148 Orchard Ln | 0.67mi | 3/2.0 | 1,514 (-1%) | 7mo | $207,000 | $137 | 61 |
| 224 Pipers Ln | 0.48mi | 3/2.0 | 1,641 (+7%) | 12mo | $233,900 | $143 | 55 |
| 141 Abella Way | 0.68mi | 3/2.0 | 1,570 (+2%) | 14mo | $220,000 | $140 | 52 |
| 308 Paisley Pkwy | 0.46mi | 3/2.0 | 1,755 (+15%) | 3mo | $233,000 | $133 | 52 |
| 216 Pipers Ln | 0.51mi | 3/2.0 | 1,738 (+14%) | 3mo | $240,000 | $138 | 51 |
| 200 Pipers Ln | 0.55mi | 3/2.0 | 1,703 (+11%) | 15mo | $235,000 | $138 | 43 |
| 336 Fallon Dr | 0.57mi | 3/2.0 | 1,697 (+11%) | 15mo | $228,000 | $134 | 43 |
| 133 Keaton Ct | 0.71mi | 3/2.0 | 1,689 (+10%) | 14mo | $218,500 | $129 | 38 |
Match score weights: distance 35% · size 25% · config 20% · recency 20%. Top-matched comps best support the ARV.
Projected returns pro-forma
-3.0% appreciation · 3.0% rent growth · sell at horizon
- IRR
- 7.9%
- Equity multiple
- 1.31×
- Total profit
- $20,892
- Equity at exit
- $35,749
- IRR
- 17.2%
- Equity multiple
- 2.42×
- Total profit
- $95,260
- Equity at exit
- $20,730
Cash invested: $67,132 (down + closing). Projections, not guarantees.
Landlord ↔ Tenant lean methodology
- Overall (STATE)
- 90 Strongly Landlord-Friendly
- State Louisiana
- 90 Strongly Landlord-Friendly · R+12
- County
- — inherits STATE
- City
- — inherits STATE
ZIP-level market 70665
- Active inventory
- 236
- Price-to-rent
- 6.4×
Monthly cashflow live
- Estimated rent
- $3,284 medium interval (Pro) →
- Mortgage (P&I)
- −$1,257
- Tax est. 1.5%
- −$300 /mo · $3,596/yr
- Insurance
- −$100
- HOA
- −$0
- Vacancy / Maint / Mgmt
- −$690
- Net cashflow
- $937
Break-even live
UW: 25.0% down · 7.5% · 30yr · 1.5% tax · 5.0% vac · 8.0% maint · 8.0% mgmt
Financing live
Cash to close
- Down payment
- $59,939
- Closing costs
- $7,193
- Reserves months
- —
- Total cash needed
- —
Loan-product check · same deal, 3 products live
Conventional
25% down · 7.5% · 30yr
- Down + closing
- —
- Monthly P&I
- —
- Monthly cashflow
- —
- DSCR
- —
- Eligible?
- —
Personal DTI + credit; lowest rate.
DSCR
20% down · 8.5% · 30yr
- Down + closing
- —
- Monthly P&I
- —
- Monthly cashflow
- —
- DSCR
- —
- Eligible?
- —
No personal income docs; deal must DSCR.
Hard money
10% down · 12.0% · 12mo
- Down + closing
- —
- Monthly P&I
- —
- Monthly cashflow
- —
- DSCR
- —
- Eligible?
- —
Short-term bridge; refi at stabilization.
Rent comps 3 comps
| Address | Beds | Baths | Sqft | Rent | $/sqft | DOM | Units | Dist |
|---|---|---|---|---|---|---|---|---|
| 293 Sawyer Dr Sulphur, LA | 4.0 | 2.0 | 2079 | $4,400 | $2.12 | 43d | 1 | 0.43mi |
| 1000 E Carlyss Blvd Sulphur, LA | 1.0–3.0 | 1.0–2.0 | 966 | $2,296 | $2.38 | 13d | 10 | 0.59mi |
| 1141 Mosswood Dr Sulphur, LA | 2.0–3.0 | 2.0–3.5 | 1332 | $2,195 | $1.65 | 43d | 1 | 1.14mi |
Listing history 17 events
-
2026-06-19days on market $252,600 Active 107 DOM
-
2026-06-18days on market $252,600 Active 106 DOM
-
2026-06-17days on market $252,600 Active 105 DOM
-
2026-06-16days on market $252,600 Active 104 DOM
-
2026-06-15days on market $252,600 Active 103 DOM
-
2026-06-14days on market $252,600 Active 101 DOM
-
2026-06-13days on market $252,600 Active 100 DOM
-
2026-06-10days on market $252,600 Active 98 DOM
-
2026-06-09days on market $252,600 Active 97 DOM
-
2026-06-08days on market $252,600 Active 96 DOM
-
2026-06-07days on market $252,600 Active 95 DOM
-
2026-06-05days on market $252,600 Active 92 DOM
-
2026-06-02days on market $252,600 Active 90 DOM
-
2026-06-01days on market $252,600 Active 89 DOM
-
2026-05-31days on market $252,600 Active 88 DOM
-
2026-05-30days on market $252,600 Active 87 DOM
-
2026-03-04$252,600 Active 4-char remark
Show marketing remark (4 chars)
None
ⓘ Source: listings_history table (triggers on properties + properties_extension) + one-shot
backfill from property_details.listing_events for pre-trigger history.
Nearby sold comps map
Loading sold comps map…
Walkable amenities ~0.75 mi
Loading nearby amenities…
Taxation est. · year 1
- Rental income
- $39,405
- − Mortgage interest
- −$13,430
- − Property taxes
- −$3,596
- − Insurance
- −$1,199
- − Repairs & maintenance
- −$3,152
- − Management
- −$3,152
- − Depreciation
- −$6,975
- Taxable income
- $7,900
- Est. tax owed @ 24.0%
- −$1,896
- After-tax cash flow
- $9,351/yr
For passive investors: Depreciation is non-cash, so a rental often shows a tax loss while cash-flowing — sheltering income. Rental losses are passive: they offset passive income freely, and up to $25,000/yr can offset ordinary (W-2) income if you actively participate and your MAGI is under $100k (phasing out to $0 by $150k); unused losses carry forward. On sale, claimed depreciation is recaptured at up to 25%, and gains may owe capital-gains tax (a 1031 exchange can defer both). Figures are a year-1 estimate at your 24.0% rate — not tax advice; consult a CPA.
Condition & rehab AI · 4 photos
The home is in poor condition with significant repairs and maintenance needed, including a new roof, painting, and landscaping. These updates would significantly increase its resale and rental value.
Repairs flagged
- Major roof — The roof appears to be in poor condition, with visible wear and tear.
- Major siding — The siding is in fair condition, but there are signs of weathering and discoloration.
- Major fencing — The fencing is in poor condition, with some sections appearing to be missing or damaged.
Value-add opportunities
- Resale New roof — A new roof will significantly improve the home's curb appeal and overall condition, making it more attractive to potential buyers.
- Both Landscaping — A well-maintained landscape will enhance the home's curb appeal and increase its value for both resale and rental.
- Both Painting — Painting the exterior will improve the home's appearance and increase its value for both resale and rental.
Renovation cost estimate screening
| Repair item | Severity | Est. cost |
|---|---|---|
| roof · The roof appears to be in poor condition, with visible wear and tear. | Major | $15,000–50,000 |
| siding · The siding is in fair condition, but there are signs of weathering and discoloration. | Major | $15,000–50,000 |
| fencing · The fencing is in poor condition, with some sections appearing to be missing or damaged. | Major | $15,000–50,000 |
| Total estimated repair cost · 3 items | $45,000–150,000 |
Value-add ROI direction
- Resale New roof — A new roof will significantly improve the home's curb appeal and overall condition, making it more attractive to potential buyers. ↑
- Both Landscaping — A well-maintained landscape will enhance the home's curb appeal and increase its value for both resale and rental. ↑
- Both Painting — Painting the exterior will improve the home's appearance and increase its value for both resale and rental. ↑
ⓘ Cost ranges are severity-bucket heuristics (US national rule-of-thumb). Get contractor quotes + a written scope before underwriting a rehab budget.
Schools (NCES district)
- District
- Calcasieu Parish
- NCES district ID
- 2200330
- Math proficiency
- 30% ▼ -39.00%
- Reading proficiency
- 44% ▼ -33.00%
- Median HH income
- $44,700
- Composite
- 31.45/100
- National rank
- #5979
- State rank
- #29 of 98 in LA
Livability — Sulphur
- Score
- 71/100
- State rank
- #48
- US rank
- #7164
Category grades
Schools grade is shown separately in the Schools card above.
Census & demographics
- Census place
- Sulphur, LA
- City population
- 27,799
- Population (ZIP)
- 12,891
Population outlook (Calcasieu County) Hauer SSP2
- Today (2025)
- 212,179 people
- By 2030
- 218,199 · +2.8%
- By 2040
- 228,486 · +7.7%
- By 2050
- 236,208 · +11.3%
- By 2075
- 251,696 · +18.6%
- By 2100
- 247,848 · +16.8%
Race, ethnicity, and origin ACS 2023
- Neighborhood character
- Predominantly White (87%)
- Race & ethnicity
- White 87% Hispanic / Latino 6% Two or more races 4% Black 3%
- Hispanic origin (detail)
- Mexican 4%
- Common ancestry
- Lithuanian 8% Italian 3% Slovak 2%
- Foreign-born
- 3% · Canada
- Languages at home
- 92% English-only · Spanish 6% French/Haitian/Cajun 1% Other Indo-European 1%
Political lean MEDSL · Calcasieu
- 2024 margin
- Solid R (+39.6) · D 29.5% · R 69.0% · Other 1.5%
- 2008→2024 swing
- -15.0pp toward R · 2008: -24.6pp · 2024: -39.6pp
- All cycles
- 2024: R+39.6 2020: R+35.2 2016: R+33.3 2012: R+28.7 2008: R+24.6
Not yet ingested
- Civics
- —
Market trends
- HPI YoY
- ▼ -91.65%
- Current HPI
- 99.2379
- Rent YoY
- —
- Metro
- —
- State GDP YoY
- ▲ 3.29%
- F500 in state
- 10
Industry mix (Fortune 500 HQ in LA)
| Industry | F500 HQs | Revenue |
|---|---|---|
| Telecommunications | 2 | $23B |
|
||
| Utilities | 1 | $12B |
|
||
| Wholesale / Distribution | 1 | $5B |
|
||
| Advertising | 1 | $2B |
|
||
Price history
1 event — show timeline
- 2026-03-04 Listed $252,600 Zillow
Cash-flow waterfall
monthlySold comps — $/sqft
last 12 mo · ≤1 miLoading sold comps…