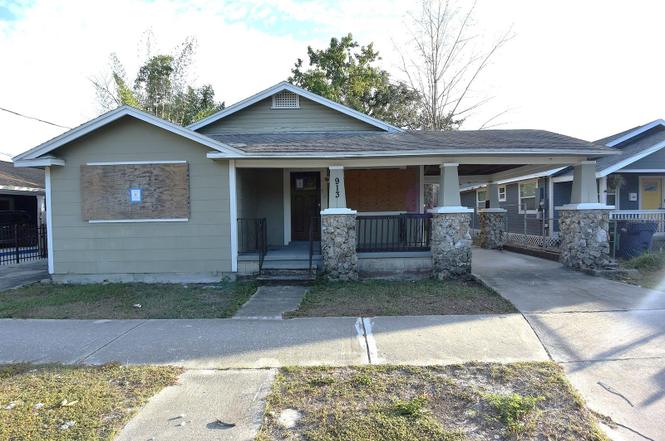
913 E 28th Ave · Tampa, FL
Flood risk 1/10 · Minimal
- FEMA flood zone
- X (unshaded)
- Chance of flooding over 30 yrs
- 0.0%
- Est. flood insurance / yr
- $507 – $1,088
Fire risk 1/10 · Minimal
- Est. fire insurance / yr
- $947 – $1,759
Heat risk 10/10 · Severe
- Hot days now (above 107°F)
- 7 days/yr
- Hot days in 30 yrs
- 26 days/yr
Wind risk 9/10 · Severe
- Chance of severe wind over 30 yrs
- 99.0%
Air-quality risk 3/10 · Minor
- Unhealthy air days now
- 3 days/yr
- Unhealthy air days in 30 yrs
- 3 days/yr
Risk factors via First Street. Map © Google.
Why this score? — see what drove the B+ grade
The composite is a weighted blend of 9 inputs, each scored 0–100. Each bar is that input's sub-score; the figure is the points it added to the 100-point composite (weight × sub-score).
- Cash flow +27.8/30.0
- Appreciation +10.0/10.0
- DSCR +9.8/10.0
- 1% rule +9.3/10.0
- ARV discount +7.5/15.0
- Schools +4.2/10.0
- Livability +4.0/5.0
- Rent growth +2.6/5.0
- Condition / age +2.5/5.0
$159,900
🖨 Deal sheet 📄 Offer letter ✓ Due diligence
Listing remarks
One or more photo(s) has been virtually staged. Calling All Investors, We welcome you to historic Ybor Heights! This charming three-bedroom, two-bath craftsman bungalow offers the perfect opportunity to restore a piece of Tampa’s history. The home features updated windows, which are currently boarded, but they are newer and in-tact. The interior has been gutted and partially renovated, ready for your finishing touches to bring your vision to life. Situated on a spacious privacy fenced lot surrounded by majestic bamboo and a mature avocado tree, the property offers a tranquil and private feel in the heart of the city. A large concrete pad in the backyard provides endless possibilities&
Key facts
- Large concrete pad
- Updated windows
- Mature avocado tree
Tags
Property features AI
Finance
- Other: Living area approximately 1,310 sq ft (public records); Building area approximately 1,598 sq ft; Lot roughly 0.13 acre (about 57 x 103); Vegetation includes bamboo and fruit trees; Road surface: asphalt; Zoning: RS-50
Exterior
- Parking: Covered parking; Driveway; Portico; 1-car carport
- Utilities: Private water source; Public sewer; Cable available; Electricity available; Sewer connected; Water connected
- Home design: Single family residence; One story; Northwest-facing entry
- Construction: Asbestos and frame construction; Shingle roof; Crawlspace foundation; Built on one level
- Exterior features: Front porch; Patio; Sidewalk; Wood fencing; Level lot; Paved lot; Located in city limits; Historic district
Interior
- Bedrooms: 3 bedrooms
- Flooring: Other flooring
- Bathrooms: 2 full bathrooms
- Heating & cooling: Central heating (electric); Central air conditioning
- Interior features: Living room/dining room combo; Split bedroom floor plan; Great room; Inside utility
- Laundry & utility: Dedicated laundry room
Neighborhood map
What this means for you Summary
Snapshot
- This is a 3-bed/2.0-bath single-family listed at $160k.
Deal economics
- At list price, monthly cash flow is $488 ($6k/yr) — positive.
- The deal already cash-flows at list — no discount required.
- Meets the 1% rule at list price ($2k rent vs $160k).
- Recommended offer: $141k (12.0% below list) — sets the bar for market timing.
Location & tenants
- Location reads 79/100 on livability (#142 in FL, #2,135 nationally) — a middle-class / working-renter tenant base. Strengths: commute A+, housing A+, health & safety A+; Watch: schools C-, crime D+.
- Hillsborough (suburban): math 47% / reading 50% proficiency, ranked #41 of 73 in FL (top 56%) — families likely to look elsewhere, expect single-tenant / working-renter base with shorter leases.
- Market conditions: Rents flat; 187 active listings in the ZIP; 40 comparable units currently listed for rent nearby; rentals at typical pace (median 22d on market — plan ~3-4 weeks tenant-placement turnaround); lower-income renter base — watch delinquency; 9,053 units permitted in Hillsborough County in 2024 (4,555 in 5+ unit buildings).
- At $2,284/mo this rent would consume 74% of the median local household income ($37k/yr) (locally 1374% of renters already pay >50% of income on rent) — very limited rent-growth headroom before tenants either downsize or default.
Forward outlook
- In year one you build about $17k of equity ($1k loan paydown + $16k appreciation (10.0% local appreciation)).
- Hillsborough County population projected at +37% by 2050 — long-run rental-demand tailwind backs the buy-and-hold thesis.
- At projected returns (10.0% appreciation + 0.6% rent growth), your $45k cash investment doubles in ~2 years — after that, you're playing with house money.
- By year 3, paydown + projected appreciation supports a ~$43k cash-out refi (75% LTV) — recoverable capital for the next deal without selling this one.
Negotiation context
- It's been on market 163 days — a 12% lower offer ($141k) is reasonable based on typical stale-listing flexibility.
- 19 sale attempts since 19y ago; this cycle's ask has dropped $30k (16%) from the opening price — seller is motivated, your offer sets the floor, not the list.
Risks & watch-outs
- Watch-outs: property tax is 3.1% of price; built in 1923 — expect roof / HVAC / electrical / plumbing capex.
- Climate carrying-cost: severe wind risk, 99% chance of damaging wind over 30y; extreme-heat days projected 7→26/yr by 2055 (HVAC capex compounding) — expect insurance premiums to compound above CPI over the hold.
Questions for the listing agent
- It's been on market 163 days. Have you received any prior offers? Is the seller open to a 12% concession, seller financing, or rate buy-down credit?
- Built in 1923 — when were the roof, HVAC, electrical panel, plumbing, and water heater last replaced?
- Property tax is high relative to price — has the assessment been appealed recently, and will the sale trigger a re-assessment?
- Why hasn't it sold? Are there any deal-killer items the seller is aware of (foundation, flood, title, zoning, code violations)?
- Is there a deadline driving the sale (1031 exchange, divorce, estate, relocation)? That informs how much negotiation room exists.
- Crime grade is D in this area — have there been break-ins, vandalism, or insurance claims at this property in the last 3 years? What carrier currently insures it and at what premium?
- What's the average days-on-market for RENTAL listings here right now (not sales)? A rising rental-DOM trend means longer vacancies and softer asking-rent achievability than the comps imply.
- What's the recent tenant-quality profile in this submarket — average credit score on applications, eviction rate, late-payment / NSF rate, and stable-employment percentage? A property-management company in the area should have these aggregated.
- How much new for-sale + rental construction is in the pipeline within 1–3 miles? Heavy new supply typically softens prices + rents 12–24 months out; constrained supply supports both.
Investment metrics
- 1% rule
- 1.43% ✓
- Cap rate
- 9.95%
- Cash-on-cash
- 13.07%
- DSCR
- 1.58
- GRM
- 5.8
CMA / ARV
No comps found within radius.
Projected returns pro-forma
10.0% appreciation · 0.58% rent growth · sell at horizon
- IRR
- 32.7%
- Equity multiple
- 3.52×
- Total profit
- $112,876
- Equity at exit
- $144,051
- IRR
- 27.3%
- Equity multiple
- 7.66×
- Total profit
- $298,340
- Equity at exit
- $310,651
Cash invested: $44,772 (down + closing). Projections, not guarantees.
Landlord ↔ Tenant lean methodology
- Overall (STATE)
- 87 Strongly Landlord-Friendly
- State Florida
- 87 Strongly Landlord-Friendly · R+3
- County
- — inherits STATE
- City
- — inherits STATE
ZIP-level market 33605
- Home prices YoY
- 3.7%
- Rents YoY
- 0.6%
- Active inventory
- 187
- Price-to-rent
- 5.8×
Monthly cashflow live
- Estimated rent
- $2,284 high interval (Pro) →
- Mortgage (P&I)
- −$839
- Tax from tax record
- −$412 /mo · $4,942/yr
- Insurance
- −$67
- HOA
- −$0
- Vacancy / Maint / Mgmt
- −$480
- Net cashflow
- $488
Break-even live
UW: 25.0% down · 7.5% · 30yr · 1.5% tax · 5.0% vac · 8.0% maint · 8.0% mgmt
Financing live
Cash to close
- Down payment
- $39,975
- Closing costs
- $4,797
- Reserves months
- —
- Total cash needed
- —
Loan-product check · same deal, 3 products live
Conventional
25% down · 7.5% · 30yr
- Down + closing
- —
- Monthly P&I
- —
- Monthly cashflow
- —
- DSCR
- —
- Eligible?
- —
Personal DTI + credit; lowest rate.
DSCR
20% down · 8.5% · 30yr
- Down + closing
- —
- Monthly P&I
- —
- Monthly cashflow
- —
- DSCR
- —
- Eligible?
- —
No personal income docs; deal must DSCR.
Hard money
10% down · 12.0% · 12mo
- Down + closing
- —
- Monthly P&I
- —
- Monthly cashflow
- —
- DSCR
- —
- Eligible?
- —
Short-term bridge; refi at stabilization.
Rent comps 40 comps
| Address | Beds | Baths | Sqft | Rent | $/sqft | DOM | Units | Dist |
|---|---|---|---|---|---|---|---|---|
| 3519 N 10th St Tampa, FL | 3.0 | 2.0 | 1200 | $1,850 | $1.54 | 18d | 1 | 0.11mi |
| 3511 Cone Ct Tampa, FL | 3.0 | 2.0 | 1256 | $2,200 | $1.75 | 5d | 1 | 0.11mi |
| 1006 E 26th Ave Tampa, FL | 2.0 | 1.0 | 1000 | $1,630 | $1.63 | 5d | 1 | 0.13mi |
| 916 E 25th Ave Tampa, FL | 3.0 | 2.0 | 1525 | $2,600 | $1.70 | 11d | 1 | 0.16mi |
| 809 E Baker St Unit A Tampa, FL | 3.0 | 1.0 | 1083 | $2,200 | $2.03 | 24d | 1 | 0.17mi |
| 3411 N 13th St Tampa, FL | 3.0 | 2.0 | 978 | $1,895 | $1.94 | 24d | 1 | 0.29mi |
| 1212 E 25th Ave Tampa, FL | 2.0 | 1.0 | 1035 | $1,490 | $1.44 | 19d | 1 | 0.29mi |
| 3601 N 13th St Tampa, FL | 3.0 | 2.5 | 1800 | $2,550 | $1.42 | 24d | 1 | 0.29mi |
| 1003 E 22nd Ave Tampa, FL | 2.0 | 1.0 | 1062 | $1,639 | $1.54 | 5d | 1 | 0.35mi |
| 515 E Adalee St Tampa, FL | 3.0 | 2.0 | 1552 | $2,650 | $1.71 | 5d | 1 | 0.36mi |
| 1305 E Louise Ave Tampa, FL | 3.0 | 2.0 | 1384 | $2,700 | $1.95 | 24d | 1 | 0.37mi |
| 912 E Saint Clair St Tampa, FL | 2.0 | 1.0 | 1000 | $1,900 | $1.90 | 24d | 1 | 0.38mi |
| 1302 E 21st Ave Tampa, FL | 1.0–2.0 | 1.0–2.0 | 800 | $1,408 | $1.76 | 5d | 9 | 0.45mi |
| 411 E Adalee St Tampa, FL | 3.0 | 1.0 | 1200 | $2,500 | $2.08 | 24d | 1 | 0.45mi |
| 2825 N Taliaferro Ave Tampa, FL | 4.0 | 2.0 | 1484 | $3,500 | $2.36 | 24d | 1 | 0.49mi |
| 1003 E 19th Ave Unit 1053143P Tampa, FL | 4.0 | 3.0 | 1614 | $4,674 | $2.90 | 3d | 1 | 0.51mi |
| 1515 E 31st Ave Tampa, FL | 2.0 | 1.0 | 914 | $1,500 | $1.64 | 5d | 1 | 0.53mi |
| 309 E Selma Ave Tampa, FL | 3.0 | 2.0 | 1170 | $3,095 | $2.65 | 5d | 1 | 0.54mi |
| 3210 N 16th St Tampa, FL | 4.0 | 2.0 | 1380 | $1,995 | $1.45 | 22d | 1 | 0.55mi |
| 3210 N 16th St Tampa, FL | 4.0 | 2.0 | 1380 | $1,875 | $1.36 | 3d | 1 | 0.55mi |
| 3021 Sanchez St Tampa, FL | 3.0 | 1.0 | 1300 | $2,195 | $1.69 | 24d | 1 | 0.56mi |
| 1504 E 33rd Ave Tampa, FL | 3.0 | 2.0 | 1108 | $2,900 | $2.62 | 24d | 1 | 0.56mi |
| 807 E Genesee St Unit 1/2 Tampa, FL | 3.0 | 2.0 | 1414 | $2,400 | $1.70 | 22d | 1 | 0.57mi |
| 807 E Genesee St Tampa, FL | 3.0 | 2.0 | 1414 | $2,400 | $1.70 | 20d | 1 | 0.57mi |
| 302 E Selma Ave Tampa, FL | 3.0 | 1.0 | 989 | $2,200 | $2.22 | 24d | 1 | 0.58mi |
| 4017 N Seminole Ave Tampa, FL | 4.0 | 1.0 | 1104 | $1,950 | $1.77 | 24d | 1 | 0.60mi |
| 1520 E 21st Ave Tampa, FL | 3.0 | 2.0 | 1671 | $2,350 | $1.41 | 16d | 1 | 0.61mi |
| 1003 E Columbus Dr Tampa, FL | 2.0 | 1.0 | 1160 | $1,795 | $1.55 | 1d | 1 | 0.65mi |
| 2907 N 15th St Unit D Tampa, FL | 3.0 | 2.0 | 888 | $1,850 | $2.08 | 5d | 1 | 0.65mi |
| 1108 E Chelsea St Tampa, FL | 3.0 | 2.0 | 1637 | $3,250 | $1.99 | 24d | 1 | 0.67mi |
| 1221 E Columbus Dr Tampa, FL | 2.0 | 1.0 | 1000 | $1,499 | $1.50 | 24d | 1 | 0.70mi |
| 503 E Columbus Dr Unit 1 Tampa, FL | 2.0 | 1.5 | 1000 | $2,400 | $2.40 | 24d | 1 | 0.71mi |
| 2810 N 16th St Tampa, FL | 2.0 | 1.0 | 1066 | $2,550 | $2.39 | 12d | 1 | 0.72mi |
| 1602 E North Bay St Tampa, FL | 3.0 | 2.0 | 1200 | $2,100 | $1.75 | 24d | 1 | 0.74mi |
| 418 E Amelia Ave Unit A Tampa, FL | 3.0 | 2.0 | 1050 | $1,800 | $1.71 | 24d | 1 | 0.78mi |
| 1301 E Cayuga St Tampa, FL | 3.0 | 1.5 | 1216 | $2,200 | $1.81 | 24d | 1 | 0.78mi |
| 307 W Woodlawn Ave Tampa, FL | 4.0 | 3.0 | 1274 | $3,095 | $2.43 | 3d | 1 | 0.82mi |
| 1807 E 20th Ave Tampa, FL | 3.0 | 2.0 | 1131 | $2,900 | $2.56 | 24d | 1 | 0.83mi |
| 902 E Curtis St Unit 1 Tampa, FL | 2.0 | 2.0 | 1325 | $3,200 | $2.42 | 18d | 1 | 0.83mi |
| 212 W North Bay St Tampa, FL | 3.0 | 1.0 | 1065 | $2,600 | $2.44 | 3d | 1 | 0.87mi |
Listing history 50 events
-
2026-06-18days on market $159,900 Active 163 DOM
-
2026-06-17days on market $159,900 Active 162 DOM
-
2026-06-16days on market $159,900 Active 161 DOM
-
2026-06-15days on market $159,900 Active 160 DOM
-
2026-06-13days on market $159,900 Active 158 DOM
-
2026-06-13days on market $159,900 Active 157 DOM
-
2026-06-09days on market $159,900 Active 154 DOM
-
2026-06-08days on market $159,900 Active 153 DOM
-
2026-06-07days on market $159,900 Active 152 DOM
-
2026-06-04days on market $159,900 Active 149 DOM
-
2026-06-03days on market $159,900 Active 148 DOM
-
2026-06-02days on market $159,900 Active 147 DOM
-
2026-06-01days on market $159,900 Active 146 DOM
-
2026-05-31days on market $159,900 Active 145 DOM
-
2026-05-27status Active
-
2026-05-27price $159,900
-
2026-04-30historical
-
2026-03-31price $165,500
-
2026-03-12status Active
-
2026-02-12historical
-
2025-11-12$189,900 Active
-
2025-10-21historical
-
2025-09-11$200,000 Active
-
2023-01-05$299,900 Active
-
2022-11-29historical
-
2022-10-11$299,000 Active
-
2022-03-22soldstatus $230,000
-
2022-03-14soldstatus $217,500 Closed
-
2022-02-11status Pending
-
2022-01-24status Active
-
2022-01-10status Pending
-
2021-12-15$249,900 Active
-
2021-08-23soldstatus $195,000
-
2017-04-20soldstatus $149,900
-
2017-03-26status Pending
-
2017-03-26historical
-
2017-03-24price $149,900
-
2017-03-24status Active
-
2017-01-25historical
-
2016-12-09status Active
-
2016-11-22historical
-
2016-11-07status Active
-
2016-10-29status Pending
-
2016-10-04price $129,900
-
2016-09-06price $139,900
-
2016-08-09status Active
-
2016-08-06historical Active with Contract
-
2016-08-03$149,900 Active
-
2016-05-19soldstatus $50,000
-
2016-04-07historical
ⓘ Source: listings_history table (triggers on properties + properties_extension) + one-shot
backfill from property_details.listing_events for pre-trigger history.
Tax reassessment forecast FL · Resets to sale price
- Current annual tax
- $4,942 · $412/mo
- Projected year-2 tax
- $4,942 · $412/mo
- Expected delta
- $0/yr ($0/mo · 0.0%)
ⓘ Screening estimate from a state-policy table — verify with the county assessor before closing.
Climate risk First Street
- Flood 1/10 Low FEMA zone X (unshaded) · 0% chance over 30 yrs
- Wildfire 1/10 Low
- Heat 10/10 Extreme 7 d/yr ≥107°F today · 26 d/yr by 30 yrs out
- Wind 9/10 Extreme 99% chance of damaging wind over 30 yrs
- Air quality 3/10 Moderate 3 unhealthy d/yr today · 3 by 30 yrs out
Nearby sold comps map
Loading sold comps map…
Walkable amenities ~0.75 mi
Loading nearby amenities…
Taxation est. · year 1
- Rental income
- $27,411
- − Mortgage interest
- −$8,957
- − Property taxes
- −$4,942
- − Insurance
- −$800
- − Repairs & maintenance
- −$2,193
- − Management
- −$2,193
- − Depreciation
- −$4,652
- Taxable income
- $3,676
- Est. tax owed @ 24.0%
- −$882
- After-tax cash flow
- $4,969/yr
For passive investors: Depreciation is non-cash, so a rental often shows a tax loss while cash-flowing — sheltering income. Rental losses are passive: they offset passive income freely, and up to $25,000/yr can offset ordinary (W-2) income if you actively participate and your MAGI is under $100k (phasing out to $0 by $150k); unused losses carry forward. On sale, claimed depreciation is recaptured at up to 25%, and gains may owe capital-gains tax (a 1031 exchange can defer both). Figures are a year-1 estimate at your 24.0% rate — not tax advice; consult a CPA.
Schools (NCES district)
- District
- Hillsborough
- NCES district ID
- 1200870
- Math proficiency
- 47% ▼ -8.00%
- Reading proficiency
- 50% ▼ -4.00%
- Median HH income
- $50,622
- Composite
- 41.6/100
- National rank
- #3435
- State rank
- #41 of 73 in FL
Livability — Tampa
- Score
- 79/100
- State rank
- #142
- US rank
- #2135
Category grades
Schools grade is shown separately in the Schools card above.
Census & demographics
- Census place
- Tampa, FL
- County
- Hillsborough County · 1,540,968 people
- City population
- 523,346
- Metro
- Tampa-St. Petersburg-Clearwater, FL
- Population (ZIP)
- 16,030
- Household income
- $36,975
- Rent vs Own
- Severe rent burden
- 1374.0
Population outlook (Hillsborough County) Hauer SSP2
- Today (2025)
- 1,607,022 people
- By 2030
- 1,733,968 · +7.9%
- By 2040
- 1,979,565 · +23.2%
- By 2050
- 2,203,427 · +37.1%
- By 2075
- 2,667,893 · +66.0%
- By 2100
- 2,891,558 · +79.9%
Race, ethnicity, and origin ACS 2023
- Neighborhood character
- Diverse neighborhood (Simpson 0.66)
- Race & ethnicity
- Black 48% Hispanic / Latino 28% Two or more races 18% White 17% Asian 1%
- Hispanic origin (detail)
- Mexican 6% Puerto Rican 8% Cuban 6% Dominican 1%
- Common ancestry
- Hispanic 2% Romanian 1% Lithuanian 1%
- Foreign-born
- 17% · Canada, Vietnam, Jamaica
- Languages at home
- 72% English-only · Spanish 24% French/Haitian/Cajun 3% Other Asian/Pacific 1%
Political lean MEDSL · Hillsborough
- 2024 margin
- Toss-up / Even · D 47.8% · R 50.9% · Other 1.3%
- 2008→2024 swing
- -10.2pp toward R · 2008: 7.1pp · 2024: -3.1pp
- All cycles
- 2024: R+3.1 2020: D+6.9 2016: D+6.8 2012: D+6.7 2008: D+7.1
Not yet ingested
- Civics
- —
Market trends
- HPI YoY
- ▲ 17.43%
- Current HPI
- 494.1871
- Rent YoY
- ▲ 0.58%
- Metro
- Tampa-St. Petersburg-Clearwater, FL
- State GDP YoY
- ▲ 3.28%
- F500 in state
- 36
Industry mix (Fortune 500 HQ in FL)
| Industry | F500 HQs | Revenue |
|---|---|---|
| Industrial Technology | 2 | $29B |
|
||
| Insurance | 2 | $17B |
|
||
| Retail | 1 | $60B |
|
||
| Technology Distribution | 1 | $58B |
|
||
| Homebuilding | 1 | $35B |
|
||
| Technology Manufacturing | 1 | $35B |
|
||
Price history
+10.3% since first listed49 events — show timeline
- 2026-05-27 Relisted — Stellar MLS as Distributed by MLS Grid
- 2026-05-27 Price Changed $159,900 Stellar MLS as Distributed by MLS Grid
- 2026-04-30 Listing Removed — Stellar MLS as Distributed by MLS Grid
- 2026-03-31 Price Changed $165,500 Stellar MLS as Distributed by MLS Grid
- 2026-03-12 Relisted — Stellar MLS as Distributed by MLS Grid
- 2026-02-12 Listing Removed — Stellar MLS as Distributed by MLS Grid
- 2025-11-12 Listed $189,900 Stellar MLS as Distributed by MLS Grid
- 2025-10-21 Listing Removed — Stellar MLS as Distributed by MLS Grid
- 2025-09-11 Listed $200,000 Stellar MLS as Distributed by MLS Grid
- 2023-01-05 Listed $299,900 Stellar MLS as Distributed by MLS Grid
- 2022-11-29 Listing Removed — Stellar MLS as Distributed by MLS Grid
- 2022-10-11 Listed $299,000 Stellar MLS as Distributed by MLS Grid
- 2022-03-22 Sold (Public Records) $230,000 Public Records
- 2022-03-14 Sold (MLS) $217,500 Stellar MLS as Distributed by MLS Grid
- 2022-02-11 Pending — Stellar MLS as Distributed by MLS Grid
- 2022-01-24 Relisted — Stellar MLS as Distributed by MLS Grid
- 2022-01-10 Pending — Stellar MLS as Distributed by MLS Grid
- 2021-12-15 Listed $249,900 Stellar MLS as Distributed by MLS Grid
- 2021-08-23 Sold (Public Records) $195,000 Public Records
- 2017-04-20 Sold (Public Records) $149,900 Public Records
- 2017-03-26 Pending — Stellar MLS as Distributed by MLS Grid
- 2017-03-26 Listing Removed — Stellar MLS as Distributed by MLS Grid
- 2017-03-24 Price Changed $149,900 Stellar MLS as Distributed by MLS Grid
- 2017-03-24 Relisted — Stellar MLS as Distributed by MLS Grid
- 2017-01-25 Listing Removed — Stellar MLS as Distributed by MLS Grid
- 2016-12-09 Relisted — Stellar MLS as Distributed by MLS Grid
- 2016-11-22 Listing Removed — Stellar MLS as Distributed by MLS Grid
- 2016-11-07 Relisted — Stellar MLS as Distributed by MLS Grid
- 2016-10-29 Pending — Stellar MLS as Distributed by MLS Grid
- 2016-10-04 Price Changed $129,900 Stellar MLS as Distributed by MLS Grid
- 2016-09-06 Price Changed $139,900 Stellar MLS as Distributed by MLS Grid
- 2016-08-09 Relisted — Stellar MLS as Distributed by MLS Grid
- 2016-08-06 Contingent — Stellar MLS as Distributed by MLS Grid
- 2016-08-03 Listed $149,900 Stellar MLS as Distributed by MLS Grid
- 2016-05-19 Sold (Public Records) $50,000 Public Records
- 2016-04-07 Listing Removed — Stellar MLS as Distributed by MLS Grid
- 2016-03-28 Relisted — Stellar MLS as Distributed by MLS Grid
- 2016-03-24 Pending — Stellar MLS as Distributed by MLS Grid
- 2016-03-21 Listed $59,900 Stellar MLS as Distributed by MLS Grid
- 2014-04-01 Listing Removed — Stellar MLS as Distributed by MLS Grid
- 2013-11-04 Listed $24,900 Stellar MLS as Distributed by MLS Grid
- 2008-07-17 Listing Removed — Stellar MLS as Distributed by MLS Grid
- 2008-03-06 Listing Removed — Stellar MLS as Distributed by MLS Grid
- 2008-03-06 Listed $93,500 Stellar MLS as Distributed by MLS Grid
- 2007-09-05 Listed $93,500 Stellar MLS as Distributed by MLS Grid
- 2007-07-27 Listing Removed — Stellar MLS as Distributed by MLS Grid
- 2007-03-07 Listed $117,000 Stellar MLS as Distributed by MLS Grid
- 2006-11-30 Sold (Public Records) $160,000 Public Records
- 2005-09-23 Sold (Public Records) $145,000 Public Records
Property tax history
+15.9%/yrLatest (2025): $4,942 · +6.2% YoY. Source: county tax records.
Cash-flow waterfall
monthlySold comps — $/sqft
last 12 mo · ≤1 miLoading sold comps…