3265 Antelope Rd Spc 47 · White City, OR
Flood risk 1/10 · Minimal
- FEMA flood zone
- X (unshaded)
- Chance of flooding over 30 yrs
- 0.0%
- Est. flood insurance / yr
- $507 – $1,088
Fire risk 7/10 · Major
- Est. fire insurance / yr
- $498 – $926
Heat risk 6/10 · Moderate
- Hot days now (above 98°F)
- 7 days/yr
- Hot days in 30 yrs
- 15 days/yr
Wind risk 1/10 · Minimal
- Chance of severe wind over 30 yrs
- —
Air-quality risk 10/10 · Severe
- Unhealthy air days now
- 28 days/yr
- Unhealthy air days in 30 yrs
- 30 days/yr
Risk factors via First Street. Map © Google.
Why this score? — see what drove the B- grade
The composite is a weighted blend of 9 inputs, each scored 0–100. Each bar is that input's sub-score; the figure is the points it added to the 100-point composite (weight × sub-score).
- Cash flow +30.0/30.0
- 1% rule +10.0/10.0
- DSCR +10.0/10.0
- ARV discount +7.5/15.0
- Livability +3.4/5.0
- Schools +3.3/10.0
- Rent growth +2.5/5.0
- Condition / age +2.5/5.0
- Appreciation +0.0/10.0
$64,500
🖨 Deal sheet 📄 Offer letter ✓ Due diligence
Listing remarks
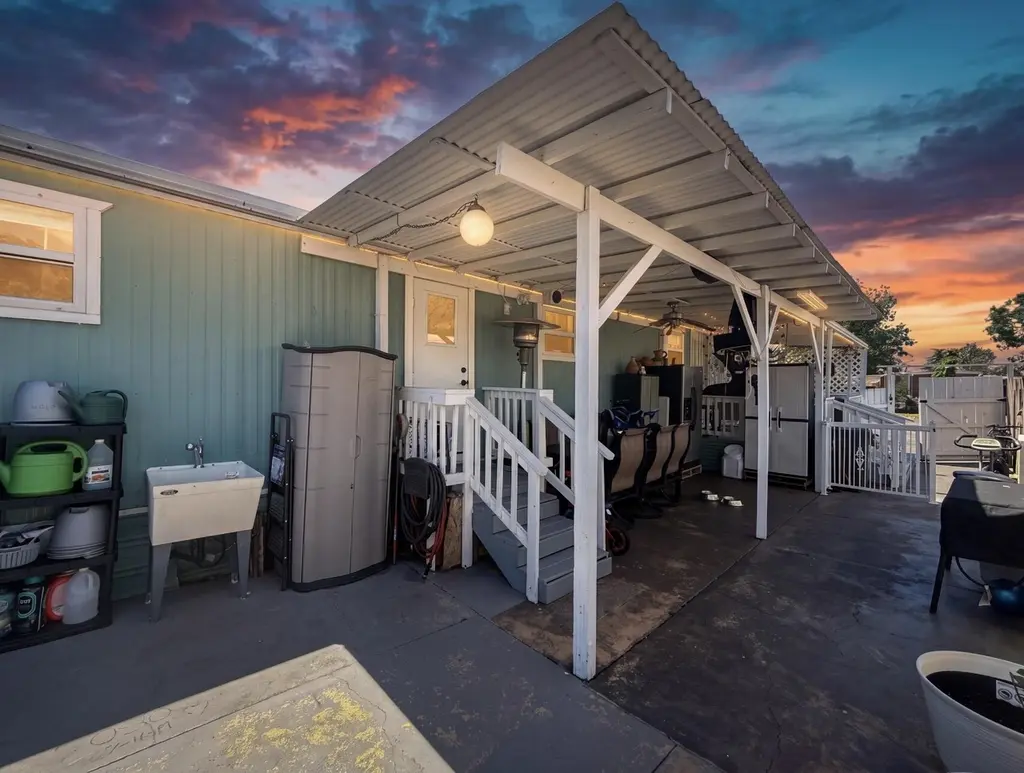
Charming and cared-for manufactured home in a park setting featuring 3 bedrooms and 1.5 bathrooms. This home is clean, comfortable, and ready for its next owner. The exterior offers a nicely kept yard, an oversized concrete front patio, and a spacious covered porch ideal for enjoying the outdoors or spending time with family and friends. The roof was replaced approximately 10 years ago, adding extra peace of mind for the future owner.
Key facts
- Nicely kept yard
- Manufactured home
- Park setting
Tags
Property features AI
Finance
- Other: Short-term rentals not permitted (no short-term rental permit)
- Financial info: Land lease: $720 monthly; Not currently rented
- HOA & community: Not governed by CCRs; May remain in park (park approval required); On leased land
Exterior
- Parking: Asphalt parking
- Security: Audio surveillance on premises; Video surveillance on premises
- Utilities: Public water; Public sewer; Natural gas connected
- Home design: Mobile home (single wide) located in a park; Single-story
- Construction: Built in 1971; Metal skirting; Foundation: Unknown
- Exterior features: Composition roof; Vinyl window frames; Asphalt parking surface; Road surface: Other
Interior
- Kitchen: Microwave; Range; Range hood; Refrigerator; Eating area adjacent to kitchen
- Bedrooms: 3 bedrooms (includes a primary bedroom and a second primary)
- Flooring: Laminate
- Bathrooms: 1 full bathroom; 1 half bathroom
- Heating & cooling: Heat pump; Natural gas heating; Central air conditioning
- Interior features: Microwave; Range; Range hood; Refrigerator; Laminate flooring; Enclosed porch/patio; Eating area; Living room
- Laundry & utility: No basement
Neighborhood map
What this means for you Summary
Snapshot
- This is a 3-bed/1.0-bath land listed at $64k.
Deal economics
- At list price, monthly cash flow is $697 ($8k/yr) — positive.
- The deal already cash-flows at list — no discount required.
- Meets the 1% rule at list price ($1k rent vs $64k).
- Recommended offer: $63k (3.0% below list) — sets the bar for market timing.
- Cap rate 19.3% vs local median 3.4% in White City — top-decile yield for the area; either an underpriced asset or a hidden risk that comps aren't pricing in. Stress-test before assuming the spread holds.
Location & tenants
- Location reads 67/100 on livability (#182 in OR) — a middle-class / working-renter tenant base. Strengths: housing A+, health & safety A+, cost of living A; Watch: employment C-, schools F, crime D-.
- Eagle Point SD 9 (suburban): math 26% / reading 45% proficiency, ranked #134 of 183 in OR (top 73%) — families likely to look elsewhere, expect single-tenant / working-renter base with shorter leases.
- Market conditions: 103 active listings in the ZIP; 904 units permitted in Jackson County in 2024 (212 in 5+ unit buildings).
Forward outlook
- Local home prices are declining (-3.0%/yr); year-one equity from $446 of loan paydown is wiped out by about $2k of value loss. Plan a longer hold.
- Jackson County population projected at +17% by 2050 — long-run rental-demand tailwind backs the buy-and-hold thesis.
- At projected returns (-3.0% appreciation + 3.0% rent growth), your $18k cash investment doubles in ~3 years — after that, you're playing with house money.
Negotiation context
- It's been on market 33 days — a 3% lower offer ($63k) is reasonable based on typical stale-listing flexibility.
Risks & watch-outs
- Climate carrying-cost: major wildfire risk; extreme-heat days projected 7→15/yr by 2055 (HVAC capex compounding) — expect insurance premiums to compound above CPI over the hold.
Questions for the listing agent
- It's been on market 33 days. Have you received any prior offers? Is the seller open to a 3% concession, seller financing, or rate buy-down credit?
- Built in 1971 — when were the roof, HVAC, electrical panel, plumbing, and water heater last replaced?
- Is there a deadline driving the sale (1031 exchange, divorce, estate, relocation)? That informs how much negotiation room exists.
- Schools are F-rated, which usually means shorter tenancies and higher turnover. Who's the typical renter profile here, and what's been the actual vacancy rate?
- Crime grade is D in this area — have there been break-ins, vandalism, or insurance claims at this property in the last 3 years? What carrier currently insures it and at what premium?
- What's the average days-on-market for RENTAL listings here right now (not sales)? A rising rental-DOM trend means longer vacancies and softer asking-rent achievability than the comps imply.
- What's the recent tenant-quality profile in this submarket — average credit score on applications, eviction rate, late-payment / NSF rate, and stable-employment percentage? A property-management company in the area should have these aggregated.
- How much new for-sale + rental construction is in the pipeline within 1–3 miles? Heavy new supply typically softens prices + rents 12–24 months out; constrained supply supports both.
Investment metrics
- 1% rule
- 2.24% ✓
- Cap rate
- 19.27%
- Cash-on-cash
- 46.33%
- DSCR
- 3.06
- GRM
- 3.7
CMA / ARV
No comps found within radius.
Projected returns pro-forma
-3.0% appreciation · 3.0% rent growth · sell at horizon
- IRR
- 43.6%
- Equity multiple
- 2.88×
- Total profit
- $33,980
- Equity at exit
- $9,617
- IRR
- 49.6%
- Equity multiple
- 5.81×
- Total profit
- $86,864
- Equity at exit
- $5,577
Cash invested: $18,060 (down + closing). Projections, not guarantees.
Landlord ↔ Tenant lean methodology
- Overall (STATE)
- 28 Tenant-Leaning
- State Oregon
- 28 Tenant-Leaning · D+6
- County
- — inherits STATE
- City
- — inherits STATE
ZIP-level market 97503
- Home prices YoY
- -28.5%
- Active inventory
- 103
- Price-to-rent
- 3.7×
Monthly cashflow live
- Estimated rent
- $1,447 medium interval (Pro) →
- Mortgage (P&I)
- −$338
- Tax est. 1.5%
- −$81 /mo · $968/yr
- Insurance
- −$27
- HOA
- −$0
- Vacancy / Maint / Mgmt
- −$304
- Net cashflow
- $697
Break-even live
UW: 25.0% down · 7.5% · 30yr · 1.5% tax · 5.0% vac · 8.0% maint · 8.0% mgmt
Financing live
Cash to close
- Down payment
- $16,125
- Closing costs
- $1,935
- Reserves months
- —
- Total cash needed
- —
Loan-product check · same deal, 3 products live
Conventional
25% down · 7.5% · 30yr
- Down + closing
- —
- Monthly P&I
- —
- Monthly cashflow
- —
- DSCR
- —
- Eligible?
- —
Personal DTI + credit; lowest rate.
DSCR
20% down · 8.5% · 30yr
- Down + closing
- —
- Monthly P&I
- —
- Monthly cashflow
- —
- DSCR
- —
- Eligible?
- —
No personal income docs; deal must DSCR.
Hard money
10% down · 12.0% · 12mo
- Down + closing
- —
- Monthly P&I
- —
- Monthly cashflow
- —
- DSCR
- —
- Eligible?
- —
Short-term bridge; refi at stabilization.
Listing history 18 events
-
2026-06-19days on market $64,500 Active 33 DOM
-
2026-06-18days on market $64,500 Active 32 DOM
-
2026-06-17days on market $64,500 Active 31 DOM
-
2026-06-16days on market $64,500 Active 30 DOM
-
2026-06-15days on market $64,500 Active 29 DOM
-
2026-06-14days on market $64,500 Active 27 DOM
-
2026-06-13days on market $64,500 Active 26 DOM
-
2026-06-10days on market $64,500 Active 24 DOM
-
2026-06-09days on market $64,500 Active 23 DOM
-
2026-06-08days on market $64,500 Active 22 DOM
-
2026-06-07days on market $64,500 Active 21 DOM
-
2026-06-05days on market $64,500 Active 18 DOM
-
2026-06-03days on market $64,500 Active 17 DOM
-
2026-06-02pricedays on market $64,500 Active 16 DOM
-
2026-06-01days on market $70,000 Active 15 DOM
-
2026-05-31days on market $70,000 Active 14 DOM
-
2026-05-30days on market $70,000 Active 13 DOM
-
2026-05-17$70,000 Active
ⓘ Source: listings_history table (triggers on properties + properties_extension) + one-shot
backfill from property_details.listing_events for pre-trigger history.
Climate risk First Street
- Flood 1/10 Low FEMA zone X (unshaded) · 0% chance over 30 yrs
- Wildfire 7/10 Severe
- Heat 6/10 Major 7 d/yr ≥98°F today · 15 d/yr by 30 yrs out
- Wind 1/10 Low
- Air quality 10/10 Extreme 28 unhealthy d/yr today · 30 by 30 yrs out
Nearby sold comps map
Loading sold comps map…
Walkable amenities ~0.75 mi
Loading nearby amenities…
Taxation est. · year 1
- Rental income
- $17,362
- − Mortgage interest
- −$3,613
- − Property taxes
- −$968
- − Insurance
- −$322
- − Repairs & maintenance
- −$1,389
- − Management
- −$1,389
- − Depreciation
- −$1,876
- Taxable income
- $7,805
- Est. tax owed @ 24.0%
- −$1,873
- After-tax cash flow
- $6,494/yr
For passive investors: Depreciation is non-cash, so a rental often shows a tax loss while cash-flowing — sheltering income. Rental losses are passive: they offset passive income freely, and up to $25,000/yr can offset ordinary (W-2) income if you actively participate and your MAGI is under $100k (phasing out to $0 by $150k); unused losses carry forward. On sale, claimed depreciation is recaptured at up to 25%, and gains may owe capital-gains tax (a 1031 exchange can defer both). Figures are a year-1 estimate at your 24.0% rate — not tax advice; consult a CPA.
Schools (NCES district)
- District
- Eagle Point SD 9
- NCES district ID
- 4104500
- Math proficiency
- 26% ▬ 0.00%
- Reading proficiency
- 45% ▬ 0.00%
- Median HH income
- $47,834
- Composite
- 33.13/100
- National rank
- #10630
- State rank
- #134 of 183 in OR
Livability — White City
- Score
- 67/100
- State rank
- #182
- US rank
- #11152
Category grades
Schools grade is shown separately in the Schools card above.
Census & demographics
- Census place
- White City, OR
- Population (ZIP)
- 14,119
Population outlook (Jackson County) Hauer SSP2
- Today (2025)
- 234,433 people
- By 2030
- 243,834 · +4.0%
- By 2040
- 259,717 · +10.8%
- By 2050
- 273,269 · +16.6%
- By 2075
- 300,624 · +28.2%
- By 2100
- 305,256 · +30.2%
Race, ethnicity, and origin ACS 2023
- Neighborhood character
- Majority White (58%)
- Race & ethnicity
- White 58% Hispanic / Latino 35% Two or more races 11% Asian 1%
- Hispanic origin (detail)
- Mexican 34%
- Common ancestry
- Slovak 4% Italian 3% Portuguese 2%
- Foreign-born
- 11% · Canada
- Languages at home
- 77% English-only · Spanish 22% Tagalog/Filipino 1%
Political lean MEDSL · Jackson
- 2024 margin
- Lean R (+6.4) · D 45.5% · R 51.9% · Other 2.6%
- 2008→2024 swing
- -6.5pp toward R · 2008: 0.1pp · 2024: -6.4pp
- All cycles
- 2024: R+6.4 2020: R+3.5 2016: R+9.2 2012: R+5.0 2008: D+0.1
Not yet ingested
- Civics
- —
Market trends
- HPI YoY
- ▼ -106.87%
- Current HPI
- 268.6998
- Rent YoY
- —
- Metro
- —
- State GDP YoY
- ▲ 2.05%
- F500 in state
- 2
Industry mix (Fortune 500 HQ in OR)
| Industry | F500 HQs | Revenue |
|---|---|---|
| Consumer Goods | 1 | $51B |
|
||
Price history
1 event — show timeline
- 2026-05-17 Listed $70,000 MLSCO
Property tax history
+1.7%/yrLatest (2022): $116 · +2.7% YoY. Source: county tax records.
Cash-flow waterfall
monthlySold comps — $/sqft
last 12 mo · ≤1 miLoading sold comps…