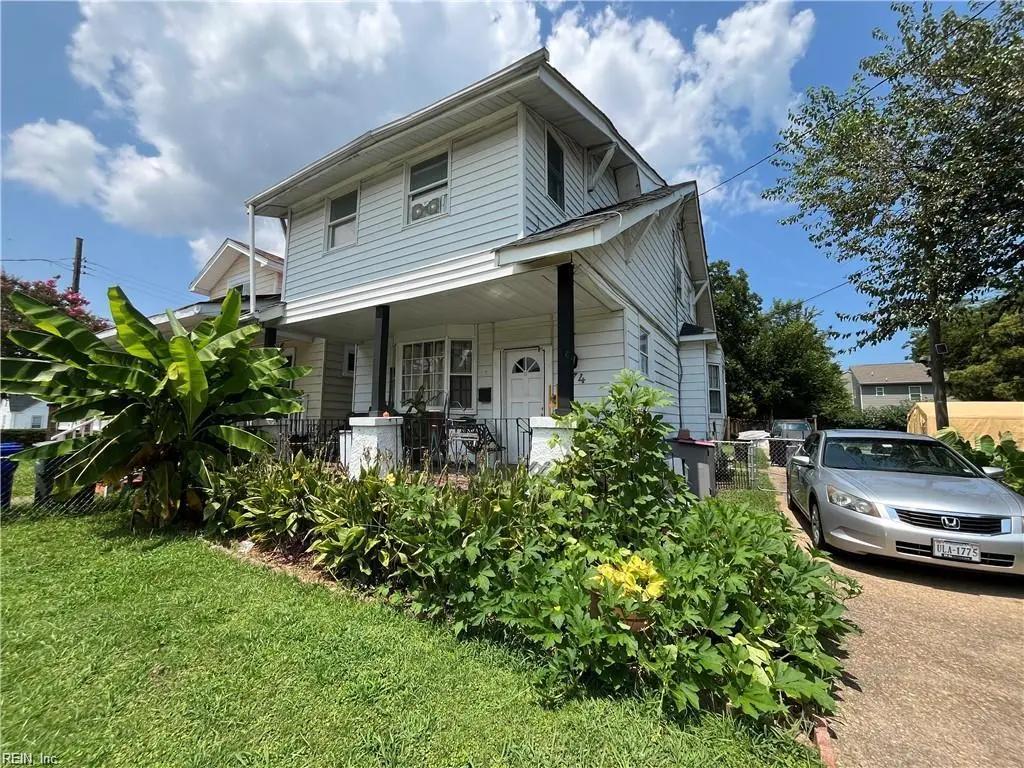
974 Philpotts Rd · Norfolk, VA
Flood risk 1/10 · Minimal
- FEMA flood zone
- X (unshaded)
- Chance of flooding over 30 yrs
- 0.0%
- Est. flood insurance / yr
- $507 – $1,088
Fire risk 1/10 · Minimal
- Est. fire insurance / yr
- $666 – $1,236
Heat risk 9/10 · Severe
- Hot days now (above 105°F)
- 7 days/yr
- Hot days in 30 yrs
- 16 days/yr
Wind risk 8/10 · Major
- Chance of severe wind over 30 yrs
- 80.0%
Air-quality risk 3/10 · Minor
- Unhealthy air days now
- 2 days/yr
- Unhealthy air days in 30 yrs
- 3 days/yr
Risk factors via First Street. Map © Google.
Why this score? — see what drove the B- grade
The composite is a weighted blend of 9 inputs, each scored 0–100. Each bar is that input's sub-score; the figure is the points it added to the 100-point composite (weight × sub-score).
- Cash flow +23.2/30.0
- ARV discount +15.0/15.0
- DSCR +7.4/10.0
- 1% rule +6.6/10.0
- Livability +4.2/5.0
- Schools +3.5/10.0
- Rent growth +3.4/5.0
- Condition / age +2.5/5.0
- Appreciation +0.0/10.0
$190,000
🖨 Deal sheet 📄 Offer letter ✓ Due diligence
Listing remarks
Recently remodeled just two years ago, this home offers great bones and modern updates but now needs a little TLC to truly shine again. Priced well below market value, it’s a fantastic opportunity for investors, flippers, or buyers looking to build equity. Don’t miss this chance—priced to sell and ready for your personal touch! This property is being offered as a short sale and is subject to lender review and approval.
Key facts
- Pool
- Built 1918
- Listed 8 days
Neighborhood map
What this means for you Summary
Snapshot
- This is a 4-bed/2.5-bath single-family listed at $190k.
Deal economics
- At list price, monthly cash flow is $343 ($4k/yr) — positive.
- The deal already cash-flows at list — no discount required.
- Meets the 1% rule at list price ($2k rent vs $190k).
- Cap rate 8.5% vs local median 4.0% in Norfolk — top-decile yield for the area; either an underpriced asset or a hidden risk that comps aren't pricing in. Stress-test before assuming the spread holds.
Location & tenants
- Location reads 83/100 on livability (#43 in VA, #1,026 nationally) — a professional / high-income tenant draw. Strengths: amenities A+, commute A+, health & safety A+; Watch: employment C-, crime F.
- Norfolk City Public School District (urban): math 27% / reading 56% proficiency, ranked #118 of 131 in VA (top 90%) — families likely to look elsewhere, expect single-tenant / working-renter base with shorter leases.
- Zoned schools: Norview Elementary (math 17% / reading 47%, grade F, #992 of 1,108 statewide, top 90%, 395 students, 98% FRL); Norview High (math 33% / reading 85%, grade C+, #256 of 319 statewide, top 81%, 1,915 students, 97% FRL) — zoned schools average 98% FRL vs 59% district-wide (39 pts higher); higher-poverty schools than district average — tighter screening recommended.
- Market conditions: Rents rising (+3.4%/yr); 132 active listings in the ZIP; 29 comparable units currently listed for rent nearby; rentals at typical pace (median 24d on market — plan ~3-4 weeks tenant-placement turnaround); 438 units permitted in Norfolk city in 2024 (273 in 5+ unit buildings).
- This rent runs 39% of the median local income ($68k/yr) — at the standard rent-burdened threshold; future hikes will face affordability resistance.
Forward outlook
- Local home prices are declining (-3.0%/yr); year-one equity from $1k of loan paydown is wiped out by about $6k of value loss. Plan a longer hold.
Negotiation context
- Only 8 days on market — expect competitive offers; lowballing is unlikely to land.
- 11 sale attempts since 5y ago with the ask held roughly flat each time — persistent listings suggest the price (not the market) is what's stuck; bring a comps-based counter.
Risks & watch-outs
- Watch-outs: built in 1918 — expect roof / HVAC / electrical / plumbing capex.
- Climate carrying-cost: severe wind risk, 80% chance of damaging wind over 30y; extreme-heat days projected 7→16/yr by 2055 (HVAC capex compounding) — expect insurance premiums to compound above CPI over the hold.
Questions for the listing agent
- Built in 1918 — when were the roof, HVAC, electrical panel, plumbing, and water heater last replaced?
- Is there a deadline driving the sale (1031 exchange, divorce, estate, relocation)? That informs how much negotiation room exists.
- Schools are A-rated — typically a magnet for longer-tenancy family renters. What's the average tenant stay here, and is there a school-zone premium baked into asking?
- Crime grade is F in this area — have there been break-ins, vandalism, or insurance claims at this property in the last 3 years? What carrier currently insures it and at what premium?
- What's the average days-on-market for RENTAL listings here right now (not sales)? A rising rental-DOM trend means longer vacancies and softer asking-rent achievability than the comps imply.
- What's the recent tenant-quality profile in this submarket — average credit score on applications, eviction rate, late-payment / NSF rate, and stable-employment percentage? A property-management company in the area should have these aggregated.
- How much new for-sale + rental construction is in the pipeline within 1–3 miles? Heavy new supply typically softens prices + rents 12–24 months out; constrained supply supports both.
Investment metrics
- 1% rule
- 1.16% ✓
- Cap rate
- 8.46%
- Cash-on-cash
- 7.73%
- DSCR
- 1.34
- GRM
- 7.2
CMA / ARV
- ARV (on-the-fly)
- $348,600
- Comps found
- 12
Show comp detail 12 sales within ~0.75 mi
| Address | Dist | Beds/Ba | Sqft | Sold | Price | $/sf | Match |
|---|---|---|---|---|---|---|---|
| 961 Marietta Ave | 0.05mi | 4/2.0 | 1,480 (-11%) | 2mo | $320,000 | $216 | 76 |
| 976 Hugo St | 0.52mi | 4/2.0 | 1,642 (-1%) | 2mo | $380,000 | $231 | 70 |
| 6241 Sewells Point Rd | 0.60mi | 4/2.5 | 1,704 (+3%) | 2mo | $335,000 | $197 | 66 |
| 1008 Wolcott Ave | 0.21mi | 3/2.0 (-1) | 1,485 (-10%) | 2mo | $340,000 | $229 | 64 |
| 3840 Lenoir Cir | 0.68mi | 3/2.0 (-1) | 1,698 (+2%) | 3mo | $326,000 | $192 | 55 |
| 888 Norview Arch | 0.71mi | 4/3.0 | 1,723 (+4%) | 6mo | $364,000 | $211 | 54 |
| 826 Norview Ave | 0.72mi | 4/2.0 | 1,550 (-7%) | 4mo | $325,000 | $210 | 50 |
| 6339 Alexander St | 0.59mi | 4/3.5 | 1,840 (+11%) | 2mo | $367,200 | $200 | 48 |
| 6330 Chesapeake Blvd | 0.58mi | 3/2.5 (-1) | 1,500 (-10%) | 5mo | $270,000 | $180 | 48 |
| 3821 Lenoir Cir | 0.74mi | 3/1.0 (-1) | 1,600 (-4%) | 2mo | $227,750 | $142 | 47 |
| 6324 Alexander St | 0.63mi | 3/1.0 (-1) | 1,500 (-10%) | 4mo | $177,600 | $118 | 40 |
| 6841 Cedarwood Ct | 0.72mi | 3/2.0 (-1) | 1,455 (-12%) | 3mo | $350,000 | $241 | 36 |
Match score weights: distance 35% · size 25% · config 20% · recency 20%. Top-matched comps best support the ARV.
Projected returns pro-forma
-3.0% appreciation · 3.42% rent growth · sell at horizon
- IRR
- -4.0%
- Equity multiple
- 0.85×
- Total profit
- $-7,935
- Equity at exit
- $28,330
- IRR
- 6.3%
- Equity multiple
- 1.48×
- Total profit
- $25,433
- Equity at exit
- $16,428
Cash invested: $53,200 (down + closing). Projections, not guarantees.
Landlord ↔ Tenant lean methodology
- Overall (STATE)
- 55 Moderately Landlord-Leaning
- State Virginia
- 55 Moderately Landlord-Leaning · D+2
- County
- — inherits STATE
- City
- — inherits STATE
ZIP-level market 23513
- Home prices YoY
- -9.3%
- Rents YoY
- 3.4%
- Active inventory
- 132
- Price-to-rent
- 7.2×
Monthly cashflow live
- Estimated rent
- $2,208 high interval (Pro) →
- Mortgage (P&I)
- −$996
- Tax from tax record
- −$326 /mo · $3,914/yr
- Insurance
- −$79
- HOA
- −$0
- Vacancy / Maint / Mgmt
- −$464
- Net cashflow
- $343
Break-even live
UW: 25.0% down · 7.5% · 30yr · 1.5% tax · 5.0% vac · 8.0% maint · 8.0% mgmt
Financing live
Cash to close
- Down payment
- $47,500
- Closing costs
- $5,700
- Reserves months
- —
- Total cash needed
- —
Loan-product check · same deal, 3 products live
Conventional
25% down · 7.5% · 30yr
- Down + closing
- —
- Monthly P&I
- —
- Monthly cashflow
- —
- DSCR
- —
- Eligible?
- —
Personal DTI + credit; lowest rate.
DSCR
20% down · 8.5% · 30yr
- Down + closing
- —
- Monthly P&I
- —
- Monthly cashflow
- —
- DSCR
- —
- Eligible?
- —
No personal income docs; deal must DSCR.
Hard money
10% down · 12.0% · 12mo
- Down + closing
- —
- Monthly P&I
- —
- Monthly cashflow
- —
- DSCR
- —
- Eligible?
- —
Short-term bridge; refi at stabilization.
Rent comps 29 comps
| Address | Beds | Baths | Sqft | Rent | $/sqft | DOM | Units | Dist |
|---|---|---|---|---|---|---|---|---|
| 837 Tifton St Norfolk, VA | 3.0 | 2.0 | 1072 | $2,300 | $2.15 | 23d | 1 | 0.50mi |
| 6430 Faraday Ct Norfolk, VA | 4.0 | 1.5 | 1319 | $1,995 | $1.51 | 43d | 1 | 0.62mi |
| 6261 Alexander St Norfolk, VA | 5.0 | 2.0 | 2166 | $2,495 | $1.15 | 43d | 1 | 0.67mi |
| 3819 Pamlico Cir Norfolk, VA | 3.0 | 1.0 | 1250 | $2,000 | $1.60 | 12d | 1 | 0.71mi |
| 7120 Clarion Ln Norfolk, VA | 4.0 | 2.0 | 1506 | $2,300 | $1.53 | 17d | 1 | 0.71mi |
| 941 Avenue G Unit G Norfolk, VA | 4.0 | 2.5 | 2029 | $2,600 | $1.28 | 3d | 1 | 0.73mi |
| 6451 Edward St Norfolk, VA | 3.0 | 2.5 | 1400 | $2,000 | $1.43 | 7d | 1 | 0.78mi |
| 1232 Norview Ave Unit NOR1232R-EA Norfolk, VA | 3.0 | 2.0 | 1106 | $1,600 | $1.45 | 43d | 1 | 0.81mi |
| 946 Avenue H Norfolk, VA | 4.0 | 2.0 | 1980 | $750 | $0.38 | 43d | 1 | 0.88mi |
| 6975 Bonnot Dr Norfolk, VA | 3.0 | 1.5 | 1188 | $1,700 | $1.43 | 43d | 1 | 0.89mi |
| 6450 Crescent Way Norfolk, VA | 1.0–3.0 | 1.0–2.0 | 1128 | $2,369 | $2.10 | 2d | 23 | 1.06mi |
| 3541 Chesapeake Blvd Norfolk, VA | 5.0 | 1.0 | 1476 | $1,275 | $0.86 | 7d | 1 | 1.12mi |
| 3504 Chesapeake Blvd Norfolk, VA | 3.0 | 2.0 | 1624 | $1,995 | $1.23 | 23d | 1 | 1.22mi |
| 3504 Chesapeake Blvd Norfolk, VA | 3.0 | 2.0 | 1624 | $1,995 | $1.23 | 43d | 1 | 1.22mi |
| 7922 Old Ocean View Rd Norfolk, VA | 1.0–3.0 | 1.0–1.5 | 890 | $1,300 | $1.46 | 1d | 3 | 1.24mi |
| 3521 Brest Ave Norfolk, VA | 3.0 | 2.0 | 1234 | $2,300 | $1.86 | 43d | 1 | 1.29mi |
| 8028 Glade Rd Norfolk, VA | 4.0 | 2.5 | 2061 | $2,900 | $1.41 | 43d | 1 | 1.30mi |
| 3653 Nottaway St Norfolk, VA | 3.0 | 1.5 | 1564 | $2,200 | $1.41 | 17d | 1 | 1.38mi |
| 405 San Antonio Blvd Norfolk, VA | 4.0 | 2.5 | 2200 | $2,600 | $1.18 | 12d | 1 | 1.38mi |
| 3414 Tidewater Dr Norfolk, VA | 4.0 | 2.5 | 2200 | $3,000 | $1.36 | 43d | 1 | 1.39mi |
| 3640 Robin Hood Rd Norfolk, VA | 4.0 | 2.5 | 1400 | $2,999 | $2.14 | 17d | 1 | 1.42mi |
| 218 Granby Park Dr Unit B Norfolk, VA | 3.0 | 1.0 | 1330 | $1,695 | $1.27 | 3d | 1 | 1.43mi |
| 218 Granby Park Dr Unit B Norfolk, VA | 3.0 | 1.0 | 1330 | $1,745 | $1.31 | 12d | 1 | 1.43mi |
| 218 Granby Park Dr Unit B Norfolk, VA | 3.0 | 1.0 | 1330 | $1,795 | $1.35 | 4d | 1 | 1.43mi |
| 8107 Old Ocean View Rd Norfolk, VA | 4.0 | 1.0 | 1562 | $2,095 | $1.34 | 17d | 1 | 1.43mi |
| 3477 E Bonner Dr Norfolk, VA | 3.0 | 1.0 | 1304 | $2,000 | $1.53 | 23d | 1 | 1.44mi |
| 6419 Grimes Ave Norfolk, VA | 3.0 | 2.0 | 1225 | $2,150 | $1.76 | 43d | 1 | 1.44mi |
| 845 Burksdale Rd Norfolk, VA | 5.0 | 2.0 | 1680 | $1,895 | $1.13 | 23d | 1 | 1.45mi |
| 4563 Shoshone Ct Norfolk, VA | 3.0 | 2.0 | 1600 | $2,500 | $1.56 | 43d | 1 | 1.47mi |
Listing history 50 events
-
2026-03-29status Under Contract
-
2026-03-27status Active
-
2026-03-27historical
-
2026-03-21$190,000 Active
-
2026-03-15historical
-
2025-11-07$270,000 Active
-
2025-11-07historical
-
2025-07-30$220,000 Active
-
2024-03-31historical $2,500
-
2024-02-16$2,500
-
2023-04-28status Under Contract
-
2023-04-13historical Active Under Contract
-
2023-04-06price $274,997
-
2023-04-04status Active
-
2023-03-31historical Active Under Contract
-
2023-03-27price $274,998
-
2023-03-26price $274,999
-
2023-03-16price $275,000
-
2023-03-09price $280,000
-
2023-03-06price $294,998
-
2023-02-27price $294,999
-
2023-02-17price $295,000
-
2023-02-10price $299,996
-
2023-01-31price $299,997
-
2023-01-20price $299,998
-
2023-01-18price $299,999
-
2023-01-09$300,000 Active
-
2022-12-27historical
-
2022-12-23price $297,893
-
2022-12-07price $297,894
-
2022-12-02price $298,894
-
2022-11-24price $298,895
-
2022-11-18price $298,896
-
2022-11-11price $298,897
-
2022-11-04price $298,898
-
2022-10-31price $298,899
-
2022-10-20$298,900 Active
-
2022-10-20historical
-
2022-10-08price $298,900
-
2022-09-06price $299,900
-
2022-08-16$305,000 Active
-
2022-06-15historical
-
2022-05-24$305,000 Active
-
2022-01-05soldstatus $182,500
-
2021-12-13status Under Contract
-
2021-10-29price $209,900
-
2021-10-15$219,900 Active
-
2015-05-01soldstatus $124,000
-
2015-02-02price $125,000
-
2015-01-19price $129,900
ⓘ Source: listings_history table (triggers on properties + properties_extension) + one-shot
backfill from property_details.listing_events for pre-trigger history.
Tax reassessment forecast VA · Resets to sale price
- Current annual tax
- $3,914 · $326/mo
- Projected year-2 tax
- $3,914 · $326/mo
- Expected delta
- $0/yr ($0/mo · 0.0%)
ⓘ Screening estimate from a state-policy table — verify with the county assessor before closing.
Climate risk First Street
- Flood 1/10 Low FEMA zone X (unshaded) · 0% chance over 30 yrs
- Wildfire 1/10 Low
- Heat 9/10 Extreme 7 d/yr ≥105°F today · 16 d/yr by 30 yrs out
- Wind 8/10 Severe 80% chance of damaging wind over 30 yrs
- Air quality 3/10 Moderate 2 unhealthy d/yr today · 3 by 30 yrs out
Nearby sold comps map
Loading sold comps map…
Walkable amenities ~0.75 mi
Loading nearby amenities…
Taxation est. · year 1
- Rental income
- $26,498
- − Mortgage interest
- −$10,643
- − Property taxes
- −$3,914
- − Insurance
- −$950
- − Repairs & maintenance
- −$2,120
- − Management
- −$2,120
- − Depreciation
- −$5,527
- Taxable income
- $1,224
- Est. tax owed @ 24.0%
- −$294
- After-tax cash flow
- $3,819/yr
For passive investors: Depreciation is non-cash, so a rental often shows a tax loss while cash-flowing — sheltering income. Rental losses are passive: they offset passive income freely, and up to $25,000/yr can offset ordinary (W-2) income if you actively participate and your MAGI is under $100k (phasing out to $0 by $150k); unused losses carry forward. On sale, claimed depreciation is recaptured at up to 25%, and gains may owe capital-gains tax (a 1031 exchange can defer both). Figures are a year-1 estimate at your 24.0% rate — not tax advice; consult a CPA.
Schools (NCES district)
- District
- Norfolk City Public School District
- NCES district ID
- 5102670
- Math proficiency
- 27% ▼ -44.00%
- Reading proficiency
- 56% ▼ -10.00%
- Median HH income
- $44,358
- Composite
- 35.08/100
- National rank
- #5026
- State rank
- #118 of 131 in VA
Livability — Norfolk
- Score
- 83/100
- State rank
- #43
- US rank
- #1026
Category grades
Schools grade is shown separately in the Schools card above.
Census & demographics
- Census place
- Norfolk, VA
- County
- Norfolk City · 214,042 people
- City population
- 214,042
- Metro
- Virginia Beach-Norfolk-Newport News, VA-NC
- Population (ZIP)
- 28,628
- Household income
- $68,380
- Rent vs Own
- Severe rent burden
- 1342.0
Population outlook (Norfolk County) Hauer SSP2
- Today (2025)
- 249,032 people
- By 2030
- 252,347 · +1.3%
- By 2040
- 253,644 · +1.9%
- By 2050
- 251,913 · +1.2%
- By 2075
- 245,281 · -1.5%
- By 2100
- 219,548 · -11.8%
Race, ethnicity, and origin ACS 2023
- Neighborhood character
- Diverse neighborhood (Simpson 0.63)
- Race & ethnicity
- Black 55% White 23% Hispanic / Latino 11% Two or more races 7% Asian 5%
- Hispanic origin (detail)
- Mexican 4% Puerto Rican 3%
- Common ancestry
- Romanian 1% Slovak 1% Lithuanian 0%
- Foreign-born
- 10% · Canada
- Languages at home
- 87% English-only · Spanish 6% Tagalog/Filipino 4% French/Haitian/Cajun 1%
Political lean MEDSL · Norfolk
- 2024 margin
- Solid D (+41.5) · D 70.0% · R 28.5% · Other 1.6%
- 2008→2024 swing
- -1.4pp toward R · 2008: 43.0pp · 2024: 41.5pp
- All cycles
- 2024: D+41.5 2020: D+45.6 2016: D+42.0 2012: D+44.0 2008: D+43.0
Not yet ingested
- Civics
- —
Market trends
- HPI YoY
- ▼ -33.67%
- Current HPI
- 329.2241
- Rent YoY
- ▲ 3.42%
- Metro
- Virginia Beach-Norfolk-Newport News, VA-NC
- State GDP YoY
- ▲ 2.40%
- F500 in state
- 50
Industry mix (Fortune 500 HQ in VA)
| Industry | F500 HQs | Revenue |
|---|---|---|
| Aerospace / Defense | 4 | $236B |
|
||
| Technology / Defense | 3 | $32B |
|
||
| Financial Services | 2 | $176B |
|
||
| Utilities | 2 | $27B |
|
||
| Insurance | 2 | $25B |
|
||
| Technology | 2 | $15B |
|
||
Price history
+1709.5% since first listed51 events — show timeline
- 2026-03-29 Pending — REINMLS
- 2026-03-27 Relisted — REINMLS
- 2026-03-27 Listing Removed — REINMLS
- 2026-03-21 Listed $190,000 REINMLS
- 2026-03-15 Listing Removed — REINMLS
- 2025-11-07 Listing Removed — REINMLS
- 2025-11-07 Listed $270,000 REINMLS
- 2025-07-30 Listed $220,000 REINMLS
- 2024-03-31 Rental Removed $2,500 Avail
- 2024-02-16 Listed for Rent $2,500 Avail
- 2023-04-28 Pending — REINMLS
- 2023-04-13 Contingent — REINMLS
- 2023-04-06 Price Changed $274,997 REINMLS
- 2023-04-04 Relisted — REINMLS
- 2023-03-31 Contingent — REINMLS
- 2023-03-27 Price Changed $274,998 REINMLS
- 2023-03-26 Price Changed $274,999 REINMLS
- 2023-03-16 Price Changed $275,000 REINMLS
- 2023-03-09 Price Changed $280,000 REINMLS
- 2023-03-06 Price Changed $294,998 REINMLS
- 2023-02-27 Price Changed $294,999 REINMLS
- 2023-02-17 Price Changed $295,000 REINMLS
- 2023-02-10 Price Changed $299,996 REINMLS
- 2023-01-31 Price Changed $299,997 REINMLS
- 2023-01-20 Price Changed $299,998 REINMLS
- 2023-01-18 Price Changed $299,999 REINMLS
- 2023-01-09 Listed $300,000 REINMLS
- 2022-12-27 Listing Removed — REINMLS
- 2022-12-23 Price Changed $297,893 REINMLS
- 2022-12-07 Price Changed $297,894 REINMLS
- 2022-12-02 Price Changed $298,894 REINMLS
- 2022-11-24 Price Changed $298,895 REINMLS
- 2022-11-18 Price Changed $298,896 REINMLS
- 2022-11-11 Price Changed $298,897 REINMLS
- 2022-11-04 Price Changed $298,898 REINMLS
- 2022-10-31 Price Changed $298,899 REINMLS
- 2022-10-20 Listing Removed — REINMLS
- 2022-10-20 Listed $298,900 REINMLS
- 2022-10-08 Price Changed $298,900 REINMLS
- 2022-09-06 Price Changed $299,900 REINMLS
- 2022-08-16 Listed $305,000 REINMLS
- 2022-06-15 Listing Removed — REINMLS
- 2022-05-24 Listed $305,000 REINMLS
- 2022-01-05 Sold (Public Records) $182,500 Public Records
- 2021-12-13 Pending — REINMLS
- 2021-10-29 Price Changed $209,900 REINMLS
- 2021-10-15 Listed $219,900 REINMLS
- 2015-05-01 Sold (Public Records) $124,000 Public Records
- 2015-02-02 Price Changed $125,000 REINMLS
- 2015-01-19 Price Changed $129,900 REINMLS
- 1962-02-09 Sold (Public Records) $10,500 Public Records
Property tax history
+6.3%/yrLatest (2025): $3,914 · +6.9% YoY. Source: county tax records.
Cash-flow waterfall
monthlySold comps — $/sqft
last 12 mo · ≤1 miLoading sold comps…