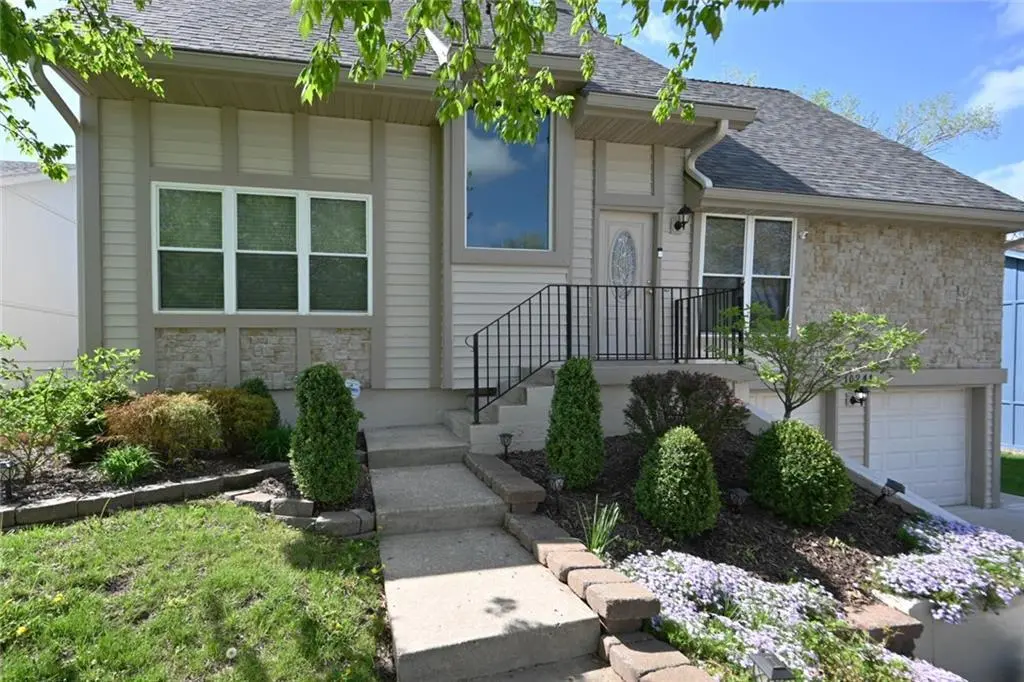
10241 NW 57th St · Parkville, MO
Flood risk 1/10 · Minimal
- FEMA flood zone
- X (unshaded)
- Chance of flooding over 30 yrs
- 0.0%
- Est. flood insurance / yr
- $473 – $860
Fire risk 1/10 · Minimal
- Est. fire insurance / yr
- $1,054 – $1,958
Heat risk 4/10 · Minor
- Hot days now (above 108°F)
- 7 days/yr
- Hot days in 30 yrs
- 17 days/yr
Wind risk 2/10 · Minimal
- Chance of severe wind over 30 yrs
- —
Air-quality risk 2/10 · Minimal
- Unhealthy air days now
- 2 days/yr
- Unhealthy air days in 30 yrs
- 2 days/yr
Risk factors via First Street. Map © Google.
Why this score? — see what drove the D- grade
The composite is a weighted blend of 9 inputs, each scored 0–100. Each bar is that input's sub-score; the figure is the points it added to the 100-point composite (weight × sub-score).
- Appreciation +10.0/10.0
- Cash flow +7.3/30.0
- Schools +4.5/10.0
- Rent growth +4.3/5.0
- Livability +3.8/5.0
- Condition / age +2.5/5.0
- 1% rule +1.7/10.0
- DSCR +1.4/10.0
- ARV discount +0.5/15.0
$349,000
🖨 Deal sheet (PDF) 📄 Offer letter ✓ Due diligence
Listing remarks MLS
Pc4029 Compare To New! Light & Open Flr Plan Features Grt Rm W/ Corner Stone Fireplace & Mstr On The Main Level. Two Charming & Spacious Bdrms On 2nd Flr Finished Rec Rm W/ Half Bath. Oversize 2 Car Garage. Large Lot W/ Trees Backs Up To River Hills.
Key facts
- 8,037 sq ft lot
- 2 garage spots
- Community pool
Neighborhood map
What this means for you Summary
Snapshot
- This is a 3-bed/2.5-bath single-family listed at $349k.
Deal economics
- At list price, monthly cash flow is $-472 ($-6k/yr) — negative.
- To cash-flow at today's rent, offer at most $266k (23.9% below list).
- To meet the 1% rule (rent ≥ 1% of price), the offer needs to be $233k (33.2% below list).
- Recommended offer: $233k (33.2% below list) — sets the bar for 1% rule.
- Cap rate 4.7% vs local median 1.7% in Parkville — top-decile yield for the area; either an underpriced asset or a hidden risk that comps aren't pricing in. Stress-test before assuming the spread holds.
Location & tenants
- Location reads 76/100 on livability (#51 in MO, #3,695 nationally) — a middle-class / working-renter tenant base. Strengths: crime A+, employment A+, housing A+; Watch: health & safety C-, amenities F, commute F.
- Park Hill (urban): math 47% / reading 54% proficiency, ranked #26 of 324 in MO (top 8%) — acceptable for families but not a draw, mixed tenant base, ~2y average lease.
- Zoned schools: Union Chapel Elem. (math 59% / reading 60%, grade B-, #124 of 1,115 statewide, top 13%, 606 students, 14% FRL); Plaza Middle (math 37% / reading 51%, grade D, #121 of 391 statewide, top 32%, 715 students, 30% FRL); Park Hill South High (math 67% / reading 69%, grade B, #13 of 521 statewide, top 2%, 1,860 students, 25% FRL) — zoned schools at 23% FRL track the district average.
- Market conditions: Rents rising fast (+7.0%/yr); 268 active listings in the ZIP; 4 comparable units currently listed for rent nearby; rentals at typical pace (median 26d on market — plan ~3-4 weeks tenant-placement turnaround); high-income renter base; 234 units permitted in Platte County in 2024 (0 in 5+ unit buildings).
Forward outlook
- In year one you build about $37k of equity ($2k loan paydown + $35k appreciation (10.0% local appreciation)).
- Platte County population projected at +31% by 2050 — long-run rental-demand tailwind backs the buy-and-hold thesis.
- By year 2, paydown + projected appreciation supports a ~$60k cash-out refi (75% LTV) — recoverable capital for the next deal without selling this one.
Negotiation context
- Only 2 days on market — expect competitive offers; lowballing is unlikely to land.
- 2 sale attempts since 25y ago with the ask held roughly flat each time — persistent listings suggest the price (not the market) is what's stuck; bring a comps-based counter.
Questions for the listing agent
- What do current leases actually rent for vs. the listed asking? Can we see a recent rent roll and the last 12 months of T-12 income?
- What does the HOA fee cover, when was the last increase, and are there any pending special assessments or reserve-fund shortfalls?
- Is there a deadline driving the sale (1031 exchange, divorce, estate, relocation)? That informs how much negotiation room exists.
- Schools are B-rated — typically a magnet for longer-tenancy family renters. What's the average tenant stay here, and is there a school-zone premium baked into asking?
- The area grade is low — what's the realistic commute time and amenity access for the typical tenant pool here? Any planned neighborhood developments (good or bad) we should know about?
- What's the average days-on-market for RENTAL listings here right now (not sales)? A rising rental-DOM trend means longer vacancies and softer asking-rent achievability than the comps imply.
- What's the recent tenant-quality profile in this submarket — average credit score on applications, eviction rate, late-payment / NSF rate, and stable-employment percentage? A property-management company in the area should have these aggregated.
- How much new for-sale + rental construction is in the pipeline within 1–3 miles? Heavy new supply typically softens prices + rents 12–24 months out; constrained supply supports both.
Investment metrics
- 1% rule
- 0.67% ✗
- Cap rate
- 4.67%
- Cash-on-cash
- -5.80%
- DSCR
- 0.74
- GRM
- 12.5
CMA / ARV
- ARV (on-the-fly)
- $301,940
- Comps found
- 12
Show comp detail 12 sales within ~0.75 mi
| Address | Dist | Beds/Ba | Sqft | Sold | Price | $/sf | Match |
|---|---|---|---|---|---|---|---|
| 10705 NW 58th St | 0.26mi | 4/2.5 (+1) | 1,939 (-0%) | 2mo | $279,000 | $144 | 80 |
| 5527 NW Seminole Dr | 0.33mi | 3/3.0 | 1,956 (+0%) | 2mo | $289,950 | $148 | 80 |
| 10307 NW 57 St | 0.05mi | 3/2.5 | 1,848 (-5%) | 17mo | $285,000 | $154 | 75 |
| 5710 NW High Hill St | 0.24mi | 3/2.5 | 1,864 (-4%) | 10mo | $289,000 | $155 | 74 |
| 10604 NW Verlin Dr | 0.19mi | 4/3.0 (+1) | 1,916 (-2%) | 13mo | $315,000 | $164 | 70 |
| 5510 NW Seminole Dr | 0.44mi | 3/3.0 | 1,936 (-1%) | 9mo | $274,000 | $142 | 69 |
| 10407 NW Crooked Rd | 0.19mi | 3/2.0 | 1,673 (-14%) | 1mo | $275,000 | $164 | 65 |
| 5815 NW Aspen Ln | 0.25mi | 3/2.0 | 2,118 (+9%) | 14mo | $264,700 | $125 | 60 |
| 11005 Walnut Creek Dr | 0.51mi | 4/3.0 (+1) | 2,025 (+4%) | 4mo | $360,000 | $178 | 59 |
| 5521 NW Seminole Dr | 0.35mi | 3/2.5 | 1,683 (-14%) | 8mo | $310,000 | $184 | 55 |
| 9509 NW 59th Ter | 0.52mi | 3/2.5 | 1,670 (-14%) | 9mo | $270,000 | $162 | 44 |
| 5716 NW Verlin Dr | 0.33mi | 4/3.0 (+1) | 2,239 (+15%) | 17mo | $335,000 | $150 | 39 |
Match score weights: distance 35% · size 25% · config 20% · recency 20%. Top-matched comps best support the ARV.
Projected returns pro-forma
10.0% appreciation · 7.03% rent growth · sell at horizon
- IRR
- 21.3%
- Equity multiple
- 2.74×
- Total profit
- $169,822
- Equity at exit
- $314,407
- IRR
- 20.1%
- Equity multiple
- 6.60×
- Total profit
- $547,164
- Equity at exit
- $678,030
Cash invested: $97,720 (down + closing). Projections, not guarantees.
Landlord ↔ Tenant lean methodology
- Overall (STATE)
- 81 Strongly Landlord-Friendly
- State Missouri
- 81 Strongly Landlord-Friendly · R+10
- County
- — inherits STATE
- City
- — inherits STATE
ZIP-level market 64152
- Home prices YoY
- 4.7%
- Rents YoY
- 7.0%
- Active inventory
- 268
- Price-to-rent
- 12.5×
Monthly cashflow live
- Estimated rent
- $2,332 medium interval (Pro) →
- Mortgage (P&I)
- −$1,830
- Tax from tax record
- −$289 /mo · $3,466/yr
- Insurance
- −$145
- HOA
- −$50
- Vacancy / Maint / Mgmt
- −$490
- Net cashflow
- $-472
Break-even live
Sensitivity live
| Price | -10% $-275 | -5% $-373 | +0% $-472 | +5% $-571 | +10% $-670 |
|---|---|---|---|---|---|
| Rent | -10% $-656 | -5% $-564 | +0% $-472 | +5% $-380 | +10% $-288 |
| Rate | -1.0pp $-296 | -0.5pp $-383 | base $-472 | +0.5pp $-563 | +1.0pp $-655 |
UW: 25.0% down · 7.5% · 30yr · 1.5% tax · 5.0% vac · 8.0% maint · 8.0% mgmt
Financing live
Cash to close
- Down payment
- $87,250
- Closing costs
- $10,470
- Reserves months
- —
- Total cash needed
- —
Loan-product check · same deal, 3 products live
Conventional
25% down · 7.5% · 30yr
- Down + closing
- —
- Monthly P&I
- —
- Monthly cashflow
- —
- DSCR
- —
- Eligible?
- —
Personal DTI + credit; lowest rate.
DSCR
20% down · 8.5% · 30yr
- Down + closing
- —
- Monthly P&I
- —
- Monthly cashflow
- —
- DSCR
- —
- Eligible?
- —
No personal income docs; deal must DSCR.
Hard money
10% down · 12.0% · 12mo
- Down + closing
- —
- Monthly P&I
- —
- Monthly cashflow
- —
- DSCR
- —
- Eligible?
- —
Short-term bridge; refi at stabilization.
Rent comps 4 comps
| Address | Beds | Baths | Sqft | Rent | $/sqft | DOM | Units | Dist |
|---|---|---|---|---|---|---|---|---|
| 5906 NW Harris Dr Kansas City, MO | 3.0 | 3.0 | 1648 | $2,321 | $1.41 | 6d | 1 | 0.64mi |
| 6601 N National Dr Unit 5993 Parkville, MO | 2.0 | 2.5 | 1850 | $2,250 | $1.22 | 25d | 1 | 1.39mi |
| 6601 N National Dr Unit 5877 Parkville, MO | 3.0 | 2.5 | 2150 | $2,400 | $1.12 | 25d | 1 | 1.39mi |
| 6601 N National Dr Unit 5856 Parkville, MO | 3.0 | 2.5 | 2300 | $2,400 | $1.04 | 45d | 1 | 1.39mi |
HOA detail
- Monthly dues
- $50 · $600/yr
Listing history 5 events
-
2026-04-17status Pending
-
2026-04-16$349,000 Active
-
2026-04-15historical $349,000
-
2001-05-10soldstatus 268-char remark
Show marketing remark (268 chars)
Pc4029 Compare To New! Light & Open Flr Plan Features Grt Rm W/ Corner Stone Fireplace & Mstr On The Main Level. Two Charming & Spacious Bdrms On 2nd Flr Finished Rec Rm W/ Half Bath. Oversize 2 Car Garage. Large Lot W/ Trees Backs Up To River Hills.
-
2001-02-10$145,900 268-char remark
Show marketing remark (268 chars)
Pc4029 Compare To New! Light & Open Flr Plan Features Grt Rm W/ Corner Stone Fireplace & Mstr On The Main Level. Two Charming & Spacious Bdrms On 2nd Flr Finished Rec Rm W/ Half Bath. Oversize 2 Car Garage. Large Lot W/ Trees Backs Up To River Hills.
ⓘ Source: listings_history table (triggers on properties + properties_extension) + one-shot
backfill from property_details.listing_events for pre-trigger history.
Tax reassessment forecast MO · Resets to sale price
- Current annual tax
- $3,466 · $289/mo
- Projected year-2 tax
- $3,466 · $289/mo
- Expected delta
- $0/yr ($0/mo · 0.0%)
ⓘ Screening estimate from a state-policy table — verify with the county assessor before closing.
Climate risk First Street
- Flood 1/10 Low FEMA zone X (unshaded) · 0% chance over 30 yrs
- Wildfire 1/10 Low
- Heat 4/10 Moderate 7 d/yr ≥108°F today · 17 d/yr by 30 yrs out
- Wind 2/10 Low
- Air quality 2/10 Low 2 unhealthy d/yr today · 2 by 30 yrs out
Nearby sold comps map
Loading sold comps map…
Walkable amenities ~0.75 mi
Loading nearby amenities…
Taxation est. · year 1
- Rental income
- $27,986
- − Mortgage interest
- −$19,549
- − Property taxes
- −$3,466
- − Insurance
- −$1,745
- − Repairs & maintenance
- −$2,239
- − Management
- −$2,239
- − HOA
- −$600
- − Depreciation
- −$10,153
- Taxable loss
- −$12,006
- Est. tax savings @ 24.0%
- +$2,881
- After-tax cash flow
- $-2,784/yr
For passive investors: Depreciation is non-cash, so a rental often shows a tax loss while cash-flowing — sheltering income. Rental losses are passive: they offset passive income freely, and up to $25,000/yr can offset ordinary (W-2) income if you actively participate and your MAGI is under $100k (phasing out to $0 by $150k); unused losses carry forward. On sale, claimed depreciation is recaptured at up to 25%, and gains may owe capital-gains tax (a 1031 exchange can defer both). Figures are a year-1 estimate at your 24.0% rate — not tax advice; consult a CPA.
Schools (NCES district)
- District
- Park Hill
- NCES district ID
- 2923550
- Math proficiency
- 47% ▼ -3.00%
- Reading proficiency
- 54% ▼ -3.00%
- Median HH income
- $67,616
- Composite
- 44.86/100
- National rank
- #2723
- State rank
- #26 of 324 in MO
Livability — Parkville
- Score
- 76/100
- State rank
- #51
- US rank
- #3695
Category grades
Schools grade is shown separately in the Schools card above.
Census & demographics
- County
- Platte County · 100,198 people
- Metro
- Kansas City, MO-KS
- Population (ZIP)
- 31,545
- Household income
- $114,688
- Rent vs Own
- Severe rent burden
- 234.0
Population outlook (Platte County) Hauer SSP2
- Today (2025)
- 111,772 people
- By 2030
- 119,173 · +6.6%
- By 2040
- 133,326 · +19.3%
- By 2050
- 146,617 · +31.2%
- By 2075
- 178,626 · +59.8%
- By 2100
- 195,638 · +75.0%
Race, ethnicity, and origin ACS 2023
- Neighborhood character
- Predominantly White (82%)
- Race & ethnicity
- White 82% Hispanic / Latino 7% Two or more races 6% Black 3% Asian 2%
- Hispanic origin (detail)
- Mexican 5% Puerto Rican 1%
- Common ancestry
- Romanian 4% Italian 4% Slovak 4%
- Foreign-born
- 4% · Canada, China
- Languages at home
- 93% English-only · Spanish 3% Other Indo-European 1% German/W. Germanic 1%
Political lean MEDSL · Platte
- 2024 margin
- Toss-up / Even · D 47.7% · R 50.8% · Other 1.4%
- 2008→2024 swing
- +3.2pp toward D · 2008: -6.4pp · 2024: -3.1pp
- All cycles
- 2024: R+3.1 2020: R+3.0 2016: R+13.0 2012: R+14.2 2008: R+6.4
Not yet ingested
- Civics
- —
Market trends
- HPI YoY
- ▲ 33.10%
- Current HPI
- 739.89
- Rent YoY
- ▲ 7.03%
- Metro
- Kansas City, MO-KS
- State GDP YoY
- ▲ 1.84%
- F500 in state
- 20
Industry mix (Fortune 500 HQ in MO)
| Industry | F500 HQs | Revenue |
|---|---|---|
| Healthcare | 1 | $163B |
|
||
| Insurance | 1 | $21B |
|
||
| Industrial Technology | 1 | $17B |
|
||
| Retail | 1 | $16B |
|
||
| Industrial Distribution | 1 | $10B |
|
||
| Utilities | 1 | $9B |
|
||
Price history
+139.2% since first listed5 events — show timeline
- 2026-04-17 Pending — Heartland MLS as Distributed by MLS Grid
- 2026-04-16 Listed $349,000 Heartland MLS as Distributed by MLS Grid
- 2026-04-15 Coming Soon $349,000 Heartland MLS as Distributed by MLS Grid
- 2001-05-10 Sold (MLS) — Heartland MLS as Distributed by MLS Grid
- 2001-02-10 Listed $145,900 Heartland MLS as Distributed by MLS Grid
Property tax history
+5.2%/yrLatest (2025): $3,466 · +12.1% YoY. Source: county tax records.
Cash-flow waterfall
monthlySold comps — $/sqft
last 12 mo · ≤1 miLoading sold comps…