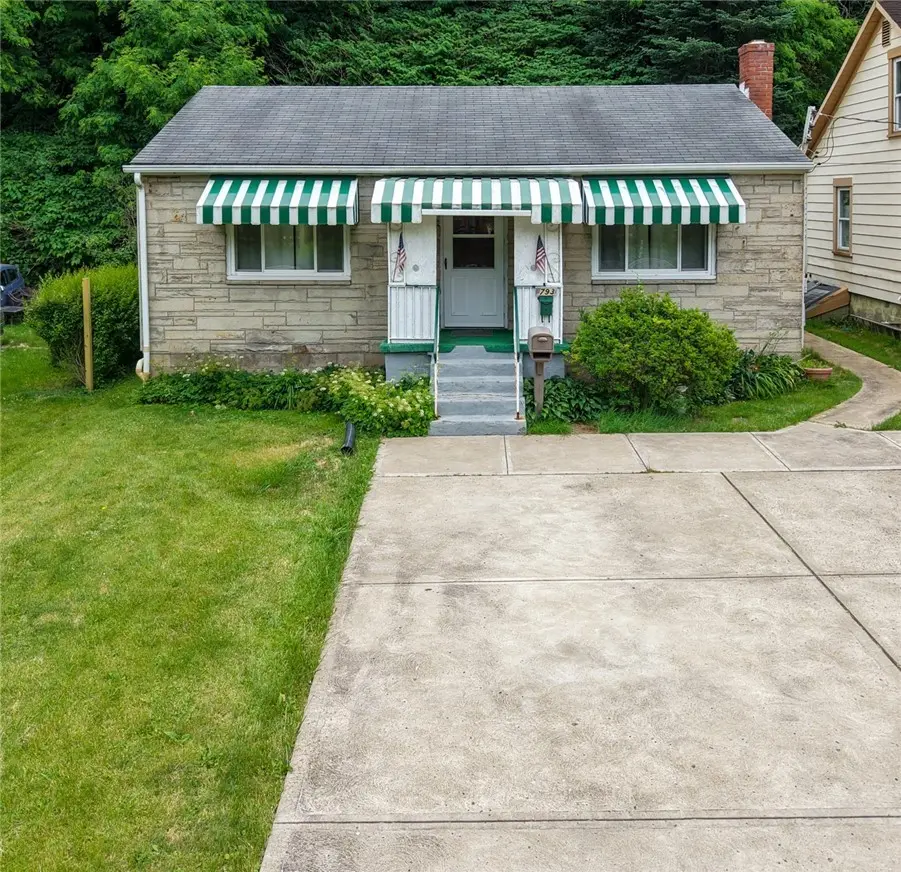
793 Becks Run Rd · Baldwin, PA
Flood risk 9/10 · Severe
- FEMA flood zone
- X (unshaded)
- Chance of flooding over 30 yrs
- 0.79%
- Est. flood insurance / yr
- $473 – $860
Fire risk 1/10 · Minimal
- Est. fire insurance / yr
- $511 – $949
Heat risk 4/10 · Minor
- Hot days now (above 97°F)
- 7 days/yr
- Hot days in 30 yrs
- 17 days/yr
Wind risk 2/10 · Minimal
- Chance of severe wind over 30 yrs
- —
Air-quality risk 3/10 · Minor
- Unhealthy air days now
- 3 days/yr
- Unhealthy air days in 30 yrs
- 5 days/yr
Risk factors via First Street. Map © Google.
Why this score? — see what drove the B grade
The composite is a weighted blend of 9 inputs, each scored 0–100. Each bar is that input's sub-score; the figure is the points it added to the 100-point composite (weight × sub-score).
- Cash flow +30.0/30.0
- 1% rule +10.0/10.0
- DSCR +10.0/10.0
- ARV discount +5.5/15.0
- Rent growth +4.6/5.0
- Schools +4.0/10.0
- Livability +4.0/5.0
- Condition / age +2.5/5.0
- Appreciation +0.0/10.0
$109,000
🖨 Deal sheet 📄 Offer letter ✓ Due diligence
Listing remarks MLS
CLEAN GREAT STARTER HOUSE LOTS OF STORAGE PLEASE CALL FIRST LOT BLOCK 31-E-256,31-E-251
Key facts
- Ranch style home
- Full basement
- Equipped kitchen
Tags
Property features AI
Exterior
- Parking: Off-street parking
- Utilities: Public water; Public sewer
- Home design: Single-story dwelling; Resale property
- Construction: Frame construction; Asphalt roof
- Exterior features: Off-street parking; Small lot (approx. 0.0292 acres)
Interior
- Kitchen: Stove; Refrigerator
- Bedrooms: Bedroom on main level
- Bathrooms: 1 full bathroom
- Heating & cooling: Gas heating; Wall/window cooling units
- Interior features: Full walk-up basement
- Laundry & utility: Washer; Dryer
Neighborhood map
What this means for you Summary
Snapshot
- This is a 2-bed/1.0-bath single-family listed at $109k.
Deal economics
- At list price, monthly cash flow is $1k ($14k/yr) — positive.
- The deal already cash-flows at list — no discount required.
- Meets the 1% rule at list price ($2k rent vs $109k).
- Cap rate 19.6% vs local median 3.5% in Baldwin — top-decile yield for the area; either an underpriced asset or a hidden risk that comps aren't pricing in. Stress-test before assuming the spread holds.
Location & tenants
- Location reads 81/100 on livability (#189 in PA, #1,596 nationally) — a professional / high-income tenant draw. Strengths: cost of living A+, housing A+, employment A; Watch: schools D+, commute F.
- Baldwin-Whitehall SD (suburban): math 34% / reading 58% proficiency, ranked #246 of 539 in PA (top 46%) — families likely to look elsewhere, expect single-tenant / working-renter base with shorter leases.
- Market conditions: Rents rising fast (+8.5%/yr); 1 active listings in the ZIP; 6 comparable units currently listed for rent nearby; rentals leasing fast (median 2d on market — plan ~1-2 weeks tenant-placement turnaround); 2,996 units permitted in Allegheny County in 2024 (1,588 in 5+ unit buildings).
- At $2,494/mo this rent would consume 57% of the median local household income ($52k/yr) (locally 1249% of renters already pay >50% of income on rent) — very limited rent-growth headroom before tenants either downsize or default.
Forward outlook
- Local home prices are declining (-3.0%/yr); year-one equity from $754 of loan paydown is wiped out by about $3k of value loss. Plan a longer hold.
- At projected returns (-3.0% appreciation + 8.0% rent growth), your $31k cash investment doubles in ~3 years — after that, you're playing with house money.
Negotiation context
- Only 7 days on market — expect competitive offers; lowballing is unlikely to land.
- 2 sale attempts since 28y ago with the ask held roughly flat each time — persistent listings suggest the price (not the market) is what's stuck; bring a comps-based counter.
- Current owner paid $48k; list at $109k implies a 127% gain — meaningful room to come down on a strong offer.
Risks & watch-outs
- Watch-outs: flood insurance adds $56/mo.
- Climate carrying-cost: severe flood risk — expect insurance premiums to compound above CPI over the hold.
Questions for the listing agent
- Built in 1971 — when were the roof, HVAC, electrical panel, plumbing, and water heater last replaced?
- What's the actual annual flood-insurance premium (NFIP or private), and is the property in a SFHA with mandatory coverage?
- Is there a deadline driving the sale (1031 exchange, divorce, estate, relocation)? That informs how much negotiation room exists.
- Schools are D-rated, which usually means shorter tenancies and higher turnover. Who's the typical renter profile here, and what's been the actual vacancy rate?
- What's the average days-on-market for RENTAL listings here right now (not sales)? A rising rental-DOM trend means longer vacancies and softer asking-rent achievability than the comps imply.
- What's the recent tenant-quality profile in this submarket — average credit score on applications, eviction rate, late-payment / NSF rate, and stable-employment percentage? A property-management company in the area should have these aggregated.
- How much new for-sale + rental construction is in the pipeline within 1–3 miles? Heavy new supply typically softens prices + rents 12–24 months out; constrained supply supports both.
Investment metrics
- 1% rule
- 2.29% ✓
- Cap rate
- 19.63%
- Cash-on-cash
- 47.65%
- DSCR
- 3.12
- GRM
- 3.6
CMA / ARV
- ARV (on-the-fly)
- $104,448
- Comps found
- 3
Show comp detail 3 sales within ~0.75 mi
| Address | Dist | Beds/Ba | Sqft | Sold | Price | $/sf | Match |
|---|---|---|---|---|---|---|---|
| 976 Agnew Rd | 0.73mi | 2/1.0 | 782 (+2%) | 8mo | $165,000 | $211 | 56 |
| 720 Fisher St | 0.71mi | 2/1.5 | 785 (+2%) | 17mo | $106,530 | $136 | 47 |
| 216 Dengler St | 0.47mi | 1/1.0 (-1) | 872 (+14%) | 11mo | $35,000 | $40 | 41 |
Match score weights: distance 35% · size 25% · config 20% · recency 20%. Top-matched comps best support the ARV.
Projected returns pro-forma
-3.0% appreciation · 8.0% rent growth · sell at horizon
- IRR
- 48.4%
- Equity multiple
- 3.27×
- Total profit
- $69,239
- Equity at exit
- $16,252
- IRR
- 56.1%
- Equity multiple
- 8.06×
- Total profit
- $215,418
- Equity at exit
- $9,424
Cash invested: $30,520 (down + closing). Projections, not guarantees.
Landlord ↔ Tenant lean methodology
- Overall (STATE)
- 62 Landlord-Friendly
- State Pennsylvania
- 62 Landlord-Friendly · EVEN
- County
- — inherits STATE
- City
- — inherits STATE
ZIP-level market 15210
- Home prices YoY
- -27.8%
- Rents YoY
- 8.5%
- Active inventory
- 1
- Price-to-rent
- 3.6×
Monthly cashflow live
- Estimated rent
- $2,494 high interval (Pro) →
- Mortgage (P&I)
- −$572
- Tax from tax record
- −$141 /mo · $1,697/yr
- Insurance
- −$45
- Flood insurance flood zone
- −$56 /mo · $666/yr
- HOA
- −$0
- Vacancy / Maint / Mgmt
- −$524
- Net cashflow
- $1,156
Break-even live
UW: 25.0% down · 7.5% · 30yr · 1.5% tax · 5.0% vac · 8.0% maint · 8.0% mgmt
Financing live
Cash to close
- Down payment
- $27,250
- Closing costs
- $3,270
- Reserves months
- —
- Total cash needed
- —
Loan-product check · same deal, 3 products live
Conventional
25% down · 7.5% · 30yr
- Down + closing
- —
- Monthly P&I
- —
- Monthly cashflow
- —
- DSCR
- —
- Eligible?
- —
Personal DTI + credit; lowest rate.
DSCR
20% down · 8.5% · 30yr
- Down + closing
- —
- Monthly P&I
- —
- Monthly cashflow
- —
- DSCR
- —
- Eligible?
- —
No personal income docs; deal must DSCR.
Hard money
10% down · 12.0% · 12mo
- Down + closing
- —
- Monthly P&I
- —
- Monthly cashflow
- —
- DSCR
- —
- Eligible?
- —
Short-term bridge; refi at stabilization.
Rent comps 6 comps
| Address | Beds | Baths | Sqft | Rent | $/sqft | DOM | Units | Dist |
|---|---|---|---|---|---|---|---|---|
| 960 Agnew Rd Pittsburgh, PA | 3.0 | 2.0 | 950 | $1,295 | $1.36 | 14d | 1 | 0.72mi |
| 2984 Sidney St Pittsburgh, PA | 2.0 | 1.0–2.0 | 890 | $2,824 | $3.17 | 1d | 18 | 1.10mi |
| 2529 E Carson St Pittsburgh, PA | 1.0–2.0 | 1.0–2.0 | 1007 | $2,630 | $2.61 | 1d | 29 | 1.34mi |
| 2626 Tunnel Blvd Pittsburgh, PA | 3.0 | 1.0–2.0 | 846 | $2,755 | $3.26 | 1d | 14 | 1.40mi |
| 2695 S Water St Pittsburgh, PA | 2.0 | 1.0–2.0 | 838 | $3,666 | $4.37 | 1d | 15 | 1.42mi |
| 2024 Jane St Pittsburgh, PA | 1.0 | 1.0 | 573 | $3,010 | $5.25 | 1d | 40 | 1.43mi |
Listing history 7 events
-
2026-06-18days on market $109,000 Active 7 DOM
-
2026-06-17days on market $109,000 Active 6 DOM
-
2026-06-16days on market $109,000 Active 5 DOM
-
2026-06-15days on market $109,000 Active 4 DOM
-
2026-06-13days on market $109,000 Active 2 DOM
-
2026-06-13remarks 481-char remark
-
2026-06-13$109,000 Active 1 DOM
ⓘ Source: listings_history table (triggers on properties + properties_extension) + one-shot
backfill from property_details.listing_events for pre-trigger history.
Tax reassessment forecast PA · Partial reset (capped growth)
- Current annual tax
- $1,697 · $141/mo
- Projected year-2 tax
- $1,709 · $142/mo
- Expected delta
- +$13/yr (+$1/mo · 0.7%)
ⓘ Screening estimate from a state-policy table — verify with the county assessor before closing.
Climate risk First Street
- Flood 9/10 Extreme FEMA zone X (unshaded) · 79% chance over 30 yrs
- Wildfire 1/10 Low
- Heat 4/10 Moderate 7 d/yr ≥97°F today · 17 d/yr by 30 yrs out
- Wind 2/10 Low
- Air quality 3/10 Moderate 3 unhealthy d/yr today · 5 by 30 yrs out
Nearby sold comps map
Loading sold comps map…
Walkable amenities ~0.75 mi
Loading nearby amenities…
Taxation est. · year 1
- Rental income
- $29,928
- − Mortgage interest
- −$6,106
- − Property taxes
- −$1,697
- − Insurance
- −$1,212
- − Repairs & maintenance
- −$2,394
- − Management
- −$2,394
- − Depreciation
- −$3,171
- Taxable income
- $12,955
- Est. tax owed @ 24.0%
- −$3,109
- After-tax cash flow
- $10,767/yr
For passive investors: Depreciation is non-cash, so a rental often shows a tax loss while cash-flowing — sheltering income. Rental losses are passive: they offset passive income freely, and up to $25,000/yr can offset ordinary (W-2) income if you actively participate and your MAGI is under $100k (phasing out to $0 by $150k); unused losses carry forward. On sale, claimed depreciation is recaptured at up to 25%, and gains may owe capital-gains tax (a 1031 exchange can defer both). Figures are a year-1 estimate at your 24.0% rate — not tax advice; consult a CPA.
Schools (NCES district)
- District
- Baldwin-Whitehall SD
- NCES district ID
- 4202970
- Math proficiency
- 34% ▼ -20.00%
- Reading proficiency
- 58% ▼ -14.00%
- Median HH income
- $54,368
- Composite
- 39.79/100
- National rank
- #3880
- State rank
- #246 of 539 in PA
Livability — Baldwin
- Score
- 81/100
- State rank
- #189
- US rank
- #1596
Category grades
Schools grade is shown separately in the Schools card above.
Census & demographics
- Census place
- Baldwin, PA
- County
- Allegheny County · 1,022,028 people
- Metro
- Pittsburgh, PA
- Population (ZIP)
- 25,227
- Household income
- $52,169
- Rent vs Own
- Severe rent burden
- 1249.0
Population outlook (Allegheny County) Hauer SSP2
- Today (2025)
- 1,250,282 people
- By 2030
- 1,256,482 · +0.5%
- By 2040
- 1,256,318 · +0.5%
- By 2050
- 1,244,169 · -0.5%
- By 2075
- 1,197,693 · -4.2%
- By 2100
- 1,093,187 · -12.6%
Race, ethnicity, and origin ACS 2023
- Neighborhood character
- Diverse neighborhood (Simpson 0.62)
- Race & ethnicity
- White 53% Black 30% Hispanic / Latino 7% Two or more races 6% Asian 3%
- Hispanic origin (detail)
- Mexican 2% Puerto Rican 1%
- Common ancestry
- Romanian 7% Italian 1% Slovak 1%
- Foreign-born
- 8% · Canada, India, Guatemala
- Languages at home
- 89% English-only · Spanish 5% Other Indo-European 2% French/Haitian/Cajun 1%
Political lean MEDSL · Allegheny
- 2024 margin
- Strong D (+20.3) · D 59.7% · R 39.4%
- 2008→2024 swing
- +4.8pp toward D · 2008: 15.5pp · 2024: 20.3pp
- All cycles
- 2024: D+20.3 2020: D+20.4 2016: D+16.4 2012: D+14.4 2008: D+15.5
Not yet ingested
- Civics
- —
Market trends
- HPI YoY
- ▼ -80.71%
- Current HPI
- 209.9785
- Rent YoY
- ▲ 8.49%
- Metro
- Pittsburgh, PA
- State GDP YoY
- ▲ 1.68%
- F500 in state
- 34
Industry mix (Fortune 500 HQ in PA)
| Industry | F500 HQs | Revenue |
|---|---|---|
| Healthcare | 2 | $309B |
|
||
| Insurance | 2 | $27B |
|
||
| Telecommunications / Media | 1 | $124B |
|
||
| Industrial Distribution | 1 | $22B |
|
||
| Financial Services | 1 | $20B |
|
||
| Chemicals / Materials | 1 | $18B |
|
||
Price history
+98.5% since first listed4 events — show timeline
- 2026-06-11 Listed $109,000 West Penn MLS
- 1998-10-01 Sold (Public Records) $48,000 Public Records
- 1998-09-30 Sold (MLS) $48,000 West Penn MLS
- 1998-06-02 Listed $54,900 West Penn MLS
Property tax history
+2.3%/yrLatest (2026): $1,697 · +0.0% YoY. Source: county tax records.
Cash-flow waterfall
monthlySold comps — $/sqft
last 12 mo · ≤1 miLoading sold comps…