7703 Cornwall Rd · Stovall, NC
Flood risk 1/10 · Minimal
- FEMA flood zone
- X (unshaded)
- Chance of flooding over 30 yrs
- 0.0%
- Est. flood insurance / yr
- $507 – $1,088
Fire risk 4/10 · Minor
- Est. fire insurance / yr
- $906 – $1,684
Heat risk 6/10 · Moderate
- Hot days now (above 105°F)
- 7 days/yr
- Hot days in 30 yrs
- 17 days/yr
Wind risk 6/10 · Moderate
- Chance of severe wind over 30 yrs
- 27.0%
Air-quality risk 2/10 · Minimal
- Unhealthy air days now
- 1 days/yr
- Unhealthy air days in 30 yrs
- 1 days/yr
Risk factors via First Street. Map © Google.
Why this score? — see what drove the C- grade
The composite is a weighted blend of 9 inputs, each scored 0–100. Each bar is that input's sub-score; the figure is the points it added to the 100-point composite (weight × sub-score).
- Cash flow +22.4/30.0
- ARV discount +7.5/15.0
- DSCR +7.2/10.0
- 1% rule +5.4/10.0
- Livability +3.4/5.0
- Schools +2.8/10.0
- Rent growth +2.5/5.0
- Condition / age +2.5/5.0
- Appreciation +0.0/10.0
$125,000
🖨 Deal sheet (PDF) 📄 Offer letter ✓ Due diligence
Listing remarks
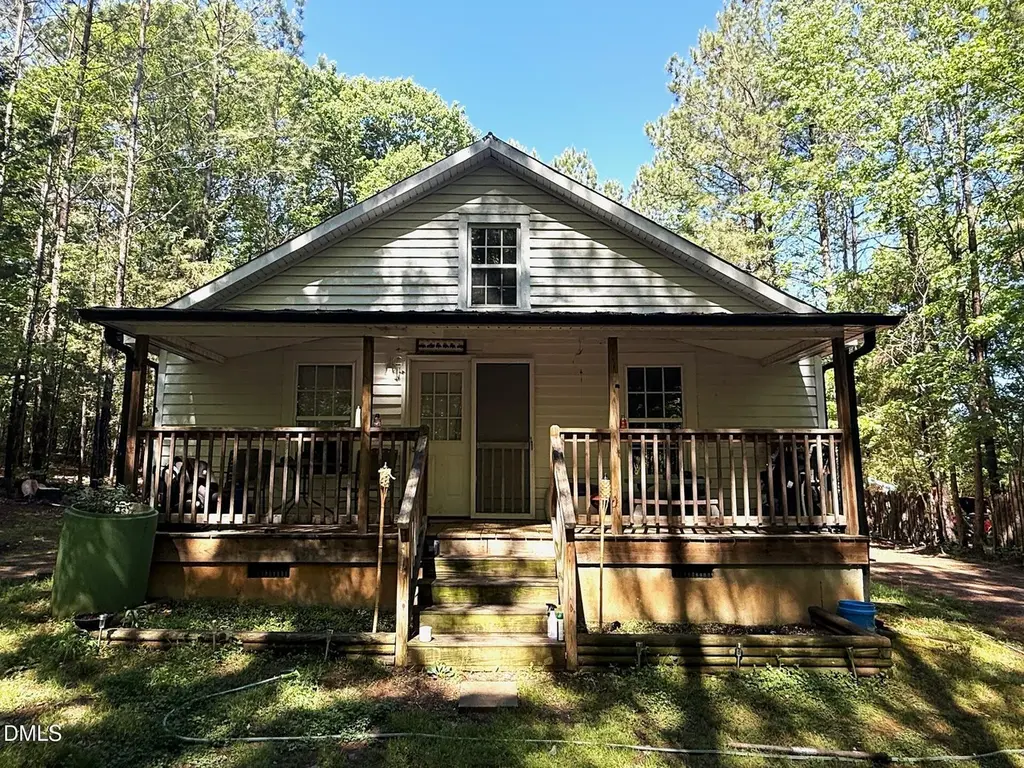
Great investment opportunity in Oxford, NC! Situated on approximately 1.75 surveyed acres, this property offers a great opportunity for investors, landlords, or buyers looking for a renovation project. Please note: online acreage records may still reflect the original larger parcel, but the home and land being sold have been surveyed off to approximately 1.75 acres. The home is currently tenant occupied on a month-to-month lease, providing immediate rental income potential. Property does need repairs and updates and is being sold as-is, making it an excellent option for those looking to add value and create a strong investment property or rental home.
Key facts
- Tenant occupied
- Repairs and updates
- 1.75 acre lot
Tags
Property features AI
Finance
- Other: Located in Granville County
- HOA & community: No association
Exterior
- Utilities: Well water; Septic tank
- Home design: Single-story house
- Construction: Vinyl siding; Aluminum roof; Block and concrete perimeter foundation; Built as a house (1,056 sq ft living area)
- Exterior features: 1.75-acre lot; Publicly maintained road access
Interior
- Bedrooms: 1 bedroom (main level)
- Flooring: Luxury vinyl
- Bathrooms: 1 full bathroom
- Heating & cooling: Central heating; Central air
- Interior features: Luxury vinyl flooring; Central heating and central air
Neighborhood map
What this means for you Summary
Snapshot
- This is a 1-bed/2.0-bath single-family listed at $125k.
Deal economics
- At list price, monthly cash flow is $209 ($3k/yr) — positive.
- The deal already cash-flows at list — no discount required.
- Meets the 1% rule at list price ($1k rent vs $125k).
Location & tenants
- Location reads 67/100 on livability (#231 in NC) — a middle-class / working-renter tenant base. Strengths: cost of living A+, housing A+, health & safety A+; Watch: crime F, amenities F, commute F.
- Granville County Schools (rural): math 28% / reading 36% proficiency, ranked #137 of 178 in NC (top 77%) — families likely to look elsewhere, expect single-tenant / working-renter base with shorter leases.
- Zoned schools: Northern Granville Middle (math 17% / reading 28%, grade F, #410 of 475 statewide, top 87%, 525 students, 82% FRL) — zoned schools average 82% FRL vs 50% district-wide (32 pts higher); higher-poverty schools than district average — tighter screening recommended.
- Market conditions: 260 active listings in the ZIP; 428 units permitted in Granville County in 2024 (120 in 5+ unit buildings).
Forward outlook
- Local home prices are declining (-3.0%/yr); year-one equity from $864 of loan paydown is wiped out by about $4k of value loss. Plan a longer hold.
Negotiation context
- Only 10 days on market — expect competitive offers; lowballing is unlikely to land.
Risks & watch-outs
- Climate carrying-cost: major wind risk, 27% chance of damaging wind over 30y; extreme-heat days projected 7→17/yr by 2055 (HVAC capex compounding) — expect insurance premiums to compound above CPI over the hold.
Questions for the listing agent
- Is there a deadline driving the sale (1031 exchange, divorce, estate, relocation)? That informs how much negotiation room exists.
- Schools are F-rated, which usually means shorter tenancies and higher turnover. Who's the typical renter profile here, and what's been the actual vacancy rate?
- Crime grade is F in this area — have there been break-ins, vandalism, or insurance claims at this property in the last 3 years? What carrier currently insures it and at what premium?
- What's the average days-on-market for RENTAL listings here right now (not sales)? A rising rental-DOM trend means longer vacancies and softer asking-rent achievability than the comps imply.
- What's the recent tenant-quality profile in this submarket — average credit score on applications, eviction rate, late-payment / NSF rate, and stable-employment percentage? A property-management company in the area should have these aggregated.
- How much new for-sale + rental construction is in the pipeline within 1–3 miles? Heavy new supply typically softens prices + rents 12–24 months out; constrained supply supports both.
Investment metrics
- 1% rule
- 1.04% ✓
- Cap rate
- 8.30%
- Cash-on-cash
- 7.15%
- DSCR
- 1.32
- GRM
- 8.0
CMA / ARV
No comps found within radius.
Projected returns pro-forma
-3.0% appreciation · 3.0% rent growth · sell at horizon
- IRR
- -5.4%
- Equity multiple
- 0.80×
- Total profit
- $-6,979
- Equity at exit
- $18,638
- IRR
- 4.3%
- Equity multiple
- 1.31×
- Total profit
- $11,000
- Equity at exit
- $10,808
Cash invested: $35,000 (down + closing). Projections, not guarantees.
Landlord ↔ Tenant lean methodology
- Overall (STATE)
- 85 Strongly Landlord-Friendly
- State North Carolina
- 85 Strongly Landlord-Friendly · R+3
- County
- — inherits STATE
- City
- — inherits STATE
ZIP-level market 27565
- Active inventory
- 260
- Price-to-rent
- 8.0×
Monthly cashflow live
- Estimated rent
- $1,303 medium interval (Pro) →
- Mortgage (P&I)
- −$656
- Tax from tax record
- −$113 /mo · $1,358/yr
- Insurance
- −$52
- HOA
- −$0
- Vacancy / Maint / Mgmt
- −$274
- Net cashflow
- $209
Break-even live
Sensitivity live
| Price | -10% $279 | -5% $244 | +0% $209 | +5% $173 | +10% $138 |
|---|---|---|---|---|---|
| Rent | -10% $106 | -5% $157 | +0% $209 | +5% $260 | +10% $312 |
| Rate | -1.0pp $272 | -0.5pp $240 | base $209 | +0.5pp $176 | +1.0pp $143 |
UW: 25.0% down · 7.5% · 30yr · 1.5% tax · 5.0% vac · 8.0% maint · 8.0% mgmt
Financing live
Cash to close
- Down payment
- $31,250
- Closing costs
- $3,750
- Reserves months
- —
- Total cash needed
- —
Loan-product check · same deal, 3 products live
Conventional
25% down · 7.5% · 30yr
- Down + closing
- —
- Monthly P&I
- —
- Monthly cashflow
- —
- DSCR
- —
- Eligible?
- —
Personal DTI + credit; lowest rate.
DSCR
20% down · 8.5% · 30yr
- Down + closing
- —
- Monthly P&I
- —
- Monthly cashflow
- —
- DSCR
- —
- Eligible?
- —
No personal income docs; deal must DSCR.
Hard money
10% down · 12.0% · 12mo
- Down + closing
- —
- Monthly P&I
- —
- Monthly cashflow
- —
- DSCR
- —
- Eligible?
- —
Short-term bridge; refi at stabilization.
Listing history 2 events
-
2026-05-18status Pending
-
2026-05-08$125,000 Active
ⓘ Source: listings_history table (triggers on properties + properties_extension) + one-shot
backfill from property_details.listing_events for pre-trigger history.
Tax reassessment forecast NC · Resets to sale price
- Current annual tax
- $1,358 · $113/mo
- Projected year-2 tax
- $1,358 · $113/mo
- Expected delta
- $0/yr ($0/mo · 0.0%)
ⓘ Screening estimate from a state-policy table — verify with the county assessor before closing.
Climate risk First Street
- Flood 1/10 Low FEMA zone X (unshaded) · 0% chance over 30 yrs
- Wildfire 4/10 Moderate
- Heat 6/10 Major 7 d/yr ≥105°F today · 17 d/yr by 30 yrs out
- Wind 6/10 Major 27% chance of damaging wind over 30 yrs
- Air quality 2/10 Low 1 unhealthy d/yr today · 1 by 30 yrs out
Nearby sold comps map
Loading sold comps map…
Walkable amenities ~0.75 mi
Loading nearby amenities…
Taxation est. · year 1
- Rental income
- $15,636
- − Mortgage interest
- −$7,002
- − Property taxes
- −$1,358
- − Insurance
- −$625
- − Repairs & maintenance
- −$1,251
- − Management
- −$1,251
- − Depreciation
- −$3,636
- Taxable income
- $512
- Est. tax owed @ 24.0%
- −$123
- After-tax cash flow
- $2,380/yr
For passive investors: Depreciation is non-cash, so a rental often shows a tax loss while cash-flowing — sheltering income. Rental losses are passive: they offset passive income freely, and up to $25,000/yr can offset ordinary (W-2) income if you actively participate and your MAGI is under $100k (phasing out to $0 by $150k); unused losses carry forward. On sale, claimed depreciation is recaptured at up to 25%, and gains may owe capital-gains tax (a 1031 exchange can defer both). Figures are a year-1 estimate at your 24.0% rate — not tax advice; consult a CPA.
Schools (NCES district)
- District
- Granville County Schools
- NCES district ID
- 3701800
- Math proficiency
- 28% ▼ -1.00%
- Reading proficiency
- 36% ▬ 0.00%
- Median HH income
- $49,713
- Composite
- 27.81/100
- National rank
- #6887
- State rank
- #137 of 178 in NC
Livability — Stovall
- Score
- 67/100
- State rank
- #231
- US rank
- #10718
Category grades
Schools grade is shown separately in the Schools card above.
Census & demographics
- City population
- 307
- Population (ZIP)
- 23,658
Population outlook (Granville County) Hauer SSP2
- Today (2025)
- 60,753 people
- By 2030
- 61,381 · +1.0%
- By 2040
- 61,861 · +1.8%
- By 2050
- 61,261 · +0.8%
- By 2075
- 59,948 · -1.3%
- By 2100
- 55,273 · -9.0%
Race, ethnicity, and origin ACS 2023
- Neighborhood character
- Diverse neighborhood (Simpson 0.59)
- Race & ethnicity
- White 50% Black 39% Two or more races 6% Hispanic / Latino 6%
- Hispanic origin (detail)
- Mexican 3%
- Common ancestry
- Slovak 1% Serbian 1% Italian 1%
- Foreign-born
- 3% · Canada
- Languages at home
- 95% English-only · Spanish 4%
Political lean MEDSL · Granville
- 2024 margin
- Lean R (+9.4) · D 44.8% · R 54.2%
- 2008→2024 swing
- -16.0pp toward R · 2008: 6.6pp · 2024: -9.4pp
- All cycles
- 2024: R+9.4 2020: R+6.6 2016: R+2.5 2012: D+4.6 2008: D+6.6
Not yet ingested
- Civics
- —
Market trends
- HPI YoY
- ▼ -114.56%
- Current HPI
- 209.2788
- Rent YoY
- —
- Metro
- —
- State GDP YoY
- ▲ 3.28%
- F500 in state
- 26
Industry mix (Fortune 500 HQ in NC)
| Industry | F500 HQs | Revenue |
|---|---|---|
| Financial Services | 2 | $213B |
|
||
| Retail | 2 | $95B |
|
||
| Industrial Conglomerate | 1 | $38B |
|
||
| Metals / Steel | 1 | $35B |
|
||
| Utilities | 1 | $30B |
|
||
| Industrial Machinery | 1 | $19B |
|
||
Price history
2 events — show timeline
- 2026-05-18 Pending — TMLS
- 2026-05-08 Listed $125,000 TMLS
Property tax history
+106.4%/yrLatest (2025): $1,358 · +870.2% YoY. Source: county tax records.
Cash-flow waterfall
monthlySold comps — $/sqft
last 12 mo · ≤1 miLoading sold comps…