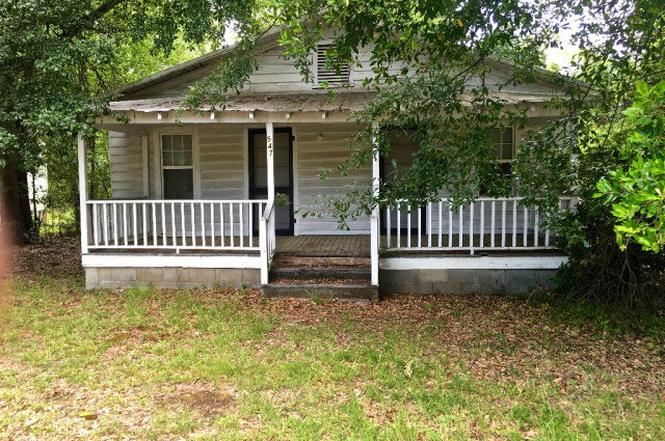
547 Horry St NE · Aiken, SC
Flood risk 6/10 · Moderate
- FEMA flood zone
- X (unshaded)
- Chance of flooding over 30 yrs
- 0.71%
- Est. flood insurance / yr
- $507 – $1,088
Fire risk 3/10 · Minor
- Est. fire insurance / yr
- $783 – $1,453
Heat risk 7/10 · Major
- Hot days now (above 108°F)
- 7 days/yr
- Hot days in 30 yrs
- 17 days/yr
Wind risk 6/10 · Moderate
- Chance of severe wind over 30 yrs
- 67.0%
Air-quality risk 3/10 · Minor
- Unhealthy air days now
- 3 days/yr
- Unhealthy air days in 30 yrs
- 3 days/yr
Risk factors via First Street. Map © Google.
Why this score? — see what drove the C grade
The composite is a weighted blend of 9 inputs, each scored 0–100. Each bar is that input's sub-score; the figure is the points it added to the 100-point composite (weight × sub-score).
- Cash flow +27.2/30.0
- DSCR +9.4/10.0
- 1% rule +6.3/10.0
- ARV discount +4.0/15.0
- Rent growth +3.8/5.0
- Livability +3.4/5.0
- Schools +3.2/10.0
- Condition / age +2.5/5.0
- Appreciation +0.0/10.0
$140,000
🖨 Deal sheet 📄 Offer letter ✓ Due diligence
Listing remarks
Fully Updated 3 Bedroom & 2 Full Bath Home within 4 minutes to Downtown Aiken. New Metal Roof 2025 New HVAC New Electric Water Heater, Range, Dishwasher and Microwave All new sheetrock throughout Tastefully renovated Full Bathrooms with Ceramic Tile Brand New Shaker Style Kitchen Cabinnets with Granite Countertops LVP Flooring New Windows Best priced home in Aiken! Come see it today.
Key facts
- New metal roof
- New hvac
- Granite countertops
Tags
Property features AI
Exterior
- Parking: Driveway
- Security: Smoke detectors
- Utilities: Public water; Public sewer; Electricity available; Natural gas available; Cable available; Phone available; Water available; Sewer available
- Home design: Single-family residence; One story
- Construction: Wood siding; Metal roof; Combination foundation; Built above grade (finished area listed)
- Exterior features: Porch; Corner, level lot; Paved road
Interior
- Kitchen: Dishwasher; Range; Microwave; Electric water heater
- Flooring: Ceramic tile
- Bathrooms: 2 full bathrooms
- Heating & cooling: Natural gas heating; Central air; Ceiling fans
- Interior features: Ceiling fans; Eat-in kitchen; Insulated windows; Electric water heater; Dishwasher; Range; Microwave; Crawl space foundation
- Laundry & utility: Washer hookup; Electric dryer hookup
Neighborhood map
What this means for you Summary
Snapshot
- This is a 3-bed/1.0-bath single-family listed at $140k.
Deal economics
- At list price, monthly cash flow is $400 ($5k/yr) — positive.
- The deal already cash-flows at list — no discount required.
- Meets the 1% rule at list price ($2k rent vs $140k).
- Recommended offer: $136k (3.0% below list) — sets the bar for market timing.
- Cap rate 9.7% vs local median 4.1% in Aiken — top-decile yield for the area; either an underpriced asset or a hidden risk that comps aren't pricing in. Stress-test before assuming the spread holds.
Location & tenants
- Location reads 67/100 on livability (#93 in SC) — a middle-class / working-renter tenant base. Strengths: housing A+, health & safety A+, cost of living A; Watch: crime F, commute F.
- Aiken 01 (suburban): math 31% / reading 44% proficiency, ranked #36 of 80 in SC (top 45%) — families likely to look elsewhere, expect single-tenant / working-renter base with shorter leases.
- Zoned schools: East Aiken School of The Arts (math 40% / reading 43%, grade F, #269 of 597 statewide, top 46%, 539 students, 100% FRL); Schofield Middle (math 18% / reading 30%, grade F, #167 of 229 statewide, top 74%, 401 students, 100% FRL); Aiken High (math 19% / reading 84%, grade D+, #146 of 196 statewide, top 75%, 1,195 students, 100% FRL) — zoned schools average 100% FRL vs 54% district-wide (46 pts higher); higher-poverty schools than district average — tighter screening recommended.
- Market conditions: Rents rising fast (+5.1%/yr); 521 active listings in the ZIP; 10 comparable units currently listed for rent nearby; rentals at typical pace (median 23d on market — plan ~3-4 weeks tenant-placement turnaround); 2,500 units permitted in Aiken County in 2024 (1,023 in 5+ unit buildings).
Forward outlook
- Local home prices are declining (-3.0%/yr); year-one equity from $968 of loan paydown is wiped out by about $4k of value loss. Plan a longer hold.
- Aiken County population projected at +9% by 2050 — modest demand growth; plan on rents tracking national, not racing it.
- At projected returns (-3.0% appreciation + 5.1% rent growth), your $39k cash investment doubles in ~8 years — after that, you're playing with house money.
Negotiation context
- It's been on market 53 days — a 3% lower offer ($136k) is reasonable based on typical stale-listing flexibility.
- 9 sale attempts since 10y ago; this cycle's ask is 9233% above the opening price — seller raised mid-cycle; expect resistance to lowballs.
- Current owner paid $40k; list at $140k implies a 250% gain — meaningful room to come down on a strong offer.
Risks & watch-outs
- Watch-outs: built in 1938 — expect roof / HVAC / electrical / plumbing capex.
- Climate carrying-cost: major flood risk; major wind risk, 67% chance of damaging wind over 30y; extreme-heat days projected 7→17/yr by 2055 (HVAC capex compounding) — expect insurance premiums to compound above CPI over the hold.
Questions for the listing agent
- It's been on market 53 days. Have you received any prior offers? Is the seller open to a 3% concession, seller financing, or rate buy-down credit?
- Built in 1938 — when were the roof, HVAC, electrical panel, plumbing, and water heater last replaced?
- Is there a deadline driving the sale (1031 exchange, divorce, estate, relocation)? That informs how much negotiation room exists.
- Schools are B-rated — typically a magnet for longer-tenancy family renters. What's the average tenant stay here, and is there a school-zone premium baked into asking?
- Crime grade is F in this area — have there been break-ins, vandalism, or insurance claims at this property in the last 3 years? What carrier currently insures it and at what premium?
- What's the average days-on-market for RENTAL listings here right now (not sales)? A rising rental-DOM trend means longer vacancies and softer asking-rent achievability than the comps imply.
- What's the recent tenant-quality profile in this submarket — average credit score on applications, eviction rate, late-payment / NSF rate, and stable-employment percentage? A property-management company in the area should have these aggregated.
- How much new for-sale + rental construction is in the pipeline within 1–3 miles? Heavy new supply typically softens prices + rents 12–24 months out; constrained supply supports both.
Investment metrics
- 1% rule
- 1.13% ✓
- Cap rate
- 9.72%
- Cash-on-cash
- 12.23%
- DSCR
- 1.54
- GRM
- 7.4
CMA / ARV
- ARV (on-the-fly)
- $129,950
- Comps found
- 11
Show comp detail 11 sales within ~0.75 mi
| Address | Dist | Beds/Ba | Sqft | Sold | Price | $/sf | Match |
|---|---|---|---|---|---|---|---|
| 547 Gwinnett St NE | 0.06mi | 3/1.0 | 1,250 (+9%) | 2mo | $100,000 | $80 | 81 |
| 512 NE Hampton Ave | 0.13mi | 3/1.0 | 1,068 (-7%) | 8mo | $55,000 | $51 | 75 |
| 256 NE Williamsburg St | 0.48mi | 2/1.0 (-1) | 1,139 (-1%) | 5mo | $129,000 | $113 | 66 |
| 458 Williamsburg St NE | 0.26mi | 2/2.0 (-1) | 1,200 (+4%) | 17mo | $189,500 | $158 | 58 |
| 149 NW Dupont Dr | 0.73mi | 3/2.0 | 1,194 (+4%) | 4mo | $198,000 | $166 | 52 |
| 886 Teague St NW | 0.67mi | 3/2.0 | 1,102 (-4%) | 9mo | $175,000 | $159 | 50 |
| 449 Union St NE | 0.28mi | 4/1.0 (+1) | 1,306 (+14%) | 19mo | $120,000 | $92 | 43 |
| 413 Union St NE | 0.32mi | 2/2.0 (-1) | 1,302 (+13%) | 16mo | $230,000 | $177 | 41 |
| 102 NE Brentwood Pl | 0.74mi | 3/1.5 | 1,250 (+9%) | 16mo | $100,000 | $80 | 36 |
| 890 Teague St NW | 0.69mi | 3/2.0 | 1,002 (-13%) | 10mo | $170,000 | $170 | 34 |
| 242 Williamsburg St NE | 0.50mi | 3/1.5 | 1,298 (+13%) | 23mo | $125,000 | $96 | 34 |
Match score weights: distance 35% · size 25% · config 20% · recency 20%. Top-matched comps best support the ARV.
Projected returns pro-forma
-3.0% appreciation · 5.06% rent growth · sell at horizon
- IRR
- 3.9%
- Equity multiple
- 1.16×
- Total profit
- $6,077
- Equity at exit
- $20,874
- IRR
- 15.1%
- Equity multiple
- 2.33×
- Total profit
- $52,246
- Equity at exit
- $12,105
Cash invested: $39,200 (down + closing). Projections, not guarantees.
Landlord ↔ Tenant lean methodology
- Overall (STATE)
- 90 Strongly Landlord-Friendly
- State South Carolina
- 90 Strongly Landlord-Friendly · R+6
- County
- — inherits STATE
- City
- — inherits STATE
ZIP-level market 29801
- Rents YoY
- 5.1%
- Active inventory
- 521
- Price-to-rent
- 7.4×
Monthly cashflow live
- Estimated rent
- $1,587 high interval (Pro) →
- Mortgage (P&I)
- −$734
- Tax from tax record
- −$61 /mo · $738/yr
- Insurance
- −$58
- HOA
- −$0
- Vacancy / Maint / Mgmt
- −$333
- Net cashflow
- $400
Break-even live
UW: 25.0% down · 7.5% · 30yr · 1.5% tax · 5.0% vac · 8.0% maint · 8.0% mgmt
Financing live
Cash to close
- Down payment
- $35,000
- Closing costs
- $4,200
- Reserves months
- —
- Total cash needed
- —
Loan-product check · same deal, 3 products live
Conventional
25% down · 7.5% · 30yr
- Down + closing
- —
- Monthly P&I
- —
- Monthly cashflow
- —
- DSCR
- —
- Eligible?
- —
Personal DTI + credit; lowest rate.
DSCR
20% down · 8.5% · 30yr
- Down + closing
- —
- Monthly P&I
- —
- Monthly cashflow
- —
- DSCR
- —
- Eligible?
- —
No personal income docs; deal must DSCR.
Hard money
10% down · 12.0% · 12mo
- Down + closing
- —
- Monthly P&I
- —
- Monthly cashflow
- —
- DSCR
- —
- Eligible?
- —
Short-term bridge; refi at stabilization.
Rent comps 10 comps
| Address | Beds | Baths | Sqft | Rent | $/sqft | DOM | Units | Dist |
|---|---|---|---|---|---|---|---|---|
| 816 York St Aiken, SC | 2.0 | 1.0 | 1308 | $1,450 | $1.11 | 21d | 1 | 0.34mi |
| 328 Williamsburg St Aiken, SC | 2.0 | 1.0 | 1043 | $1,050 | $1.01 | 13d | 1 | 0.38mi |
| 206 Sumter St SE Aiken, SC | 2.0 | 2.0 | 1118 | $2,200 | $1.97 | 23d | 1 | 0.85mi |
| 126 Park Ave SE Unit C Aiken, SC | 2.0 | 2.0 | 1224 | $1,900 | $1.55 | 13d | 1 | 0.90mi |
| 524 Colleton Ave SE Aiken, SC | 2.0 | 2.0 | 1411 | $1,695 | $1.20 | 13d | 1 | 0.95mi |
| 1223 York St NE Aiken, SC | 2.0 | 1.0 | 794 | $1,000 | $1.26 | 23d | 1 | 0.95mi |
| 811 Laurens St NW Aiken, SC | 3.0 | 1.5 | 986 | $1,379 | $1.40 | 23d | 1 | 1.05mi |
| 630 Morgan St NW Unit A Aiken, SC | 3.0 | 1.0 | 950 | $1,100 | $1.16 | 23d | 1 | 1.17mi |
| 337 E Boundary Ave SE Aiken, SC | 2.0 | 1.0 | 1185 | $1,750 | $1.48 | 21d | 1 | 1.24mi |
| 461 E Boundary Ave SE Aiken, SC | 2.0 | 2.0 | 1500 | $2,100 | $1.40 | 23d | 1 | 1.44mi |
Listing history 19 events
-
2026-05-11historical
-
2026-05-08status Active
-
2026-05-08price $140,000
-
2026-04-16$1,500
-
2025-08-02historical
-
2025-07-07status Active
-
2025-07-01historical
-
2025-07-01historical
-
2025-07-01status Pending
-
2025-06-30historical Active Under Contract
-
2025-06-22$150,000 Active
-
2025-06-20$165,000
-
2025-06-20$165,000
-
2025-02-18soldstatus $40,000
-
2022-05-27historical
-
2022-05-04$65,000
-
2022-05-04$65,000
-
2016-10-27soldstatus $16,500
-
2016-06-27$24,500
ⓘ Source: listings_history table (triggers on properties + properties_extension) + one-shot
backfill from property_details.listing_events for pre-trigger history.
Tax reassessment forecast SC · Resets to sale price
- Current annual tax
- $738 · $61/mo
- Projected year-2 tax
- $798 · $66/mo
- Expected delta
- +$60/yr (+$5/mo · 8.2%)
ⓘ Screening estimate from a state-policy table — verify with the county assessor before closing.
Climate risk First Street
- Flood 6/10 Major FEMA zone X (unshaded) · 71% chance over 30 yrs
- Wildfire 3/10 Moderate
- Heat 7/10 Severe 7 d/yr ≥108°F today · 17 d/yr by 30 yrs out
- Wind 6/10 Major 67% chance of damaging wind over 30 yrs
- Air quality 3/10 Moderate 3 unhealthy d/yr today · 3 by 30 yrs out
Nearby sold comps map
Loading sold comps map…
Walkable amenities ~0.75 mi
Loading nearby amenities…
Taxation est. · year 1
- Rental income
- $19,042
- − Mortgage interest
- −$7,842
- − Property taxes
- −$738
- − Insurance
- −$700
- − Repairs & maintenance
- −$1,523
- − Management
- −$1,523
- − Depreciation
- −$4,073
- Taxable income
- $2,643
- Est. tax owed @ 24.0%
- −$634
- After-tax cash flow
- $4,161/yr
For passive investors: Depreciation is non-cash, so a rental often shows a tax loss while cash-flowing — sheltering income. Rental losses are passive: they offset passive income freely, and up to $25,000/yr can offset ordinary (W-2) income if you actively participate and your MAGI is under $100k (phasing out to $0 by $150k); unused losses carry forward. On sale, claimed depreciation is recaptured at up to 25%, and gains may owe capital-gains tax (a 1031 exchange can defer both). Figures are a year-1 estimate at your 24.0% rate — not tax advice; consult a CPA.
Schools (NCES district)
- District
- Aiken 01
- NCES district ID
- 4500720
- Math proficiency
- 31% ▼ -11.00%
- Reading proficiency
- 44% ▼ -1.00%
- Median HH income
- $45,081
- Composite
- 31.91/100
- National rank
- #5857
- State rank
- #36 of 80 in SC
Livability — Aiken
- Score
- 67/100
- State rank
- #93
- US rank
- #10443
Category grades
Schools grade is shown separately in the Schools card above.
Census & demographics
- Census place
- Aiken, SC
- County
- Aiken County · 116,534 people
- City population
- 71,807
- Metro
- Augusta-Richmond County, GA-SC
- Population (ZIP)
- 31,108
- Household income
- $59,573
- Rent vs Own
- Severe rent burden
- 1260.0
Population outlook (Aiken County) Hauer SSP2
- Today (2025)
- 178,003 people
- By 2030
- 182,876 · +2.7%
- By 2040
- 189,970 · +6.7%
- By 2050
- 193,840 · +8.9%
- By 2075
- 199,453 · +12.1%
- By 2100
- 192,403 · +8.1%
Race, ethnicity, and origin ACS 2023
- Neighborhood character
- Diverse neighborhood (Simpson 0.57)
- Race & ethnicity
- White 50% Black 42% Hispanic / Latino 5% Two or more races 4% Asian 1%
- Hispanic origin (detail)
- Mexican 1% Puerto Rican 2%
- Common ancestry
- Slovak 2% Italian 1% Serbian 1%
- Foreign-born
- 3% · Canada, Jamaica
- Languages at home
- 95% English-only · Spanish 3% Other Indo-European 1%
Political lean MEDSL · Aiken
- 2024 margin
- Strong R (+25.9) · D 36.4% · R 62.2% · Other 1.4%
- 2008→2024 swing
- -1.9pp toward R · 2008: -24.0pp · 2024: -25.9pp
- All cycles
- 2024: R+25.9 2020: R+22.7 2016: R+27.5 2012: R+26.0 2008: R+24.0
Not yet ingested
- Civics
- —
Market trends
- HPI YoY
- ▼ -278.52%
- Current HPI
- 173.7944
- Rent YoY
- ▲ 5.06%
- Metro
- Augusta-Richmond County, GA-SC
- State GDP YoY
- ▲ 4.51%
- F500 in state
- 2
Industry mix (Fortune 500 HQ in SC)
| Industry | F500 HQs | Revenue |
|---|---|---|
| Packaging | 1 | $7B |
|
||
Price history
+471.4% since first listed19 events — show timeline
- 2026-05-11 Listing Removed — Hive MLS
- 2026-05-08 Relisted — AMLS
- 2026-05-08 Price Changed $140,000 AMLS
- 2026-04-16 Listed for Rent $1,500 AMLS
- 2025-08-02 Delisted — AMLS
- 2025-07-07 Relisted — AMLS
- 2025-07-01 Listing Removed — Hive MLS
- 2025-07-01 Listing Removed — Hive MLS
- 2025-07-01 Pending — AMLS
- 2025-06-30 Contingent — AMLS
- 2025-06-22 Listed $150,000 AMLS
- 2025-06-20 Listed $165,000 Hive MLS
- 2025-06-20 Listed $165,000 Hive MLS
- 2025-02-18 Sold (Public Records) $40,000 Public Records
- 2022-05-27 Listing Removed — Hive MLS
- 2022-05-04 Listed $65,000 Hive MLS
- 2022-05-04 Listed $65,000 Hive MLS
- 2016-10-27 Sold (MLS) $16,500 AMLS
- 2016-06-27 Listed $24,500 AMLS
Property tax history
+5.9%/yrLatest (2025): $738 · +8.5% YoY. Source: county tax records.
Cash-flow waterfall
monthlySold comps — $/sqft
last 12 mo · ≤1 miLoading sold comps…