49 Fritz Rd #49 · Smyrna, DE
Flood risk 1/10 · Minimal
- FEMA flood zone
- X (unshaded)
- Chance of flooding over 30 yrs
- 0.0%
- Est. flood insurance / yr
- $473 – $860
Fire risk 1/10 · Minimal
- Est. fire insurance / yr
- $476 – $884
Heat risk 8/10 · Major
- Hot days now (above 103°F)
- 7 days/yr
- Hot days in 30 yrs
- 16 days/yr
Wind risk 6/10 · Moderate
- Chance of severe wind over 30 yrs
- 75.0%
Air-quality risk 2/10 · Minimal
- Unhealthy air days now
- 1 days/yr
- Unhealthy air days in 30 yrs
- 1 days/yr
Risk factors via First Street. Map © Google.
Why this score? — see what drove the B- grade
The composite is a weighted blend of 9 inputs, each scored 0–100. Each bar is that input's sub-score; the figure is the points it added to the 100-point composite (weight × sub-score).
- Cash flow +30.0/30.0
- 1% rule +10.0/10.0
- DSCR +10.0/10.0
- ARV discount +7.5/15.0
- Condition / age +3.8/5.0
- Livability +3.5/5.0
- Schools +2.8/10.0
- Rent growth +2.5/5.0
- Appreciation +0.0/10.0
$85,000
🖨 Deal sheet 📄 Offer letter ✓ Due diligence
Listing remarks
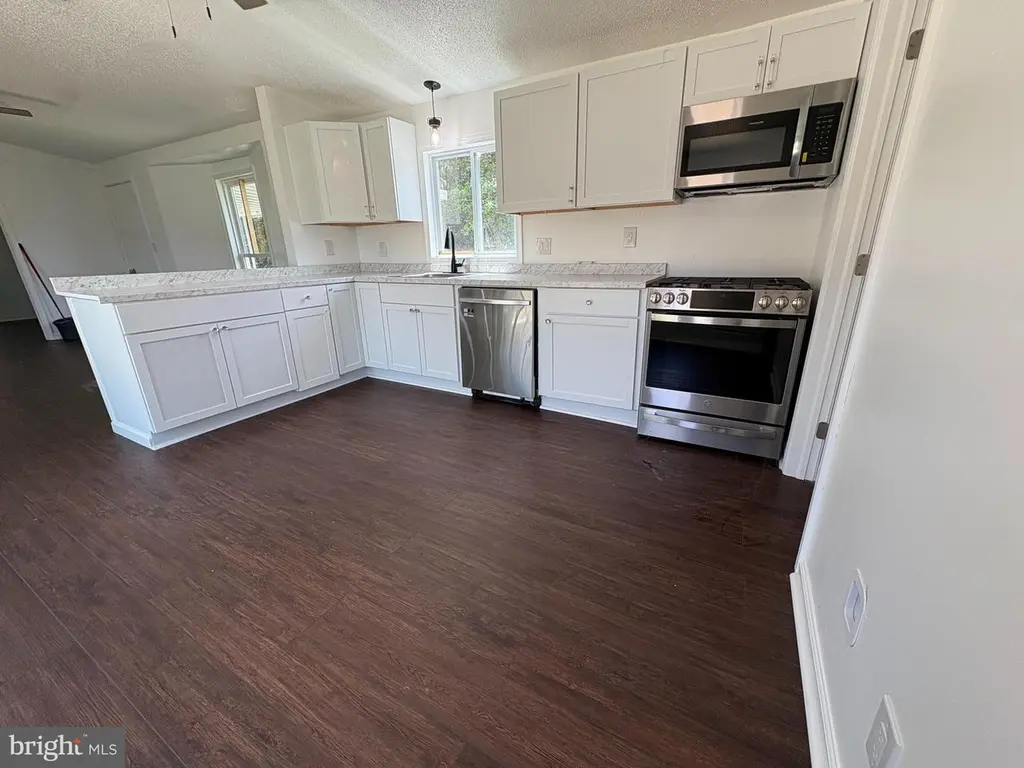
Welcome home to 49 Fritz Rd. in Smyrna — a beautifully FULLY FURNISHED and renovated 2-bedroom, 2 full bathroom manufactured home offering comfort, style, and affordability all in one! Perfectly timed for the Summer Market, this move-in-ready home has been thoughtfully updated from top to bottom and is being sold FULLY FURNISHED, making it a true turnkey opportunity. Step inside to discover brand-new vinyl plank flooring flowing throughout the home, creating a fresh and modern feel in every room. The inviting layout offers spacious living areas ideal for both relaxing and entertaining. The updated kitchen features new appliances, while both bathrooms have been refreshed with contempor
Key facts
- 2 parking spots
- Built 1988
- Listed 10 days
Property features AI
Finance
- Financial info: Annual ground rent listed as income/expense item
- HOA & community: Land lease payment: $640 monthly; Ground rent payment: annually
Exterior
- Parking: Driveway parking; 2 driveway spaces (2 total garage/parking spaces)
- Utilities: Public water; Public sewer; Natural gas available
- Home design: Manufactured home; Single wide (14 ft x 72 ft); Effective remodel year 2026; Ownership: Land lease
- Construction: Vinyl siding; Above grade and below grade structures
- Exterior features: Deck(s); 2+ access exits; Ground rent exists (paid annually)
Interior
- Kitchen: Dishwasher; Microwave; Gas range / oven; Stainless steel appliances; Refrigerator; Water heater
- Bedrooms: 2 bedrooms on the main level
- Flooring: Luxury vinyl plank
- Bathrooms: 2 full bathrooms (both on the main level)
- Heating & cooling: Forced air heating (electric); Ductless / mini-split cooling; Electric hot water
- Interior features: Tub/shower; Ceiling fan(s); Combination dining and living area; Sliding glass door(s); Drywall walls and ceilings; Furnished
- Laundry & utility: Stacked washer/dryer
Neighborhood map
What this means for you Summary
Snapshot
- This is a 2-bed/2.0-bath single-family listed at $85k. Condition is rated good.
Deal economics
- At list price, monthly cash flow is $687 ($8k/yr) — positive.
- The deal already cash-flows at list — no discount required.
- Meets the 1% rule at list price ($2k rent vs $85k).
- Cap rate 16.0% vs local median 3.5% in Smyrna — top-decile yield for the area; either an underpriced asset or a hidden risk that comps aren't pricing in. Stress-test before assuming the spread holds.
Location & tenants
- Location reads 69/100 on livability (#29 in DE) — a middle-class / working-renter tenant base. Strengths: cost of living A+, housing A+, health & safety A+; Watch: crime D-, amenities F, commute F.
- Smyrna School District (rural): math 22% / reading 39% proficiency, ranked #16 of 26 in DE (top 62%) — families likely to look elsewhere, expect single-tenant / working-renter base with shorter leases.
- Market conditions: 220 active listings in the ZIP; 1,201 units permitted in Kent County in 2024 (116 in 5+ unit buildings).
Forward outlook
- Local home prices are declining (-3.0%/yr); year-one equity from $588 of loan paydown is wiped out by about $3k of value loss. Plan a longer hold.
- Kent County population projected at +22% by 2050 — long-run rental-demand tailwind backs the buy-and-hold thesis.
- At projected returns (-3.0% appreciation + 3.0% rent growth), your $24k cash investment doubles in ~4 years — after that, you're playing with house money.
Negotiation context
- Only 11 days on market — expect competitive offers; lowballing is unlikely to land.
Risks & watch-outs
- Climate carrying-cost: major wind risk, 75% chance of damaging wind over 30y; extreme-heat days projected 7→16/yr by 2055 (HVAC capex compounding) — expect insurance premiums to compound above CPI over the hold.
Questions for the listing agent
- Is there a deadline driving the sale (1031 exchange, divorce, estate, relocation)? That informs how much negotiation room exists.
- Crime grade is D in this area — have there been break-ins, vandalism, or insurance claims at this property in the last 3 years? What carrier currently insures it and at what premium?
- What's the average days-on-market for RENTAL listings here right now (not sales)? A rising rental-DOM trend means longer vacancies and softer asking-rent achievability than the comps imply.
- What's the recent tenant-quality profile in this submarket — average credit score on applications, eviction rate, late-payment / NSF rate, and stable-employment percentage? A property-management company in the area should have these aggregated.
- How much new for-sale + rental construction is in the pipeline within 1–3 miles? Heavy new supply typically softens prices + rents 12–24 months out; constrained supply supports both.
Investment metrics
- 1% rule
- 1.90% ✓
- Cap rate
- 15.99%
- Cash-on-cash
- 34.62%
- DSCR
- 2.54
- GRM
- 4.4
CMA / ARV
- ARV (on-the-fly)
- $51,744
- Comps found
- 9
Show comp detail 9 sales within ~0.75 mi
| Address | Dist | Beds/Ba | Sqft | Sold | Price | $/sf | Match |
|---|---|---|---|---|---|---|---|
| 222 Laurel Ln #222 | 0.21mi | 2/2.0 | 924 (0%) | 10mo | $52,000 | $56 | 82 |
| 24 Spruce Ct #24 | 0.15mi | 3/2.0 (+1) | 980 (+6%) | 1mo | $62,900 | $64 | 77 |
| 227 Laurel Ln #227 | 0.24mi | 2/1.0 | 924 (0%) | 10mo | $41,500 | $45 | 77 |
| 93 Ivy Ridge Ct #93 | 0.32mi | 2/2.0 | 924 (0%) | 12mo | $49,900 | $54 | 74 |
| 184 Hemlock Way | 0.35mi | 2/2.0 | 924 (0%) | 14mo | $62,000 | $67 | 72 |
| 158 Hemlock Way #158 | 0.38mi | 3/2.0 (+1) | 924 (0%) | 14mo | $68,600 | $74 | 66 |
| 122 Ivy Ridge Ct #122 | 0.36mi | 2/2.0 | 980 (+6%) | 17mo | $65,000 | $66 | 59 |
| 223 Laurel Ln #223 | 0.21mi | 3/1.5 (+1) | 1,056 (+14%) | 12mo | $22,500 | $21 | 49 |
| 68 Juniper Ct #68 | 0.27mi | 3/2.0 (+1) | 1,056 (+14%) | 16mo | $37,000 | $35 | 45 |
Match score weights: distance 35% · size 25% · config 20% · recency 20%. Top-matched comps best support the ARV.
Projected returns pro-forma
-3.0% appreciation · 3.0% rent growth · sell at horizon
- IRR
- 30.1%
- Equity multiple
- 2.26×
- Total profit
- $29,984
- Equity at exit
- $12,674
- IRR
- 37.4%
- Equity multiple
- 4.47×
- Total profit
- $82,521
- Equity at exit
- $7,349
Cash invested: $23,800 (down + closing). Projections, not guarantees.
Landlord ↔ Tenant lean methodology
- Overall (STATE)
- 70 Landlord-Friendly
- State Delaware
- 70 Landlord-Friendly · D+7
- County
- — inherits STATE
- City
- — inherits STATE
ZIP-level market 19977
- Home prices YoY
- -29.1%
- Active inventory
- 220
- Price-to-rent
- 4.4×
Monthly cashflow live
- Estimated rent
- $1,613 medium interval (Pro) →
- Mortgage (P&I)
- −$446
- Tax est. 1.5%
- −$106 /mo · $1,275/yr
- Insurance
- −$35
- HOA
- −$0
- Vacancy / Maint / Mgmt
- −$339
- Net cashflow
- $687
Break-even live
UW: 25.0% down · 7.5% · 30yr · 1.5% tax · 5.0% vac · 8.0% maint · 8.0% mgmt
Financing live
Cash to close
- Down payment
- $21,250
- Closing costs
- $2,550
- Reserves months
- —
- Total cash needed
- —
Loan-product check · same deal, 3 products live
Conventional
25% down · 7.5% · 30yr
- Down + closing
- —
- Monthly P&I
- —
- Monthly cashflow
- —
- DSCR
- —
- Eligible?
- —
Personal DTI + credit; lowest rate.
DSCR
20% down · 8.5% · 30yr
- Down + closing
- —
- Monthly P&I
- —
- Monthly cashflow
- —
- DSCR
- —
- Eligible?
- —
No personal income docs; deal must DSCR.
Hard money
10% down · 12.0% · 12mo
- Down + closing
- —
- Monthly P&I
- —
- Monthly cashflow
- —
- DSCR
- —
- Eligible?
- —
Short-term bridge; refi at stabilization.
Listing history 15 events
-
2026-06-19days on market $85,000 Active 11 DOM
-
2026-06-18days on market $85,000 Active 10 DOM
-
2026-06-17days on market $85,000 Active 9 DOM
-
2026-06-16days on market $85,000 Active 8 DOM
-
2026-06-15days on market $85,000 Active 7 DOM
-
2026-06-14days on market $85,000 Active 5 DOM
-
2026-06-13days on market $85,000 Active 4 DOM
-
2026-06-10days on market $85,000 Active 2 DOM
-
2026-06-09statusdays on market $85,000 Active 1 DOM
-
2026-06-08days on market $85,000 Coming Soon 8 DOM
-
2026-06-07days on market $85,000 Coming Soon 7 DOM
-
2026-06-05days on market $85,000 Coming Soon 4 DOM
-
2026-06-02days on market $85,000 Coming Soon 2 DOM
-
2026-05-31remarks 693-char remark
-
2026-05-31$85,000 Coming Soon 1 DOM
ⓘ Source: listings_history table (triggers on properties + properties_extension) + one-shot
backfill from property_details.listing_events for pre-trigger history.
Climate risk First Street
- Flood 1/10 Low FEMA zone X (unshaded) · 0% chance over 30 yrs
- Wildfire 1/10 Low
- Heat 8/10 Severe 7 d/yr ≥103°F today · 16 d/yr by 30 yrs out
- Wind 6/10 Major 75% chance of damaging wind over 30 yrs
- Air quality 2/10 Low 1 unhealthy d/yr today · 1 by 30 yrs out
Nearby sold comps map
Loading sold comps map…
Walkable amenities ~0.75 mi
Loading nearby amenities…
Taxation est. · year 1
- Rental income
- $19,353
- − Mortgage interest
- −$4,761
- − Property taxes
- −$1,275
- − Insurance
- −$425
- − Repairs & maintenance
- −$1,548
- − Management
- −$1,548
- − Depreciation
- −$2,473
- Taxable income
- $7,322
- Est. tax owed @ 24.0%
- −$1,757
- After-tax cash flow
- $6,482/yr
For passive investors: Depreciation is non-cash, so a rental often shows a tax loss while cash-flowing — sheltering income. Rental losses are passive: they offset passive income freely, and up to $25,000/yr can offset ordinary (W-2) income if you actively participate and your MAGI is under $100k (phasing out to $0 by $150k); unused losses carry forward. On sale, claimed depreciation is recaptured at up to 25%, and gains may owe capital-gains tax (a 1031 exchange can defer both). Figures are a year-1 estimate at your 24.0% rate — not tax advice; consult a CPA.
Condition & rehab AI · 2 photos
This fully renovated 2-bedroom, 2-bathroom manufactured home is move-in ready with new flooring, appliances, and paint. It offers a good condition score and is a great opportunity for investors looking to capitalize on the Summer market.
Value-add opportunities
- Both Painting exterior siding — Enhances curb appeal and value.
- Both Landscaping improvements — Enhances curb appeal and value.
- Both Add a small front porch — Improves curb appeal and provides a welcoming entrance.
Renovation cost estimate screening
Value-add ROI direction
- Both Painting exterior siding — Enhances curb appeal and value. ↑
- Both Landscaping improvements — Enhances curb appeal and value. ↑
- Both Add a small front porch — Improves curb appeal and provides a welcoming entrance. ↑
ⓘ Cost ranges are severity-bucket heuristics (US national rule-of-thumb). Get contractor quotes + a written scope before underwriting a rehab budget.
Schools (NCES district)
- District
- Smyrna School District
- NCES district ID
- 1001620
- Math proficiency
- 22% ▼ -25.00%
- Reading proficiency
- 39% ▼ -17.00%
- Median HH income
- $61,704
- Composite
- 27.67/100
- National rank
- #6915
- State rank
- #16 of 26 in DE
Livability — Smyrna
- Score
- 69/100
- State rank
- #29
- US rank
- #8702
Category grades
Schools grade is shown separately in the Schools card above.
Census & demographics
- Population (ZIP)
- 27,164
Population outlook (Kent County) Hauer SSP2
- Today (2025)
- 194,477 people
- By 2030
- 204,351 · +5.1%
- By 2040
- 222,135 · +14.2%
- By 2050
- 236,483 · +21.6%
- By 2075
- 266,327 · +36.9%
- By 2100
- 275,335 · +41.6%
Race, ethnicity, and origin ACS 2023
- Neighborhood character
- Diverse neighborhood (Simpson 0.59)
- Race & ethnicity
- White 56% Black 29% Two or more races 9% Hispanic / Latino 8% Asian 2%
- Hispanic origin (detail)
- Mexican 1% Puerto Rican 5% Dominican 1%
- Common ancestry
- Romanian 5% Hispanic 1% Iranian 1%
- Foreign-born
- 7% · Canada
- Languages at home
- 89% English-only · Spanish 4% French/Haitian/Cajun 2% Other Asian/Pacific 2%
Political lean MEDSL · Kent
- 2024 margin
- Toss-up / Even · D 50.2% · R 48.2% · Other 1.7%
- 2008→2024 swing
- -7.8pp toward R · 2008: 9.8pp · 2024: 2.0pp
- All cycles
- 2024: D+2.0 2020: D+4.1 2016: R+4.9 2012: D+4.9 2008: D+9.8
Not yet ingested
- Civics
- —
Market trends
- HPI YoY
- ▼ -110.14%
- Current HPI
- 267.998
- Rent YoY
- —
- Metro
- —
- State GDP YoY
- —
- F500 in state
- 0
Price history
1 event — show timeline
- 2026-05-31 Coming Soon $85,000 BRIGHT MLS
Cash-flow waterfall
monthlySold comps — $/sqft
last 12 mo · ≤1 miLoading sold comps…