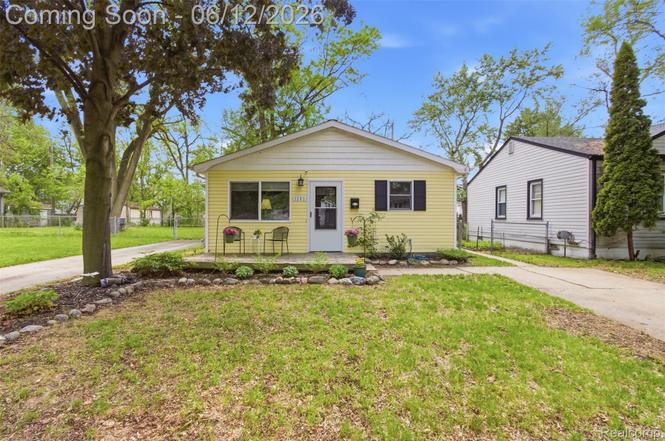
1202 E Elza Ave · Hazel Park, MI
Flood risk 1/10 · Minimal
- FEMA flood zone
- X (unshaded)
- Chance of flooding over 30 yrs
- 0.0%
- Est. flood insurance / yr
- $473 – $860
Fire risk 1/10 · Minimal
- Est. fire insurance / yr
- $784 – $1,456
Heat risk 3/10 · Minor
- Hot days now (above 97°F)
- 7 days/yr
- Hot days in 30 yrs
- 15 days/yr
Wind risk 2/10 · Minimal
- Chance of severe wind over 30 yrs
- —
Air-quality risk 3/10 · Minor
- Unhealthy air days now
- 3 days/yr
- Unhealthy air days in 30 yrs
- 5 days/yr
Risk factors via First Street. Map © Google.
Why this score? — see what drove the D- grade
The composite is a weighted blend of 9 inputs, each scored 0–100. Each bar is that input's sub-score; the figure is the points it added to the 100-point composite (weight × sub-score).
- Cash flow +13.5/30.0
- ARV discount +4.7/15.0
- 1% rule +4.5/10.0
- DSCR +4.1/10.0
- Livability +4.0/5.0
- Rent growth +3.2/5.0
- Condition / age +2.5/5.0
- Schools +1.4/10.0
- Appreciation +0.0/10.0
$165,000
🖨 Deal sheet 📄 Offer letter ✓ Due diligence
Listing remarks MLS
Remarkable ranch just hit the market in Hazel Park! This warm & inviting home features 3 beds, 1 full bath, & 1,021 sq ft of living space. The eat-in kitchen features beautiful butcher block countertops, modern hardware, plenty of storage, & SS appliances. Spacious full bathroom detailed with with modern vanity, hardware, light fixtures, & newer toilet. Fresh paint throughout the home and new LVP flooring to lighten & modernize the space. 3 spacious bedrooms with carpet & fresh paint. Laundry/utility room perfect for extra storage. Newer washer (2025). Enjoy your backyard with a quaint gardening area, shed, & is fully fenced. You won't want to miss this - schedule your showing today!
Key facts
- Modern hardware
- Plenty of storage
- Light fixtures
Tags
Property features AI
Finance
- Other: Lot approximately 0.1 acre (40 x 108); Directions: 75 north to 8 Mile exit, take service drive to Elza, turn right; the house is on the right
Exterior
- Parking: No garage
- Utilities: Public water; Public sewer; Paved road access
- Home design: Single‑family residence; One level; Ground-level entry with steps
- Construction: Vinyl siding; Asphalt roof; Slab foundation; Built as a residential single-family home
- Exterior features: Porch; Fenced backyard; Shed
Interior
- Kitchen: Dishwasher; Free‑standing gas oven; Free‑standing gas range; Free‑standing refrigerator; Microwave
- Bathrooms: 1 full bathroom
- Heating & cooling: Forced air heating (natural gas); Central air conditioning
- Interior features: Gas water heater; Disposal; Microwave
- Laundry & utility: Washer; Dryer
Neighborhood map
What this means for you Summary
Snapshot
- This is a 3-bed/1.0-bath single-family listed at $165k.
Deal economics
- At list price, monthly cash flow is $7 ($84/yr) — positive.
- The deal already cash-flows at list — no discount required.
- To meet the 1% rule (rent ≥ 1% of price), the offer needs to be $157k (4.8% below list).
- Recommended offer: $157k (4.8% below list) — sets the bar for 1% rule.
Location & tenants
- Location reads 81/100 on livability (#65 in MI, #1,385 nationally) — a professional / high-income tenant draw. Strengths: commute A+, cost of living A+, housing A+; Watch: employment D+, schools D.
- Hazel Park School District (suburban): math 10% / reading 24% proficiency, ranked #490 of 540 in MI (top 91%) — low school quality limits family demand, transient renter base, plan for 1-2y turnover; 70% free/reduced lunch — lower-income household profile, screen leases tightly.
- Market conditions: Rents rising (+2.9%/yr); 135 active listings in the ZIP; 35 comparable units currently listed for rent nearby; rentals at typical pace (median 22d on market — plan ~3-4 weeks tenant-placement turnaround); 2,614 units permitted in Oakland County in 2024 (721 in 5+ unit buildings).
Forward outlook
- Local home prices are declining (-3.0%/yr); year-one equity from $1k of loan paydown is wiped out by about $5k of value loss. Plan a longer hold.
- Oakland County population projected at +10% by 2050 — modest demand growth; plan on rents tracking national, not racing it.
Negotiation context
- Only 7 days on market — expect competitive offers; lowballing is unlikely to land.
- 4 sale attempts since 3y ago with the ask held roughly flat each time — persistent listings suggest the price (not the market) is what's stuck; bring a comps-based counter.
- Current owner paid $140k; 18% above their basis — modest negotiation headroom, anchor on the comps not their cost.
Questions for the listing agent
- Built in 1977 — when were the roof, HVAC, electrical panel, plumbing, and water heater last replaced?
- Is there a deadline driving the sale (1031 exchange, divorce, estate, relocation)? That informs how much negotiation room exists.
- Schools are D-rated, which usually means shorter tenancies and higher turnover. Who's the typical renter profile here, and what's been the actual vacancy rate?
- The area grade is low — what's the realistic commute time and amenity access for the typical tenant pool here? Any planned neighborhood developments (good or bad) we should know about?
- What's the average days-on-market for RENTAL listings here right now (not sales)? A rising rental-DOM trend means longer vacancies and softer asking-rent achievability than the comps imply.
- What's the recent tenant-quality profile in this submarket — average credit score on applications, eviction rate, late-payment / NSF rate, and stable-employment percentage? A property-management company in the area should have these aggregated.
- How much new for-sale + rental construction is in the pipeline within 1–3 miles? Heavy new supply typically softens prices + rents 12–24 months out; constrained supply supports both.
Investment metrics
- 1% rule
- 0.95% ✗
- Cap rate
- 6.34%
- Cash-on-cash
- 0.18%
- DSCR
- 1.01
- GRM
- 8.8
CMA / ARV
- ARV (on-the-fly)
- $155,192
- Comps found
- 12
Show comp detail 12 sales within ~0.75 mi
| Address | Dist | Beds/Ba | Sqft | Sold | Price | $/sf | Match |
|---|---|---|---|---|---|---|---|
| 1218 E Milton Ave | 0.11mi | 3/1.0 | 1,021 (0%) | 1mo | $155,000 | $152 | 94 |
| 1107 E Muir Ave | 0.24mi | 3/1.0 | 1,081 (+6%) | 1mo | $147,900 | $137 | 78 |
| 720 E Robert Ave | 0.54mi | 3/1.0 | 1,056 (+3%) | 2mo | $150,000 | $142 | 68 |
| 21330 Caledonia Ave | 0.27mi | 3/1.5 | 898 (-12%) | 1mo | $175,000 | $195 | 64 |
| 1727 E Elza Ave | 0.33mi | 3/2.0 | 1,123 (+10%) | 1mo | $185,000 | $165 | 63 |
| 1032 E Maxlow Ave | 0.10mi | 2/1.5 (-1) | 867 (-15%) | 1mo | $185,000 | $213 | 63 |
| 20747 Caledonia Ave | 0.38mi | 3/1.0 | 909 (-11%) | 2mo | $144,900 | $159 | 62 |
| 20401 Greeley St | 0.49mi | 3/1.0 | 928 (-9%) | 1mo | $55,000 | $59 | 61 |
| 1644 E Goulson Ave | 0.65mi | 3/1.0 | 952 (-7%) | 0mo | $139,950 | $147 | 58 |
| 23036 Couzens Ave | 0.74mi | 3/1.0 | 973 (-5%) | 1mo | $215,000 | $221 | 57 |
| 2184 Garrick Ave | 0.71mi | 3/1.0 | 960 (-6%) | 1mo | $95,100 | $99 | 56 |
| 145 W Bernhard Ave | 0.70mi | 2/1.0 (-1) | 968 (-5%) | 2mo | $60,000 | $62 | 52 |
Match score weights: distance 35% · size 25% · config 20% · recency 20%. Top-matched comps best support the ARV.
Projected returns pro-forma
-3.0% appreciation · 2.9% rent growth · sell at horizon
- IRR
- -16.1%
- Equity multiple
- 0.43×
- Total profit
- $-26,366
- Equity at exit
- $24,602
- IRR
- -7.8%
- Equity multiple
- 0.51×
- Total profit
- $-22,700
- Equity at exit
- $14,266
Cash invested: $46,200 (down + closing). Projections, not guarantees.
Landlord ↔ Tenant lean methodology
- Overall (STATE)
- 62 Landlord-Friendly
- State Michigan
- 62 Landlord-Friendly · EVEN
- County
- — inherits STATE
- City
- — inherits STATE
ZIP-level market 48030
- Rents YoY
- 2.9%
- Active inventory
- 135
- Price-to-rent
- 8.8×
Monthly cashflow live
- Estimated rent
- $1,571 high interval (Pro) →
- Mortgage (P&I)
- −$865
- Tax from tax record
- −$300 /mo · $3,600/yr
- Insurance
- −$69
- HOA
- −$0
- Vacancy / Maint / Mgmt
- −$330
- Net cashflow
- $7
Break-even live
UW: 25.0% down · 7.5% · 30yr · 1.5% tax · 5.0% vac · 8.0% maint · 8.0% mgmt
Financing live
Cash to close
- Down payment
- $41,250
- Closing costs
- $4,950
- Reserves months
- —
- Total cash needed
- —
Loan-product check · same deal, 3 products live
Conventional
25% down · 7.5% · 30yr
- Down + closing
- —
- Monthly P&I
- —
- Monthly cashflow
- —
- DSCR
- —
- Eligible?
- —
Personal DTI + credit; lowest rate.
DSCR
20% down · 8.5% · 30yr
- Down + closing
- —
- Monthly P&I
- —
- Monthly cashflow
- —
- DSCR
- —
- Eligible?
- —
No personal income docs; deal must DSCR.
Hard money
10% down · 12.0% · 12mo
- Down + closing
- —
- Monthly P&I
- —
- Monthly cashflow
- —
- DSCR
- —
- Eligible?
- —
Short-term bridge; refi at stabilization.
Rent comps 35 comps
| Address | Beds | Baths | Sqft | Rent | $/sqft | DOM | Units | Dist |
|---|---|---|---|---|---|---|---|---|
| 1211 E Bernhard Ave Hazel Park, MI | 2.0 | 1.0 | 721 | $1,500 | $2.08 | 24d | 1 | 0.06mi |
| 1326 E Evelyn Ave Unit 1032332P Hazel Park, MI | 3.0 | 2.0 | 1097 | $6,448 | $5.88 | 1d | 1 | 0.09mi |
| 1019 E Hayes Ave Unit 1032331P Hazel Park, MI | 3.0 | 1.0 | 1033 | $5,301 | $5.13 | 1d | 1 | 0.18mi |
| 1301 E Muir Ave Hazel Park, MI | 3.0 | 2.0 | 1236 | $1,600 | $1.29 | 21d | 1 | 0.27mi |
| 1621 E Evelyn Ave Hazel Park, MI | 2.0 | 1.0 | 749 | $1,295 | $1.73 | 17d | 1 | 0.27mi |
| 407 E Hayes Ave Hazel Park, MI | 3.0 | 1.0 | 1000 | $1,750 | $1.75 | 24d | 1 | 0.48mi |
| 21516 Dequindre Rd Warren, MI | 1.0–2.0 | 1.0 | 837 | $1,375 | $1.64 | 21d | 1 | 0.50mi |
| 1731 E Pearl Ave Hazel Park, MI | 3.0 | 1.0 | 844 | $1,500 | $1.78 | 20d | 1 | 0.52mi |
| 2034 John B Ave Warren, MI | 3.0 | 1.0 | 920 | $1,261 | $1.37 | 43d | 1 | 0.57mi |
| 90 W Meyers Ave Hazel Park, MI | 2.0 | 1.0 | 831 | $1,800 | $2.17 | 24d | 1 | 0.70mi |
| 155 W George Ave Hazel Park, MI | 2.0 | 1.0 | 725 | $1,000 | $1.38 | 24d | 1 | 0.76mi |
| 21155 Warner Ave Warren, MI | 2.0 | 1.0 | 756 | $1,029 | $1.36 | 24d | 1 | 0.78mi |
| 23077 Davey Ave Hazel Park, MI | 3.0 | 1.0 | 933 | $1,895 | $2.03 | 24d | 1 | 0.80mi |
| 23115 Tawas Ave Hazel Park, MI | 2.0 | 1.0 | 706 | $1,375 | $1.95 | 24d | 1 | 0.83mi |
| 23345 Tawas Ave Hazel Park, MI | 3.0 | 1.0 | 1000 | $1,550 | $1.55 | 10d | 1 | 0.93mi |
| 266 W Goulson Ave Hazel Park, MI | 3.0 | 1.0 | 942 | $1,600 | $1.70 | 21d | 1 | 0.94mi |
| 1561 E Webster St Ferndale, MI | 2.0 | 1.0 | 939 | $1,600 | $1.70 | 24d | 1 | 0.97mi |
| 23400 Reynolds Ave Hazel Park, MI | 3.0 | 1.0 | 1305 | $1,900 | $1.46 | 5d | 1 | 1.00mi |
| 19995 Goddard St Detroit, MI | 4.0 | 1.0 | 1292 | $1,400 | $1.08 | 21d | 1 | 1.01mi |
| 19703 Keating St Highland Park, MI | 3.0 | 1.0 | 1000 | $1,200 | $1.20 | 16d | 1 | 1.02mi |
| 20255 Harned St Detroit, MI | 3.0 | 1.0 | 1000 | $1,374 | $1.37 | 16d | 1 | 1.03mi |
| 2023 Ardmore Dr Ferndale, MI | 2.0 | 1.0 | 771 | $1,250 | $1.62 | 24d | 1 | 1.07mi |
| 2709 Capitol Ave Warren, MI | 3.0 | 2.0 | 1056 | $1,649 | $1.56 | 43d | 1 | 1.19mi |
| 1770 E Woodward Heights Blvd Unit E3 Hazel Park, MI | 2.0 | 1.0 | 850 | $1,300 | $1.53 | 24d | 1 | 1.19mi |
| 1770 E Woodward Heights Blvd Hazel Park, MI | 2.0 | 1.0 | 850 | $1,525 | $1.79 | 12d | 1 | 1.19mi |
| 1770 E Woodward Heights Blvd Hazel Park, MI | 1.0–2.0 | 1.0 | 712 | $1,400 | $1.96 | 5d | 1 | 1.19mi |
| 1045 E Woodward Heights Blvd Hazel Park, MI | 1.0–2.0 | 1.0 | 715 | $1,209 | $1.69 | 24d | 3 | 1.20mi |
| 1820 E Troy St Ferndale, MI | 3.0 | 1.0 | 1167 | $1,500 | $1.29 | 4d | 1 | 1.20mi |
| 322 Jeff Keeton Dr Hazel Park, MI | 2.0 | 2.5 | 1334 | $2,350 | $1.76 | 1d | 1 | 1.29mi |
| 790 Jewell St Ferndale, MI | 2.0 | 1.0 | 800 | $1,445 | $1.81 | 24d | 1 | 1.37mi |
| 19694 Gallagher St Detroit, MI | 3.0 | 1.0 | 1000 | $1,150 | $1.15 | 14d | 1 | 1.41mi |
| 20000 Norwood St Detroit, MI | 3.0 | 1.5 | 1150 | $1,200 | $1.04 | 24d | 1 | 1.44mi |
| 691 E Mapledale Ave Hazel Park, MI | 2.0 | 1.0 | 1333 | $1,500 | $1.13 | 10d | 1 | 1.46mi |
| 18882 Marx St Highland Park, MI | 2.0 | 1.0 | 1000 | $1,300 | $1.30 | 43d | 1 | 1.47mi |
| 959 E Shevlin Ave Hazel Park, MI | 3.0 | 1.0 | 1419 | $1,750 | $1.23 | 14d | 1 | 1.49mi |
Listing history 7 events
-
2026-06-18days on market $165,000 Active 7 DOM
-
2026-06-17days on market $165,000 Active 6 DOM
-
2026-06-16days on market $165,000 Active 5 DOM
-
2026-06-15days on market $165,000 Active 4 DOM
-
2026-06-13days on market $165,000 Active 2 DOM
-
2026-06-13remarks 671-char remark
-
2026-06-13$165,000 Active 1 DOM
ⓘ Source: listings_history table (triggers on properties + properties_extension) + one-shot
backfill from property_details.listing_events for pre-trigger history.
Tax reassessment forecast MI · Partial reset (capped growth)
- Current annual tax
- $3,600 · $300/mo
- Projected year-2 tax
- $3,600 · $300/mo
- Expected delta
- $0/yr ($0/mo · 0.0%)
ⓘ Screening estimate from a state-policy table — verify with the county assessor before closing.
Climate risk First Street
- Flood 1/10 Low FEMA zone X (unshaded) · 0% chance over 30 yrs
- Wildfire 1/10 Low
- Heat 3/10 Moderate 7 d/yr ≥97°F today · 15 d/yr by 30 yrs out
- Wind 2/10 Low
- Air quality 3/10 Moderate 3 unhealthy d/yr today · 5 by 30 yrs out
Nearby sold comps map
Loading sold comps map…
Walkable amenities ~0.75 mi
Loading nearby amenities…
Taxation est. · year 1
- Rental income
- $18,851
- − Mortgage interest
- −$9,243
- − Property taxes
- −$3,600
- − Insurance
- −$825
- − Repairs & maintenance
- −$1,508
- − Management
- −$1,508
- − Depreciation
- −$4,800
- Taxable loss
- −$2,632
- Est. tax savings @ 24.0%
- +$632
- After-tax cash flow
- $716/yr
For passive investors: Depreciation is non-cash, so a rental often shows a tax loss while cash-flowing — sheltering income. Rental losses are passive: they offset passive income freely, and up to $25,000/yr can offset ordinary (W-2) income if you actively participate and your MAGI is under $100k (phasing out to $0 by $150k); unused losses carry forward. On sale, claimed depreciation is recaptured at up to 25%, and gains may owe capital-gains tax (a 1031 exchange can defer both). Figures are a year-1 estimate at your 24.0% rate — not tax advice; consult a CPA.
Schools (NCES district)
- District
- Hazel Park School District
- NCES district ID
- 2618030
- Math proficiency
- 10% ▼ -2.00%
- Reading proficiency
- 24% ▲ 1.00%
- Median HH income
- $36,181
- Composite
- 14.05/100
- National rank
- #9466
- State rank
- #490 of 540 in MI
Livability — Hazel Park
- Score
- 81/100
- State rank
- #65
- US rank
- #1385
Category grades
Schools grade is shown separately in the Schools card above.
Census & demographics
- Census place
- Hazel Park, MI
- County
- Oakland County · 1,009,092 people
- City population
- 14,963
- Metro
- Detroit-Warren-Dearborn, MI
- Population (ZIP)
- 14,963
- Household income
- $67,073
- Rent vs Own
- Severe rent burden
- 432.0
Population outlook (Oakland County) Hauer SSP2
- Today (2025)
- 1,335,747 people
- By 2030
- 1,375,100 · +2.9%
- By 2040
- 1,435,385 · +7.5%
- By 2050
- 1,469,250 · +10.0%
- By 2075
- 1,531,946 · +14.7%
- By 2100
- 1,450,485 · +8.6%
Race, ethnicity, and origin ACS 2023
- Neighborhood character
- Predominantly White (74%)
- Race & ethnicity
- White 74% Two or more races 10% Black 10% Hispanic / Latino 6% Asian 1%
- Hispanic origin (detail)
- Mexican 3% Puerto Rican 2%
- Common ancestry
- Romanian 11% Slovak 3% Lithuanian 2%
- Foreign-born
- 5% · Canada
- Languages at home
- 92% English-only · Spanish 5% Arabic 1% Russian/Polish/Slavic 1%
Political lean MEDSL · Oakland
- 2024 margin
- D (+10.6) · D 54.4% · R 43.8% · Other 1.9%
- 2008→2024 swing
- -3.9pp toward R · 2008: 14.5pp · 2024: 10.6pp
- All cycles
- 2024: D+10.6 2020: D+14.1 2016: D+8.1 2012: D+8.1 2008: D+14.5
Not yet ingested
- Civics
- —
Market trends
- HPI YoY
- ▼ -184.32%
- Current HPI
- 285.5923
- Rent YoY
- ▲ 2.90%
- Metro
- Detroit-Warren-Dearborn, MI
- State GDP YoY
- ▲ 1.37%
- F500 in state
- 28
Industry mix (Fortune 500 HQ in MI)
| Industry | F500 HQs | Revenue |
|---|---|---|
| Automotive Parts | 3 | $48B |
|
||
| Automotive | 2 | $372B |
|
||
| Chemicals | 1 | $45B |
|
||
| Automotive Retail | 1 | $29B |
|
||
| Healthcare / Medical Devices | 1 | $23B |
|
||
| Automotive Technology | 1 | $20B |
|
||
Price history
+573.5% since first listed11 events — show timeline
- 2026-06-12 Listed $165,000 MiRealSource-MiMLS
- 2026-06-12 Listed $165,000 REALCOMP
- 2026-06-10 Coming Soon $165,000 MiRealSource-MiMLS
- 2023-06-07 Sold (Public Records) $140,000 Public Records
- 2023-05-23 Sold (MLS) $140,000 MiRealSource-MiMLS
- 2023-05-23 Sold (MLS) $140,000 REALCOMP
- 2023-04-24 Pending — MiRealSource-MiMLS
- 2023-04-24 Pending — REALCOMP
- 2023-04-21 Listed $129,000 MiRealSource-MiMLS
- 2023-04-21 Listed $129,000 REALCOMP
- 1977-10-01 Sold (Public Records) $24,500 Public Records
Property tax history
+8.4%/yrLatest (2025): $3,600 · +1.9% YoY. Source: county tax records.
Cash-flow waterfall
monthlySold comps — $/sqft
last 12 mo · ≤1 miLoading sold comps…