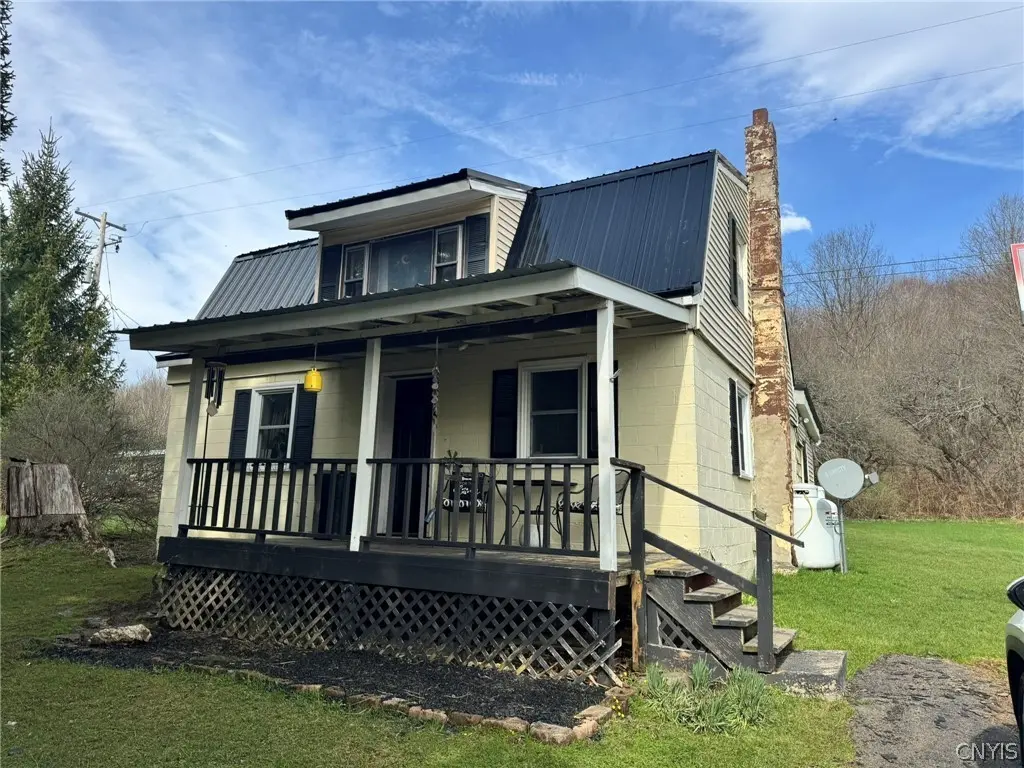
6698 Truxton Tully Rd · Tully, NY
Flood risk 1/10 · Minimal
- FEMA flood zone
- X (unshaded)
- Chance of flooding over 30 yrs
- 0.0%
- Est. flood insurance / yr
- $507 – $1,088
Fire risk 1/10 · Minimal
- Est. fire insurance / yr
- $691 – $1,283
Heat risk 1/10 · Minimal
- Hot days now (above 92°F)
- 7 days/yr
- Hot days in 30 yrs
- 17 days/yr
Wind risk 1/10 · Minimal
- Chance of severe wind over 30 yrs
- 1.0%
Air-quality risk 2/10 · Minimal
- Unhealthy air days now
- 0 days/yr
- Unhealthy air days in 30 yrs
- 1 days/yr
Risk factors via First Street. Map © Google.
Why this score? — see what drove the B+ grade
The composite is a weighted blend of 9 inputs, each scored 0–100. Each bar is that input's sub-score; the figure is the points it added to the 100-point composite (weight × sub-score).
- Cash flow +26.7/30.0
- ARV discount +15.0/15.0
- DSCR +9.2/10.0
- 1% rule +7.8/10.0
- Appreciation +6.3/10.0
- Schools +4.7/10.0
- Livability +3.2/5.0
- Rent growth +2.5/5.0
- Condition / age +2.5/5.0
$129,900
🖨 Deal sheet 📄 Offer letter ✓ Due diligence
Listing remarks MLS
Located in the desirable Homer School District, this 3-bedroom, 1-bath home is set on 1.45 acres, offering a blend of country surroundings and convenient access to nearby amenities. Recent updates enhance both comfort and value, including a brand new metal roof, new flooring, an updated kitchen, and many replacement windows. The property provides ample outdoor space for recreation, gardening, or future expansion, making it a great opportunity for those seeking a home with room to enjoy the outdoors!
Key facts
- Metal roof
- New flooring
- Updated kitchen
Tags
Neighborhood map
What this means for you Summary
Snapshot
- This is a 3-bed/1.0-bath single-family listed at $130k.
Deal economics
- At list price, monthly cash flow is $351 ($4k/yr) — positive.
- The deal already cash-flows at list — no discount required.
- Meets the 1% rule at list price ($2k rent vs $130k).
- Recommended offer: $122k (6.0% below list) — sets the bar for market timing.
- Cap rate 9.5% vs local median 1.7% in Tully — top-decile yield for the area; either an underpriced asset or a hidden risk that comps aren't pricing in. Stress-test before assuming the spread holds.
Location & tenants
- Location reads 63/100 on livability (#800 in NY) — a middle-class / working-renter tenant base. Strengths: housing A+, cost of living A-; Watch: employment D, crime F, amenities F.
- Homer Central School District (town): math 49% / reading 59% proficiency, ranked #306 of 590 in NY (top 52%) — acceptable for families but not a draw, mixed tenant base, ~2y average lease.
- Market conditions: 18 active listings in the ZIP; 45 units permitted in Cortland County in 2024 (12 in 5+ unit buildings).
Forward outlook
- In year one you build about $4k of equity ($898 loan paydown + $3k appreciation (2.7% local appreciation)).
- Cortland County population projected at -15% by 2050 — secular population decline; favor cash flow + early exit over multi-decade hold.
- At projected returns (2.7% appreciation + 3.0% rent growth), your $36k cash investment doubles in ~4 years — after that, you're playing with house money.
- By year 8, paydown + projected appreciation supports a ~$32k cash-out refi (75% LTV) — recoverable capital for the next deal without selling this one.
Negotiation context
- It's been on market 63 days — a 6% lower offer ($122k) is reasonable based on typical stale-listing flexibility.
- Current owner paid $53k; list at $130k implies a 147% gain — meaningful room to come down on a strong offer.
Risks & watch-outs
- Watch-outs: built in 1955 — expect roof / HVAC / electrical / plumbing capex.
Questions for the listing agent
- It's been on market 63 days. Have you received any prior offers? Is the seller open to a 6% concession, seller financing, or rate buy-down credit?
- Built in 1955 — when were the roof, HVAC, electrical panel, plumbing, and water heater last replaced?
- Why hasn't it sold? Are there any deal-killer items the seller is aware of (foundation, flood, title, zoning, code violations)?
- Is there a deadline driving the sale (1031 exchange, divorce, estate, relocation)? That informs how much negotiation room exists.
- Schools are B-rated — typically a magnet for longer-tenancy family renters. What's the average tenant stay here, and is there a school-zone premium baked into asking?
- Crime grade is F in this area — have there been break-ins, vandalism, or insurance claims at this property in the last 3 years? What carrier currently insures it and at what premium?
- What's the average days-on-market for RENTAL listings here right now (not sales)? A rising rental-DOM trend means longer vacancies and softer asking-rent achievability than the comps imply.
- What's the recent tenant-quality profile in this submarket — average credit score on applications, eviction rate, late-payment / NSF rate, and stable-employment percentage? A property-management company in the area should have these aggregated.
- How much new for-sale + rental construction is in the pipeline within 1–3 miles? Heavy new supply typically softens prices + rents 12–24 months out; constrained supply supports both.
Investment metrics
- 1% rule
- 1.28% ✓
- Cap rate
- 9.54%
- Cash-on-cash
- 11.59%
- DSCR
- 1.52
- GRM
- 6.5
CMA / ARV
- ARV (median comp)
- $227,044
- List price
- $129,900
- Delta
- -42.79%
- Verdict
- UNDERPRICED
- Comps
- 2 within 2.0 mi
Projected returns pro-forma
2.67% appreciation · 3.0% rent growth · sell at horizon
- IRR
- 17.6%
- Equity multiple
- 1.99×
- Total profit
- $35,840
- Equity at exit
- $56,025
- IRR
- 19.3%
- Equity multiple
- 3.73×
- Total profit
- $99,175
- Equity at exit
- $84,533
Cash invested: $36,372 (down + closing). Projections, not guarantees.
Landlord ↔ Tenant lean methodology
- Overall (STATE)
- 15 Strongly Tenant-Friendly
- State New York
- 15 Strongly Tenant-Friendly · D+10
- County
- — inherits STATE
- City
- — inherits STATE
ZIP-level market 13159
- Home prices YoY
- 0.9%
- Active inventory
- 18
- Price-to-rent
- 6.5×
Monthly cashflow live
- Estimated rent
- $1,666 medium interval (Pro) →
- Mortgage (P&I)
- −$681
- Tax from tax record
- −$230 /mo · $2,756/yr
- Insurance
- −$54
- HOA
- −$0
- Vacancy / Maint / Mgmt
- −$350
- Net cashflow
- $351
Break-even live
UW: 25.0% down · 7.5% · 30yr · 1.5% tax · 5.0% vac · 8.0% maint · 8.0% mgmt
Financing live
Cash to close
- Down payment
- $32,475
- Closing costs
- $3,897
- Reserves months
- —
- Total cash needed
- —
Loan-product check · same deal, 3 products live
Conventional
25% down · 7.5% · 30yr
- Down + closing
- —
- Monthly P&I
- —
- Monthly cashflow
- —
- DSCR
- —
- Eligible?
- —
Personal DTI + credit; lowest rate.
DSCR
20% down · 8.5% · 30yr
- Down + closing
- —
- Monthly P&I
- —
- Monthly cashflow
- —
- DSCR
- —
- Eligible?
- —
No personal income docs; deal must DSCR.
Hard money
10% down · 12.0% · 12mo
- Down + closing
- —
- Monthly P&I
- —
- Monthly cashflow
- —
- DSCR
- —
- Eligible?
- —
Short-term bridge; refi at stabilization.
Listing history 16 events
-
2026-06-19days on market $129,900 Active 63 DOM
-
2026-06-18days on market $129,900 Active 62 DOM
-
2026-06-17days on market $129,900 Active 61 DOM
-
2026-06-16days on market $129,900 Active 60 DOM
-
2026-06-15days on market $129,900 Active 59 DOM
-
2026-06-14days on market $129,900 Active 57 DOM
-
2026-06-12days on market $129,900 Active 56 DOM
-
2026-06-09days on market $129,900 Active 53 DOM
-
2026-06-08days on market $129,900 Active 52 DOM
-
2026-06-07pricedays on market $129,900 Active 51 DOM
-
2026-06-02days on market $139,900 Active 46 DOM
-
2026-06-01days on market $139,900 Active 45 DOM
-
2026-05-31days on market $139,900 Active 44 DOM
-
2026-05-30days on market $139,900 Active 43 DOM
-
2026-04-17$139,900 Active 504-char remark
Show marketing remark (504 chars)
Located in the desirable Homer School District, this 3-bedroom, 1-bath home is set on 1.45 acres, offering a blend of country surroundings and convenient access to nearby amenities. Recent updates enhance both comfort and value, including a brand new metal roof, new flooring, an updated kitchen, and many replacement windows. The property provides ample outdoor space for recreation, gardening, or future expansion, making it a great opportunity for those seeking a home with room to enjoy the outdoors!
-
2008-07-25soldstatus $52,600
ⓘ Source: listings_history table (triggers on properties + properties_extension) + one-shot
backfill from property_details.listing_events for pre-trigger history.
Tax reassessment forecast NY · Partial reset (capped growth)
- Current annual tax
- $2,756 · $230/mo
- Projected year-2 tax
- $2,756 · $230/mo
- Expected delta
- $0/yr ($0/mo · 0.0%)
ⓘ Screening estimate from a state-policy table — verify with the county assessor before closing.
Climate risk First Street
- Flood 1/10 Low FEMA zone X (unshaded) · 0% chance over 30 yrs
- Wildfire 1/10 Low
- Heat 1/10 Low 7 d/yr ≥92°F today · 17 d/yr by 30 yrs out
- Wind 1/10 Low 100% chance of damaging wind over 30 yrs
- Air quality 2/10 Low 0 unhealthy d/yr today · 1 by 30 yrs out
Nearby sold comps map
Loading sold comps map…
Walkable amenities ~0.75 mi
Loading nearby amenities…
Taxation est. · year 1
- Rental income
- $19,992
- − Mortgage interest
- −$7,276
- − Property taxes
- −$2,756
- − Insurance
- −$650
- − Repairs & maintenance
- −$1,599
- − Management
- −$1,599
- − Depreciation
- −$3,779
- Taxable income
- $2,333
- Est. tax owed @ 24.0%
- −$560
- After-tax cash flow
- $3,654/yr
For passive investors: Depreciation is non-cash, so a rental often shows a tax loss while cash-flowing — sheltering income. Rental losses are passive: they offset passive income freely, and up to $25,000/yr can offset ordinary (W-2) income if you actively participate and your MAGI is under $100k (phasing out to $0 by $150k); unused losses carry forward. On sale, claimed depreciation is recaptured at up to 25%, and gains may owe capital-gains tax (a 1031 exchange can defer both). Figures are a year-1 estimate at your 24.0% rate — not tax advice; consult a CPA.
Schools (NCES district)
- District
- Homer Central School District
- NCES district ID
- 3614640
- Math proficiency
- 49% ▼ -1.00%
- Reading proficiency
- 59% ▲ 9.00%
- Median HH income
- $60,122
- Composite
- 47.03/100
- National rank
- #2342
- State rank
- #306 of 590 in NY
Livability — Tully
- Score
- 63/100
- State rank
- #800
- US rank
- #15471
Category grades
Schools grade is shown separately in the Schools card above.
Census & demographics
- City population
- 5,297
- Population (ZIP)
- 5,297
Population outlook (Cortland County) Hauer SSP2
- Today (2025)
- 47,543 people
- By 2030
- 46,107 · -3.0%
- By 2040
- 43,122 · -9.3%
- By 2050
- 40,216 · -15.4%
- By 2075
- 34,717 · -27.0%
- By 2100
- 28,953 · -39.1%
Race, ethnicity, and origin ACS 2023
- Neighborhood character
- Predominantly White (92%)
- Race & ethnicity
- White 92% Two or more races 6% Hispanic / Latino 4%
- Common ancestry
- Romanian 4% Iranian 2% Slovak 2%
- Foreign-born
- 2% · Canada
- Languages at home
- 97% English-only · Spanish 1%
Political lean MEDSL · Cortland
- 2024 margin
- Lean R (+6.4) · D 46.8% · R 53.2%
- 2008→2024 swing
- -16.4pp toward R · 2008: 10.0pp · 2024: -6.4pp
- All cycles
- 2024: R+6.4 2020: R+1.9 2016: R+6.7 2012: D+8.8 2008: D+10.0
Not yet ingested
- Civics
- —
Market trends
- HPI YoY
- ▲ 2.67%
- Current HPI
- 293.4315
- Rent YoY
- —
- Metro
- —
- State GDP YoY
- ▲ 2.60%
- F500 in state
- 92
Industry mix (Fortune 500 HQ in NY)
| Industry | F500 HQs | Revenue |
|---|---|---|
| Financial Services | 10 | $950B |
|
||
| Consumer Goods | 9 | $162B |
|
||
| Insurance | 4 | $225B |
|
||
| Telecommunications | 2 | $144B |
|
||
| Pharmaceuticals | 2 | $112B |
|
||
| Media / Entertainment | 2 | $69B |
|
||
Price history
+166.0% since first listed2 events — show timeline
- 2026-04-17 Listed $139,900 CNYIS
- 2008-07-25 Sold (Public Records) $52,600 Public Records
Property tax history
-2.5%/yrLatest (2025): $2,756 · -0.4% YoY. Source: county tax records.
Cash-flow waterfall
monthlySold comps — $/sqft
last 12 mo · ≤1 miLoading sold comps…