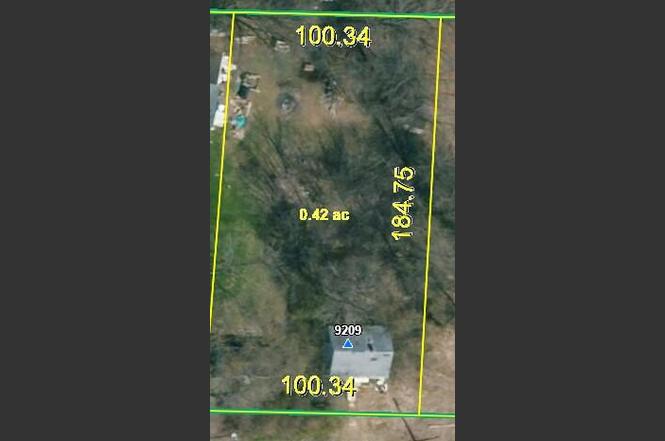
9209 Osage Grand Ave · Taos, MO
Flood risk 5/10 · Moderate
- FEMA flood zone
- AE
- Chance of flooding over 30 yrs
- 0.24%
- Est. flood insurance / yr
- $1,737 – $8,500
Fire risk 1/10 · Minimal
- Est. fire insurance / yr
- $1,054 – $1,958
Heat risk 4/10 · Minor
- Hot days now (above 106°F)
- 7 days/yr
- Hot days in 30 yrs
- 19 days/yr
Wind risk 2/10 · Minimal
- Chance of severe wind over 30 yrs
- 0.0%
Air-quality risk 1/10 · Minimal
- Unhealthy air days now
- 0 days/yr
- Unhealthy air days in 30 yrs
- 0 days/yr
Risk factors via First Street. Map © Google.
Why this score? — see what drove the B- grade
The composite is a weighted blend of 9 inputs, each scored 0–100. Each bar is that input's sub-score; the figure is the points it added to the 100-point composite (weight × sub-score).
- Cash flow +30.0/30.0
- 1% rule +10.0/10.0
- DSCR +10.0/10.0
- ARV discount +7.5/15.0
- Schools +3.5/10.0
- Livability +3.5/5.0
- Rent growth +2.5/5.0
- Condition / age +2.5/5.0
- Appreciation +0.0/10.0
$30,000
🖨 Deal sheet 📄 Offer letter ✓ Due diligence
Listing remarks MLS
Lot near the Osage River with electric and water to house. House is in disrepair and will need removed. Small community close to Jefferson City to be away from the hustle and bustle.
Key facts
- Electric and water
- Osage river
- Small community
Tags
Property features AI
Exterior
- Parking: No garage
- Home design: Single family residence; Residential property
- Exterior features: 1.42-acre lot
Interior
- Bedrooms: 1 total room
- Bathrooms: 1 full bathroom
- Interior features: Crawl space basement
Neighborhood map
What this means for you Summary
Snapshot
- This is a 2-bed/1.0-bath single-family listed at $30k.
Deal economics
- At list price, monthly cash flow is $156 ($2k/yr) — positive.
- The deal already cash-flows at list — no discount required.
- Meets the 1% rule at list price ($999 rent vs $30k).
- Recommended offer: $26k (12.0% below list) — sets the bar for market timing.
Location & tenants
- Location reads 70/100 on livability (#136 in MO) — a middle-class / working-renter tenant base. Strengths: crime A+, employment A+, cost of living A+; Watch: amenities F, commute F, health & safety F.
- Jefferson City (urban): math 34% / reading 48% proficiency, ranked #121 of 324 in MO (top 37%) — families likely to look elsewhere, expect single-tenant / working-renter base with shorter leases.
- Zoned schools: Moreau Heights Elem. (math 27% / reading 37%, grade F, #761 of 1,115 statewide, top 72%, 328 students, 60% FRL); Lewis And Clark Middle (math 27% / reading 42%, grade F, #243 of 391 statewide, top 65%, 1,005 students, 56% FRL); Jefferson City High (math 46% / reading 63%, grade C-, #69 of 521 statewide, top 15%, 1,296 students, 48% FRL).
- Market conditions: 189 active listings in the ZIP; 173 units permitted in Cole County in 2024 (0 in 5+ unit buildings).
Forward outlook
- Local home prices are declining (-3.0%/yr); year-one equity from $207 of loan paydown is wiped out by about $900 of value loss. Plan a longer hold.
- Cole County population projected to shrink 5% by 2050 — rents likely to lag national; underwrite the cash flow, not the appreciation.
- At projected returns (-3.0% appreciation + 3.0% rent growth), your $8k cash investment doubles in ~6 years — after that, you're playing with house money.
Negotiation context
- It's been on market 132 days — a 12% lower offer ($26k) is reasonable based on typical stale-listing flexibility.
- 5 sale attempts since 2y ago with the ask held roughly flat each time — persistent listings suggest the price (not the market) is what's stuck; bring a comps-based counter.
Risks & watch-outs
- Watch-outs: flood insurance adds $427/mo; built in 1950 — expect roof / HVAC / electrical / plumbing capex.
- Climate carrying-cost: in FEMA flood zone AE (mandatory federal flood insurance) — expect insurance premiums to compound above CPI over the hold.
Questions for the listing agent
- It's been on market 132 days. Have you received any prior offers? Is the seller open to a 12% concession, seller financing, or rate buy-down credit?
- Built in 1950 — when were the roof, HVAC, electrical panel, plumbing, and water heater last replaced?
- What's the actual annual flood-insurance premium (NFIP or private), and is the property in a SFHA with mandatory coverage?
- Why hasn't it sold? Are there any deal-killer items the seller is aware of (foundation, flood, title, zoning, code violations)?
- Is there a deadline driving the sale (1031 exchange, divorce, estate, relocation)? That informs how much negotiation room exists.
- Schools are F-rated, which usually means shorter tenancies and higher turnover. Who's the typical renter profile here, and what's been the actual vacancy rate?
- What's the average days-on-market for RENTAL listings here right now (not sales)? A rising rental-DOM trend means longer vacancies and softer asking-rent achievability than the comps imply.
- What's the recent tenant-quality profile in this submarket — average credit score on applications, eviction rate, late-payment / NSF rate, and stable-employment percentage? A property-management company in the area should have these aggregated.
- How much new for-sale + rental construction is in the pipeline within 1–3 miles? Heavy new supply typically softens prices + rents 12–24 months out; constrained supply supports both.
Investment metrics
- 1% rule
- 3.33% ✓
- Cap rate
- 29.58%
- Cash-on-cash
- 83.17%
- DSCR
- 4.70
- GRM
- 2.5
CMA / ARV
No comps found within radius.
Projected returns pro-forma
-3.0% appreciation · 3.0% rent growth · sell at horizon
- IRR
- 15.7%
- Equity multiple
- 1.63×
- Total profit
- $5,329
- Equity at exit
- $4,473
- IRR
- 24.7%
- Equity multiple
- 3.21×
- Total profit
- $18,530
- Equity at exit
- $2,594
Cash invested: $8,400 (down + closing). Projections, not guarantees.
Landlord ↔ Tenant lean methodology
- Overall (STATE)
- 81 Strongly Landlord-Friendly
- State Missouri
- 81 Strongly Landlord-Friendly · R+10
- County
- — inherits STATE
- City
- — inherits STATE
ZIP-level market 65101
- Home prices YoY
- -29.1%
- Active inventory
- 189
- Price-to-rent
- 2.5×
Monthly cashflow live
- Estimated rent
- $999 medium interval (Pro) →
- Mortgage (P&I)
- −$157
- Tax est. 1.5%
- −$38 /mo · $450/yr
- Insurance
- −$12
- Flood insurance flood zone
- −$427 /mo · $5,118/yr
- HOA
- −$0
- Vacancy / Maint / Mgmt
- −$210
- Net cashflow
- $156
Break-even live
UW: 25.0% down · 7.5% · 30yr · 1.5% tax · 5.0% vac · 8.0% maint · 8.0% mgmt
Financing live
Cash to close
- Down payment
- $7,500
- Closing costs
- $900
- Reserves months
- —
- Total cash needed
- —
Loan-product check · same deal, 3 products live
Conventional
25% down · 7.5% · 30yr
- Down + closing
- —
- Monthly P&I
- —
- Monthly cashflow
- —
- DSCR
- —
- Eligible?
- —
Personal DTI + credit; lowest rate.
DSCR
20% down · 8.5% · 30yr
- Down + closing
- —
- Monthly P&I
- —
- Monthly cashflow
- —
- DSCR
- —
- Eligible?
- —
No personal income docs; deal must DSCR.
Hard money
10% down · 12.0% · 12mo
- Down + closing
- —
- Monthly P&I
- —
- Monthly cashflow
- —
- DSCR
- —
- Eligible?
- —
Short-term bridge; refi at stabilization.
Listing history 29 events
-
2026-06-19days on market $30,000 Active 132 DOM
-
2026-06-18days on market $30,000 Active 131 DOM
-
2026-06-17days on market $30,000 Active 130 DOM
-
2026-06-16days on market $30,000 Active 129 DOM
-
2026-06-15days on market $30,000 Active 128 DOM
-
2026-06-14days on market $30,000 Active 126 DOM
-
2026-06-13days on market $30,000 Active 125 DOM
-
2026-06-10days on market $30,000 Active 123 DOM
-
2026-06-09days on market $30,000 Active 122 DOM
-
2026-06-08days on market $30,000 Active 121 DOM
-
2026-06-07days on market $30,000 Active 120 DOM
-
2026-06-05days on market $30,000 Active 117 DOM
-
2026-06-03days on market $30,000 Active 116 DOM
-
2026-06-02days on market $30,000 Active 115 DOM
-
2026-06-01days on market $30,000 Active 114 DOM
-
2026-05-31days on market $30,000 Active 113 DOM
-
2026-05-30days on market $30,000 Active 112 DOM
-
2026-02-07$30,000 Active 182-char remark
Show marketing remark (182 chars)
Lot near the Osage River with electric and water to house. House is in disrepair and will need removed. Small community close to Jefferson City to be away from the hustle and bustle.
-
2026-02-07$30,000 Active 182-char remark
Show marketing remark (182 chars)
Lot near the Osage River with electric and water to house. House is in disrepair and will need removed. Small community close to Jefferson City to be away from the hustle and bustle.
-
2026-02-07$30,000 Active
Show marketing remark (182 chars)
Lot near the Osage River with electric and water to house. House is in disrepair and will need removed. Small community close to Jefferson City to be away from the hustle and bustle.
-
2025-08-25price $29,000
-
2025-08-25price $29,000
-
2025-08-25price $29,000
-
2024-09-23price $35,000
-
2024-09-23price $35,000
-
2024-09-23price $35,000
-
2024-08-27$40,000 Active
-
2024-08-27$40,000 Active
-
2022-10-19soldstatus
ⓘ Source: listings_history table (triggers on properties + properties_extension) + one-shot
backfill from property_details.listing_events for pre-trigger history.
Climate risk First Street
- Flood 5/10 Major FEMA zone AE · 24% chance over 30 yrs
- Wildfire 1/10 Low
- Heat 4/10 Moderate 7 d/yr ≥106°F today · 19 d/yr by 30 yrs out
- Wind 2/10 Low 0% chance of damaging wind over 30 yrs
- Air quality 1/10 Low 0 unhealthy d/yr today · 0 by 30 yrs out
Nearby sold comps map
Loading sold comps map…
Walkable amenities ~0.75 mi
Loading nearby amenities…
Taxation est. · year 1
- Rental income
- $11,992
- − Mortgage interest
- −$1,680
- − Property taxes
- −$450
- − Insurance
- −$5,268
- − Repairs & maintenance
- −$959
- − Management
- −$959
- − Depreciation
- −$873
- Taxable income
- $1,802
- Est. tax owed @ 24.0%
- −$432
- After-tax cash flow
- $1,435/yr
For passive investors: Depreciation is non-cash, so a rental often shows a tax loss while cash-flowing — sheltering income. Rental losses are passive: they offset passive income freely, and up to $25,000/yr can offset ordinary (W-2) income if you actively participate and your MAGI is under $100k (phasing out to $0 by $150k); unused losses carry forward. On sale, claimed depreciation is recaptured at up to 25%, and gains may owe capital-gains tax (a 1031 exchange can defer both). Figures are a year-1 estimate at your 24.0% rate — not tax advice; consult a CPA.
Schools (NCES district)
- District
- Jefferson City
- NCES district ID
- 2916190
- Math proficiency
- 34% ▼ -1.00%
- Reading proficiency
- 48% ▲ 5.00%
- Median HH income
- $51,903
- Composite
- 35.45/100
- National rank
- #4930
- State rank
- #121 of 324 in MO
Livability — Taos
- Score
- 70/100
- State rank
- #136
- US rank
- #7797
Category grades
Schools grade is shown separately in the Schools card above.
Census & demographics
- Population (ZIP)
- 29,777
Population outlook (Cole County) Hauer SSP2
- Today (2025)
- 78,107 people
- By 2030
- 78,089 · +-0.0%
- By 2040
- 76,814 · -1.7%
- By 2050
- 74,515 · -4.6%
- By 2075
- 67,687 · -13.3%
- By 2100
- 55,023 · -29.6%
Race, ethnicity, and origin ACS 2023
- Neighborhood character
- Predominantly White (73%)
- Race & ethnicity
- White 73% Black 19% Two or more races 5% Hispanic / Latino 3%
- Common ancestry
- Slovak 2% Lithuanian 2% Italian 1%
- Foreign-born
- 3% · Canada
- Languages at home
- 96% English-only · Spanish 2%
Political lean MEDSL · Cole
- 2024 margin
- Solid R (+34.4) · D 32.1% · R 66.5% · Other 1.4%
- 2008→2024 swing
- -7.5pp toward R · 2008: -26.9pp · 2024: -34.4pp
- All cycles
- 2024: R+34.4 2020: R+33.9 2016: R+36.8 2012: R+33.7 2008: R+26.9
Not yet ingested
- Civics
- —
Market trends
- HPI YoY
- ▼ -86.16%
- Current HPI
- 209.3832
- Rent YoY
- —
- Metro
- —
- State GDP YoY
- ▲ 1.84%
- F500 in state
- 20
Industry mix (Fortune 500 HQ in MO)
| Industry | F500 HQs | Revenue |
|---|---|---|
| Healthcare | 1 | $163B |
|
||
| Insurance | 1 | $21B |
|
||
| Industrial Technology | 1 | $17B |
|
||
| Retail | 1 | $16B |
|
||
| Industrial Distribution | 1 | $10B |
|
||
| Utilities | 1 | $9B |
|
||
Price history
-25.0% since first listed12 events — show timeline
- 2026-02-07 Listed $30,000 HMMLS
- 2026-02-07 Listed $30,000 JCMLS
- 2026-02-07 Listed $30,000 CBORMLS
- 2025-08-25 Price Changed $29,000 JCMLS
- 2025-08-25 Price Changed $29,000 HMMLS
- 2025-08-25 Price Changed $29,000 CBORMLS
- 2024-09-23 Price Changed $35,000 HMMLS
- 2024-09-23 Price Changed $35,000 CBORMLS
- 2024-09-23 Price Changed $35,000 JCMLS
- 2024-08-27 Listed $40,000 HMMLS
- 2024-08-27 Listed $40,000 CBORMLS
- 2022-10-19 Sold (Public Records) — Public Records
Property tax history
-8.3%/yrLatest (2025): $51 · +1.3% YoY. Source: county tax records.
Cash-flow waterfall
monthlySold comps — $/sqft
last 12 mo · ≤1 miLoading sold comps…