2105 S 2nd St · Fayetteville, IL
Flood risk 1/10 · Minimal
- FEMA flood zone
- X
- Chance of flooding over 30 yrs
- 0.0%
- Est. flood insurance / yr
- $507 – $1,088
Fire risk 1/10 · Minimal
- Est. fire insurance / yr
- $804 – $1,492
Heat risk 5/10 · Moderate
- Hot days now (above 106°F)
- 7 days/yr
- Hot days in 30 yrs
- 21 days/yr
Wind risk 2/10 · Minimal
- Chance of severe wind over 30 yrs
- 1.0%
Air-quality risk 1/10 · Minimal
- Unhealthy air days now
- 0 days/yr
- Unhealthy air days in 30 yrs
- 0 days/yr
Risk factors via First Street. Map © Google.
Why this score? — see what drove the B- grade
The composite is a weighted blend of 9 inputs, each scored 0–100. Each bar is that input's sub-score; the figure is the points it added to the 100-point composite (weight × sub-score).
- Cash flow +30.0/30.0
- 1% rule +10.0/10.0
- DSCR +10.0/10.0
- ARV discount +7.5/15.0
- Schools +4.7/10.0
- Livability +2.8/5.0
- Rent growth +2.5/5.0
- Condition / age +2.5/5.0
- Appreciation +0.0/10.0
$95,000
🖨 Deal sheet 📄 Offer letter ✓ Due diligence
Listing remarks
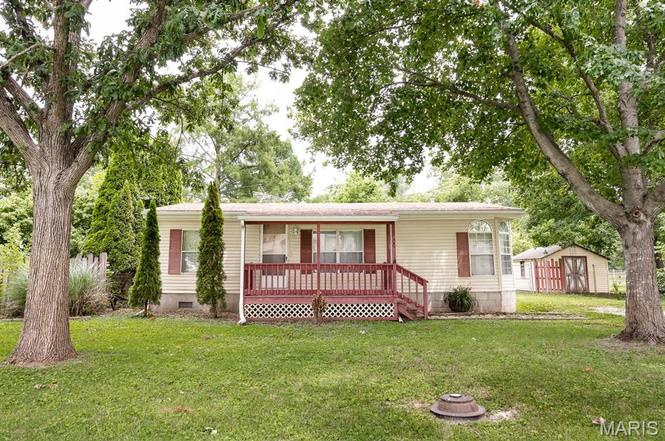
Opportunity awaits in the heart of Fayetteville! This 3-bedroom, 2-bath manufactured home offers plenty of potential for a buyer looking to add their own personal touches and updates. Featuring a spacious layout, mature trees, and a generously sized yard, this property provides the perfect canvas to create your ideal home. Outside, you'll find a storage shed and an expansive yard with endless possibilities for gardening, outdoor entertaining, or simply enjoying the peaceful surroundings. The large lot offers plenty of room to grow and make the space your own. Conveniently located within the highly sought-after Freeburg School District, this property combines small-town living with excellent
Key facts
- Large lot
- Storage shed
- 0.33 acre lot
Tags
Property features AI
Finance
- Other: Seller may consider concessions; Home warranty not included
- Financial info: No second mortgage reported
Exterior
- Utilities: Public water; Public sewer; Electric service by Ameren; Natural gas connected
- Home design: Manufactured home (double wide); Single-story; Permanent foundation
- Construction: Vinyl siding
- Exterior features: Covered porch; Deck; Full yard fencing; Landscaped yard with many trees; Back yard; Shed(s)
Interior
- Kitchen: Gas range; Refrigerator; Open to main living area
- Bedrooms: 3 bedrooms (all on the main level)
- Bathrooms: 2 full bathrooms (both on the main level)
- Heating & cooling: Forced-air heating; Central air conditioning
- Interior features: Washer/Dryer included; Gas range; Refrigerator
- Laundry & utility: Main-level laundry room
Neighborhood map
What this means for you Summary
Snapshot
- This is a 3-bed/2.0-bath manufactured listed at $95k.
Deal economics
- At list price, monthly cash flow is $733 ($9k/yr) — positive.
- The deal already cash-flows at list — no discount required.
- Meets the 1% rule at list price ($2k rent vs $95k).
Location & tenants
- Location reads 56/100 on livability (#1,226 in IL) — a working-class tenant base; expect higher turnover. Strengths: cost of living A+, housing B+; Watch: crime D, amenities F, commute F.
- Freeburg Chsd 77 (suburban): math 50% / reading 50% proficiency, ranked #150 of 919 in IL (top 16%) — acceptable for families but not a draw, mixed tenant base, ~2y average lease.
- Zoned schools: Freeburg Community High Sch (math 27% / reading 37%, grade F, #157 of 693 statewide, top 25%, 683 students, 0% FRL).
- Zoned-school proficiency averages 32% at this address vs 50% district-wide (-18 pts) — the specific schools serving this property underperform the Freeburg Chsd 77 average; the district grade overstates school quality for this exact location.
- Market conditions: 58 active listings in the ZIP; solid renter incomes; 783 units permitted in St. Clair County in 2024 (378 in 5+ unit buildings).
Forward outlook
- Local home prices are declining (-3.0%/yr); year-one equity from $657 of loan paydown is wiped out by about $3k of value loss. Plan a longer hold.
- St. Clair County population projected at -23% by 2050 — secular population decline; favor cash flow + early exit over multi-decade hold.
- At projected returns (-3.0% appreciation + 3.0% rent growth), your $27k cash investment doubles in ~4 years — after that, you're playing with house money.
Negotiation context
- Only 1 days on market — expect competitive offers; lowballing is unlikely to land.
Risks & watch-outs
- Climate carrying-cost: extreme-heat days projected 7→21/yr by 2055 (HVAC capex compounding) — expect insurance premiums to compound above CPI over the hold.
Questions for the listing agent
- Is there a deadline driving the sale (1031 exchange, divorce, estate, relocation)? That informs how much negotiation room exists.
- Schools are F-rated, which usually means shorter tenancies and higher turnover. Who's the typical renter profile here, and what's been the actual vacancy rate?
- Crime grade is D in this area — have there been break-ins, vandalism, or insurance claims at this property in the last 3 years? What carrier currently insures it and at what premium?
- What's the average days-on-market for RENTAL listings here right now (not sales)? A rising rental-DOM trend means longer vacancies and softer asking-rent achievability than the comps imply.
- What's the recent tenant-quality profile in this submarket — average credit score on applications, eviction rate, late-payment / NSF rate, and stable-employment percentage? A property-management company in the area should have these aggregated.
- How much new for-sale + rental construction is in the pipeline within 1–3 miles? Heavy new supply typically softens prices + rents 12–24 months out; constrained supply supports both.
Investment metrics
- 1% rule
- 1.73% ✓
- Cap rate
- 15.55%
- Cash-on-cash
- 33.07%
- DSCR
- 2.47
- GRM
- 4.8
CMA / ARV
No comps found within radius.
Projected returns pro-forma
-3.0% appreciation · 3.0% rent growth · sell at horizon
- IRR
- 28.2%
- Equity multiple
- 2.18×
- Total profit
- $31,256
- Equity at exit
- $14,165
- IRR
- 35.7%
- Equity multiple
- 4.28×
- Total profit
- $87,195
- Equity at exit
- $8,214
Cash invested: $26,600 (down + closing). Projections, not guarantees.
Landlord ↔ Tenant lean methodology
- Overall (STATE)
- 43 Moderately Tenant-Leaning
- State Illinois
- 43 Moderately Tenant-Leaning · D+7
- County
- — inherits STATE
- City
- — inherits STATE
ZIP-level market 62258
- Home prices YoY
- -27.2%
- Active inventory
- 58
- Price-to-rent
- 4.8×
Monthly cashflow live
- Estimated rent
- $1,640 medium interval (Pro) →
- Mortgage (P&I)
- −$498
- Tax from tax record
- −$25 /mo · $296/yr
- Insurance
- −$40
- HOA
- −$0
- Vacancy / Maint / Mgmt
- −$344
- Net cashflow
- $733
Break-even live
UW: 25.0% down · 7.5% · 30yr · 1.5% tax · 5.0% vac · 8.0% maint · 8.0% mgmt
Financing live
Cash to close
- Down payment
- $23,750
- Closing costs
- $2,850
- Reserves months
- —
- Total cash needed
- —
Loan-product check · same deal, 3 products live
Conventional
25% down · 7.5% · 30yr
- Down + closing
- —
- Monthly P&I
- —
- Monthly cashflow
- —
- DSCR
- —
- Eligible?
- —
Personal DTI + credit; lowest rate.
DSCR
20% down · 8.5% · 30yr
- Down + closing
- —
- Monthly P&I
- —
- Monthly cashflow
- —
- DSCR
- —
- Eligible?
- —
No personal income docs; deal must DSCR.
Hard money
10% down · 12.0% · 12mo
- Down + closing
- —
- Monthly P&I
- —
- Monthly cashflow
- —
- DSCR
- —
- Eligible?
- —
Short-term bridge; refi at stabilization.
Listing history 2 events
-
2026-06-19remarks 699-char remark
-
2026-06-19$95,000 Coming Soon 1 DOM
ⓘ Source: listings_history table (triggers on properties + properties_extension) + one-shot
backfill from property_details.listing_events for pre-trigger history.
Tax reassessment forecast IL · Partial reset (capped growth)
- Current annual tax
- $296 · $25/mo
- Projected year-2 tax
- $1,226 · $102/mo
- Expected delta
- +$930/yr (+$78/mo · 314.1%)
ⓘ Screening estimate from a state-policy table — verify with the county assessor before closing.
Climate risk First Street
- Flood 1/10 Low FEMA zone X · 0% chance over 30 yrs
- Wildfire 1/10 Low
- Heat 5/10 Major 7 d/yr ≥106°F today · 21 d/yr by 30 yrs out
- Wind 2/10 Low 100% chance of damaging wind over 30 yrs
- Air quality 1/10 Low 0 unhealthy d/yr today · 0 by 30 yrs out
Nearby sold comps map
Loading sold comps map…
Walkable amenities ~0.75 mi
Loading nearby amenities…
Taxation est. · year 1
- Rental income
- $19,677
- − Mortgage interest
- −$5,321
- − Property taxes
- −$296
- − Insurance
- −$475
- − Repairs & maintenance
- −$1,574
- − Management
- −$1,574
- − Depreciation
- −$2,764
- Taxable income
- $7,673
- Est. tax owed @ 24.0%
- −$1,841
- After-tax cash flow
- $6,954/yr
For passive investors: Depreciation is non-cash, so a rental often shows a tax loss while cash-flowing — sheltering income. Rental losses are passive: they offset passive income freely, and up to $25,000/yr can offset ordinary (W-2) income if you actively participate and your MAGI is under $100k (phasing out to $0 by $150k); unused losses carry forward. On sale, claimed depreciation is recaptured at up to 25%, and gains may owe capital-gains tax (a 1031 exchange can defer both). Figures are a year-1 estimate at your 24.0% rate — not tax advice; consult a CPA.
Schools (NCES district)
- District
- Freeburg Chsd 77
- NCES district ID
- 1715840
- Math proficiency
- 50% ▲ 10.00%
- Reading proficiency
- 50% ▲ 10.00%
- Median HH income
- $72,936
- Composite
- 46.99/100
- National rank
- #5143
- State rank
- #150 of 919 in IL
Livability — Fayetteville
- Score
- 56/100
- State rank
- #1226
- US rank
- #23007
Category grades
Schools grade is shown separately in the Schools card above.
Census & demographics
- Census place
- Fayetteville, IL
- County
- Saint Clair County · 169,691 people
- Metro
- St. Louis, MO-IL
- Population (ZIP)
- 10,437
- Household income
- $94,655
- Rent vs Own
- Severe rent burden
- 209.0
Population outlook (St. Clair County) Hauer SSP2
- Today (2025)
- 250,366 people
- By 2030
- 240,511 · -3.9%
- By 2040
- 217,391 · -13.2%
- By 2050
- 192,699 · -23.0%
- By 2075
- 140,637 · -43.8%
- By 2100
- 100,499 · -59.9%
Race, ethnicity, and origin ACS 2023
- Neighborhood character
- Predominantly White (81%)
- Race & ethnicity
- White 81% Two or more races 8% Hispanic / Latino 7% Black 3% Asian 2% Native American 1%
- Hispanic origin (detail)
- Mexican 2%
- Common ancestry
- Romanian 4% Slovak 2% Italian 2%
- Foreign-born
- 3% · Canada
- Languages at home
- 92% English-only · Spanish 4% Tagalog/Filipino 1% Other Asian/Pacific 1%
Political lean MEDSL · St. Clair
- 2024 margin
- Lean D (+7.9) · D 53.0% · R 45.1% · Other 1.8%
- 2008→2024 swing
- -14.6pp toward R · 2008: 22.4pp · 2024: 7.9pp
- All cycles
- 2024: D+7.9 2020: D+8.7 2016: D+5.6 2012: D+14.5 2008: D+22.4
Not yet ingested
- Civics
- —
Market trends
- HPI YoY
- ▼ -68.21%
- Current HPI
- 182.8448
- Rent YoY
- —
- Metro
- St. Louis, MO-IL
- State GDP YoY
- ▲ 1.59%
- F500 in state
- 60
Industry mix (Fortune 500 HQ in IL)
| Industry | F500 HQs | Revenue |
|---|---|---|
| Insurance | 4 | $201B |
|
||
| Consumer Goods | 4 | $87B |
|
||
| Industrial Machinery | 3 | $64B |
|
||
| Healthcare | 2 | $55B |
|
||
| Retail / Pharmacy | 1 | $148B |
|
||
| Agriculture / Food | 1 | $86B |
|
||
Price history
1 event — show timeline
- 2026-06-19 Coming Soon $95,000 MARIS as Distributed by MLS Grid
Property tax history
+14.7%/yrLatest (2018): $296 · +4.6% YoY. Source: county tax records.
Cash-flow waterfall
monthlySold comps — $/sqft
last 12 mo · ≤1 miLoading sold comps…