148 Twins Trl · Hutto, TX
Flood risk No data
- FEMA flood zone
- —
- Chance of flooding over 30 yrs
- —
- Est. flood insurance / yr
- —
Fire risk No data
- Est. fire insurance / yr
- —
Heat risk No data
- Hot days now (above threshold)
- —
- Hot days in 30 yrs
- —
Wind risk No data
- Chance of severe wind over 30 yrs
- —
Air-quality risk No data
- Unhealthy air days now
- —
- Unhealthy air days in 30 yrs
- —
Risk factors via First Street. Map © Google.
Why this score? — see what drove the D- grade
The composite is a weighted blend of 9 inputs, each scored 0–100. Each bar is that input's sub-score; the figure is the points it added to the 100-point composite (weight × sub-score).
- ARV discount +12.8/15.0
- Cash flow +10.1/30.0
- Livability +3.9/5.0
- Schools +3.3/10.0
- DSCR +2.9/10.0
- Condition / age +2.5/5.0
- 1% rule +2.2/10.0
- Rent growth +1.9/5.0
- Appreciation +0.0/10.0
$305,999
🖨 Deal sheet (PDF) 📄 Offer letter ✓ Due diligence
Listing remarks
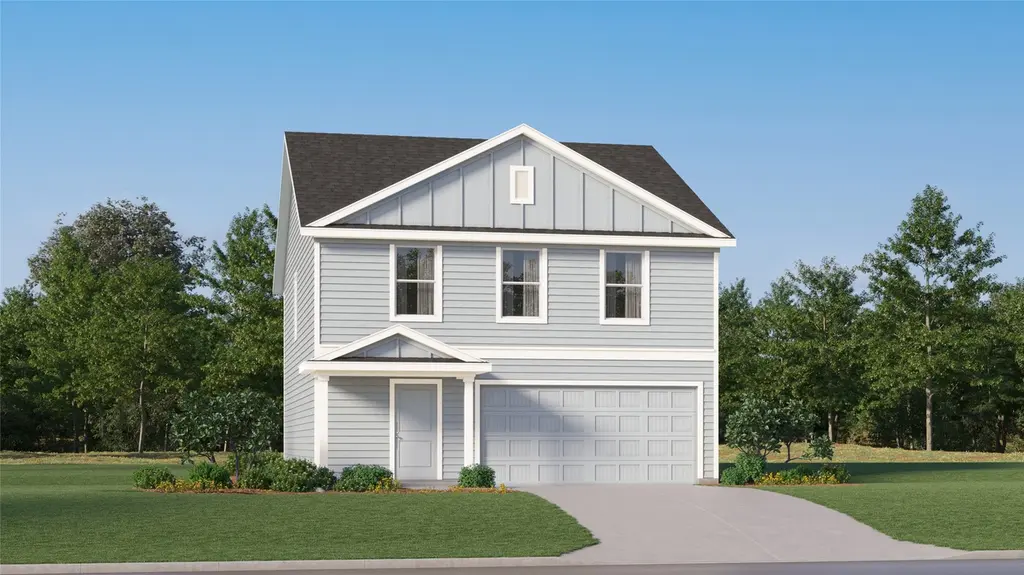
The Whitetail - The first floor of this two-story home shares a spacious open layout between the kitchen, dining room and family room for easy entertaining. Upstairs are three secondary bedrooms, ideal for residents and overnight guests, surrounding a versatile loft that serves as an additional shared living space. An owner's suite sprawls across the rear of the second floor and enjoys an en-suite bathroom and a walk-in closet. Photos are for illustrative purposes only. Estimated Completion August 2026. The completion date, prices and features may vary and are subject to change. Please verify with Lennar directly.
Key facts
- Walk-in closet
- Open layout
- En-suite bathroom
Tags
Property features AI
Finance
- HOA & community: Homeowners association (Winfield Park HOA); HOA fee $68 per month (covers common area maintenance); Community amenities: playground, pool, sport court(s)
Exterior
- Parking: Attached garage (2 spaces); 2 covered parking spaces
- Utilities: Electricity available; Public water; Public sewer (connected)
- Home design: 2-story home; New construction; Faces northwest
- Construction: Built by Lennar; Brick and cement siding with HardiPlank; Composition roof; Slab foundation
- Exterior features: Private yard; Back yard; Front yard; Interior lot; Privacy wood fencing; Community pool
Interior
- Kitchen: Dishwasher; Range
- Flooring: Carpet; Vinyl
- Bathrooms: 2 full bathrooms
- Heating & cooling: Central heating; Central air conditioning
- Interior features: Main-level primary bedroom; Open floor plan; Walk-in closet(s)
- Laundry & utility: Inside laundry on main level
Neighborhood map
What this means for you Summary
Snapshot
- This is a 4-bed/2.0-bath other listed at $306k.
Deal economics
- At list price, monthly cash flow is $-178 ($-2k/yr) — negative.
- To cash-flow at today's rent, offer at most $275k (10.3% below list).
- To meet the 1% rule (rent ≥ 1% of price), the offer needs to be $221k (27.8% below list).
- Recommended offer: $221k (27.8% below list) — sets the bar for 1% rule.
- Cap rate 5.6% vs local median 3.6% in Hutto — top-decile yield for the area; either an underpriced asset or a hidden risk that comps aren't pricing in. Stress-test before assuming the spread holds.
Location & tenants
- Location reads 77/100 on livability (#79 in TX, #2,794 nationally) — a middle-class / working-renter tenant base. Strengths: crime A+, housing A+, health & safety A+; Watch: amenities C-, commute F.
- Hutto ISD (rural): math 30% / reading 42% proficiency, ranked #438 of 826 in TX (top 53%) — families likely to look elsewhere, expect single-tenant / working-renter base with shorter leases.
- Zoned schools: Hutto El (math 33% / reading 45%, grade F, #1,651 of 4,322 statewide, top 39%, 744 students, 36% FRL); Hutto H S (math 35% / reading 54%, grade F, #652 of 1,632 statewide, top 43%, 2,010 students, 40% FRL) — zoned schools at 38% FRL track the district average.
- Market conditions: Rents soft (-2.4%/yr); 1039 active listings in the ZIP; 40 comparable units currently listed for rent nearby; rentals at typical pace (median 20d on market — plan ~3-4 weeks tenant-placement turnaround); 40% of comp listings sitting > 30 days — soft ceiling on asking rent; high-income renter base; 7,543 units permitted in Williamson County in 2024 (1,425 in 5+ unit buildings).
Forward outlook
- Local home prices are declining (-3.0%/yr); year-one equity from $2k of loan paydown is wiped out by about $9k of value loss. Plan a longer hold.
- Williamson County population projected at +69% by 2050 — long-run rental-demand tailwind backs the buy-and-hold thesis.
Negotiation context
- It's been on market 41 days — a 3% lower offer ($297k) is reasonable based on typical stale-listing flexibility.
Questions for the listing agent
- What do current leases actually rent for vs. the listed asking? Can we see a recent rent roll and the last 12 months of T-12 income?
- It's been on market 41 days. Have you received any prior offers? Is the seller open to a 28% concession, seller financing, or rate buy-down credit?
- What does the HOA fee cover, when was the last increase, and are there any pending special assessments or reserve-fund shortfalls?
- Is there a deadline driving the sale (1031 exchange, divorce, estate, relocation)? That informs how much negotiation room exists.
- The area grade is low — what's the realistic commute time and amenity access for the typical tenant pool here? Any planned neighborhood developments (good or bad) we should know about?
- What's the average days-on-market for RENTAL listings here right now (not sales)? A rising rental-DOM trend means longer vacancies and softer asking-rent achievability than the comps imply.
- What's the recent tenant-quality profile in this submarket — average credit score on applications, eviction rate, late-payment / NSF rate, and stable-employment percentage? A property-management company in the area should have these aggregated.
- How much new for-sale + rental construction is in the pipeline within 1–3 miles? Heavy new supply typically softens prices + rents 12–24 months out; constrained supply supports both.
Investment metrics
- 1% rule
- 0.72% ✗
- Cap rate
- 5.59%
- Cash-on-cash
- -2.49%
- DSCR
- 0.89
- GRM
- 11.5
CMA / ARV
- ARV (median comp)
- $347,132
- List price
- $305,999
- Delta
- -11.85%
- Verdict
- UNDERPRICED
- Comps
- 20 within 1.0 mi
Projected returns pro-forma
-3.0% appreciation · 0.0% rent growth · sell at horizon
- IRR
- -23.5%
- Equity multiple
- 0.21×
- Total profit
- $-67,481
- Equity at exit
- $45,625
- IRR
- -28.1%
- Equity multiple
- -0.15×
- Total profit
- $-98,722
- Equity at exit
- $26,457
Cash invested: $85,680 (down + closing). Projections, not guarantees.
Landlord ↔ Tenant lean methodology
- Overall (STATE)
- 87 Strongly Landlord-Friendly
- State Texas
- 87 Strongly Landlord-Friendly · R+5
- County
- — inherits STATE
- City
- — inherits STATE
ZIP-level market 78634
- Rents YoY
- -2.4%
- Active inventory
- 1039
- Price-to-rent
- 11.5×
Monthly cashflow live
- Estimated rent
- $2,209 high interval (Pro) →
- Mortgage (P&I)
- −$1,605
- Tax from tax record
- −$123 /mo · $1,475/yr
- Insurance
- −$127
- HOA
- −$68
- Vacancy / Maint / Mgmt
- −$464
- Net cashflow
- $-178
Break-even live
Sensitivity live
| Price | -10% $-5 | -5% $-91 | +0% $-178 | +5% $-265 | +10% $-351 |
|---|---|---|---|---|---|
| Rent | -10% $-353 | -5% $-265 | +0% $-178 | +5% $-91 | +10% $-4 |
| Rate | -1.0pp $-24 | -0.5pp $-100 | base $-178 | +0.5pp $-257 | +1.0pp $-338 |
UW: 25.0% down · 7.5% · 30yr · 1.5% tax · 5.0% vac · 8.0% maint · 8.0% mgmt
Financing live
Cash to close
- Down payment
- $76,500
- Closing costs
- $9,180
- Reserves months
- —
- Total cash needed
- —
Loan-product check · same deal, 3 products live
Conventional
25% down · 7.5% · 30yr
- Down + closing
- —
- Monthly P&I
- —
- Monthly cashflow
- —
- DSCR
- —
- Eligible?
- —
Personal DTI + credit; lowest rate.
DSCR
20% down · 8.5% · 30yr
- Down + closing
- —
- Monthly P&I
- —
- Monthly cashflow
- —
- DSCR
- —
- Eligible?
- —
No personal income docs; deal must DSCR.
Hard money
10% down · 12.0% · 12mo
- Down + closing
- —
- Monthly P&I
- —
- Monthly cashflow
- —
- DSCR
- —
- Eligible?
- —
Short-term bridge; refi at stabilization.
Rent comps 40 comps
| Address | Beds | Baths | Sqft | Rent | $/sqft | DOM | Units | Dist |
|---|---|---|---|---|---|---|---|---|
| 223 Chickasaw Ln Hutto, TX | 4.0 | 3.0 | 2356 | $2,275 | $0.97 | 6d | 1 | 0.52mi |
| 223 Chickasaw Ln Hutto, TX | 4.0 | 3.0 | 2356 | $2,300 | $0.98 | 19d | 1 | 0.52mi |
| 105 Ulmus St Hutto, TX | 4.0 | 2.0 | 1919 | $2,100 | $1.09 | 45d | 1 | 0.58mi |
| 202 Quail Cir Hutto, TX | 3.0 | 2.0 | 1434 | $1,700 | $1.19 | 24d | 1 | 0.60mi |
| 101 Red Buckeye St Hutto, TX | 4.0 | 2.0 | 1919 | $2,200 | $1.15 | 45d | 1 | 0.61mi |
| 1015 Bluejack Way Hutto, TX | 3.0 | 2.0 | 1767 | $2,475 | $1.40 | 6d | 1 | 0.62mi |
| 741 Carol Dr Hutto, TX | 3.0 | 2.0 | 1819 | $2,150 | $1.18 | 45d | 1 | 0.63mi |
| 201 Quail Cir Hutto, TX | 3.0 | 2.0 | 1422 | $1,950 | $1.37 | 45d | 1 | 0.63mi |
| 741 Carol Dr Hutto, TX | 3.0 | 2.0 | 1819 | $2,150 | $1.18 | 19d | 1 | 0.63mi |
| 1001 Bluejack Way Hutto, TX | 4.0 | 2.0 | 1622 | $2,045 | $1.26 | 6d | 1 | 0.63mi |
| 746 Carol Dr Hutto, TX | 4.0 | 3.0 | 2298 | $2,099 | $0.91 | 4d | 1 | 0.64mi |
| 1005 Pallano Rd Hutto, TX | 3.0 | 2.5 | 1910 | $2,250 | $1.18 | 19d | 1 | 0.78mi |
| 117 Colthorpe Ln Hutto, TX | 3.0 | 2.0 | 1735 | $1,950 | $1.12 | 46d | 1 | 0.96mi |
| 401 County Road 199 Hutto, TX | 1.0–3.0 | 1.0–2.5 | 1013 | $2,443 | $2.41 | 0d | 65 | 1.10mi |
| 132 Canley Loop Hutto, TX | 3.0 | 2.0 | 1279 | $4,800 | $3.75 | 19d | 1 | 1.18mi |
| 112 Creekside Dr Hutto, TX | 3.0 | 2.5 | 1352 | $1,875 | $1.39 | 19d | 1 | 1.20mi |
| 104 Bankside Dr Hutto, TX | 4.0 | 3.0 | 2100 | $2,250 | $1.07 | 13d | 1 | 1.26mi |
| 106 Phillips St Hutto, TX | 3.0 | 2.5 | 1930 | $1,895 | $0.98 | 26d | 1 | 1.29mi |
| 106 Phillips St Hutto, TX | 3.0 | 2.5 | 1930 | $1,895 | $0.98 | 14d | 1 | 1.29mi |
| 1007 Wolseley Cv Hutto, TX | 4.0 | 3.0 | 2356 | $2,295 | $0.97 | 6d | 1 | 1.29mi |
| 108 Greenspire Ln Hutto, TX | 3.0 | 2.0 | 1853 | $2,100 | $1.13 | 45d | 1 | 1.31mi |
| 208 Skyfire ST Hutto, TX | 4.0 | 2.0 | 1600 | $1,995 | $1.25 | 26d | 1 | 1.31mi |
| 208 Skyfire ST Hutto, TX | 4.0 | 2.0 | 1600 | $1,995 | $1.25 | 45d | 1 | 1.31mi |
| 102 Greenspire Ln Hutto, TX | 4.0 | 3.0 | 2199 | $2,295 | $1.04 | 45d | 1 | 1.34mi |
| 318 Canley Loop Hutto, TX | 3.0 | 2.0 | 1430 | $1,900 | $1.33 | 6d | 1 | 1.34mi |
| 102 Ostracoda Ln Hutto, TX | 3.0 | 2.5 | 2474 | $2,250 | $0.91 | 6d | 1 | 1.35mi |
| 202 Fairmeadow Downs Dr Hutto, TX | 4.0 | 2.5 | 2116 | $2,225 | $1.05 | 45d | 1 | 1.37mi |
| 204 Big Sandy Creek Dr Hutto, TX | 4.0 | 3.0 | 2314 | $2,300 | $0.99 | 45d | 1 | 1.38mi |
| 202 Big Sandy Creek Dr Hutto, TX | 4.0 | 3.0 | 2282 | $2,275 | $1.00 | 45d | 1 | 1.39mi |
| 126 Fairmeadow Downs Dr Hutto, TX | 4.0 | 2.0 | 1607 | $1,995 | $1.24 | 45d | 1 | 1.39mi |
| 203 E Pecan St Unit B Hutto, TX | 3.0 | 2.0 | 1688 | $1,900 | $1.13 | 16d | 1 | 1.40mi |
| 318 Durango Downs Dr Hutto, TX | 3.0 | 2.0 | 1311 | $1,850 | $1.41 | 45d | 1 | 1.41mi |
| 128 Big Sandy Creek Dr Hutto, TX | 4.0 | 2.0 | 2035 | $2,300 | $1.13 | 45d | 1 | 1.42mi |
| 235 Sweetwater Creek Ln Hutto, TX | 3.0 | 2.0 | 1472 | $1,850 | $1.26 | 19d | 1 | 1.42mi |
| 216 Arnage Dr Hutto, TX | 4.0 | 2.0 | 2100 | $2,125 | $1.01 | 6d | 1 | 1.43mi |
| 124 Carrington St Hutto, TX | 3.0 | 2.0 | 1742 | $1,965 | $1.13 | 6d | 1 | 1.43mi |
| 607 Water Way Ave Hutto, TX | 4.0 | 2.0 | 1830 | $1,995 | $1.09 | 0d | 1 | 1.44mi |
| 231 Sweetwater Creek Ln Hutto, TX | 4.0 | 2.0 | 1839 | $2,290 | $1.25 | 19d | 1 | 1.45mi |
| 110 Grapefruit Rd Hutto, TX | 4.0 | 2.5 | 2581 | $2,275 | $0.88 | 46d | 1 | 1.45mi |
| 207 Coventry Dr Hutto, TX | 4.0 | 2.0 | 1622 | $1,950 | $1.20 | 45d | 1 | 1.45mi |
HOA detail
- Monthly dues
- $68 · $816/yr
Listing history 16 events
-
2026-06-21days on market $305,999 Active 41 DOM
-
2026-06-18days on market $305,999 Active 38 DOM
-
2026-06-17days on market $305,999 Active 37 DOM
-
2026-06-16days on market $305,999 Active 36 DOM
-
2026-06-15days on market $305,999 Active 35 DOM
-
2026-06-13days on market $305,999 Active 33 DOM
-
2026-06-09pricedays on market $305,999 Active 29 DOM
-
2026-06-08days on market $310,999 Active 28 DOM
-
2026-06-07days on market $310,999 Active 27 DOM
-
2026-06-04days on market $310,999 Active 24 DOM
-
2026-06-03days on market $310,999 Active 23 DOM
-
2026-06-02days on market $310,999 Active 22 DOM
-
2026-06-01days on market $310,999 Active 21 DOM
-
2026-05-31days on market $310,999 Active 20 DOM
-
2026-05-12price $314,999 621-char remark
-
2026-05-11$322,999 Active 621-char remark
ⓘ Source: listings_history table (triggers on properties + properties_extension) + one-shot
backfill from property_details.listing_events for pre-trigger history.
Tax reassessment forecast TX · Resets to sale price
- Current annual tax
- $1,475 · $123/mo
- Projected year-2 tax
- $5,600 · $467/mo
- Expected delta
- +$4,125/yr (+$344/mo · 279.7%)
ⓘ Screening estimate from a state-policy table — verify with the county assessor before closing.
Nearby sold comps map
Loading sold comps map…
Walkable amenities ~0.75 mi
Loading nearby amenities…
Taxation est. · year 1
- Rental income
- $26,507
- − Mortgage interest
- −$17,141
- − Property taxes
- −$1,475
- − Insurance
- −$1,530
- − Repairs & maintenance
- −$2,121
- − Management
- −$2,121
- − HOA
- −$816
- − Depreciation
- −$8,902
- Taxable loss
- −$7,597
- Est. tax savings @ 24.0%
- +$1,823
- After-tax cash flow
- $-313/yr
For passive investors: Depreciation is non-cash, so a rental often shows a tax loss while cash-flowing — sheltering income. Rental losses are passive: they offset passive income freely, and up to $25,000/yr can offset ordinary (W-2) income if you actively participate and your MAGI is under $100k (phasing out to $0 by $150k); unused losses carry forward. On sale, claimed depreciation is recaptured at up to 25%, and gains may owe capital-gains tax (a 1031 exchange can defer both). Figures are a year-1 estimate at your 24.0% rate — not tax advice; consult a CPA.
Schools (NCES district)
- District
- Hutto ISD
- NCES district ID
- 4824100
- Math proficiency
- 30% ▼ -17.00%
- Reading proficiency
- 42% ▼ -5.00%
- Median HH income
- $72,961
- Composite
- 33.33/100
- National rank
- #5501
- State rank
- #438 of 826 in TX
Livability — Hutto
- Score
- 77/100
- State rank
- #79
- US rank
- #2794
Category grades
Schools grade is shown separately in the Schools card above.
Census & demographics
- County
- Williamson County · 680,029 people
- City population
- 46,413
- Metro
- Austin-Round Rock-Georgetown, TX
- Population (ZIP)
- 46,413
- Household income
- $114,426
- Rent vs Own
- Severe rent burden
- 410.0
Population outlook (Williamson County) Hauer SSP2
- Today (2025)
- 699,027 people
- By 2030
- 795,537 · +13.8%
- By 2040
- 990,683 · +41.7%
- By 2050
- 1,184,292 · +69.4%
- By 2075
- 1,623,825 · +132.3%
- By 2100
- 1,924,153 · +175.3%
Race, ethnicity, and origin ACS 2023
- Neighborhood character
- Diverse neighborhood (Simpson 0.62)
- Race & ethnicity
- White 50% Hispanic / Latino 35% Two or more races 18% Black 9% Asian 2%
- Hispanic origin (detail)
- Mexican 26% Puerto Rican 1%
- Common ancestry
- Slovak 2% Italian 2% Lithuanian 2%
- Foreign-born
- 13% · Canada
- Languages at home
- 71% English-only · Spanish 23% Other Indo-European 2% Arabic 1%
Political lean MEDSL · Williamson
- 2024 margin
- Toss-up / Even · D 48.0% · R 50.4% · Other 1.6%
- 2008→2024 swing
- +10.6pp toward D · 2008: -13.0pp · 2024: -2.5pp
- All cycles
- 2024: R+2.5 2020: D+1.4 2016: R+9.9 2012: R+21.5 2008: R+13.0
Not yet ingested
- Civics
- —
Market trends
- HPI YoY
- ▼ -106.56%
- Current HPI
- 194.2221
- Rent YoY
- ▼ -2.41%
- Metro
- Austin-Round Rock-Georgetown, TX
- State GDP YoY
- ▲ 3.95%
- F500 in state
- 110
Industry mix (Fortune 500 HQ in TX)
| Industry | F500 HQs | Revenue |
|---|---|---|
| Energy | 16 | $1,198B |
|
||
| Technology | 5 | $198B |
|
||
| Engineering / Construction | 4 | $72B |
|
||
| Energy Services | 3 | $60B |
|
||
| Utilities | 3 | $41B |
|
||
| Healthcare | 2 | $330B |
|
||
Price history
-5.3% since first listed5 events — show timeline
- 2026-06-08 Price Changed $305,999 Unlock MLS
- 2026-05-28 Price Changed $310,999 Unlock MLS
- 2026-05-20 Price Changed $313,999 Unlock MLS
- 2026-05-12 Price Changed $314,999 Unlock MLS
- 2026-05-11 Listed $322,999 Unlock MLS
Property tax history
-9.8%/yrLatest (2026): $1,475 · -9.8% YoY. Source: county tax records.
Cash-flow waterfall
monthlySold comps — $/sqft
last 12 mo · ≤1 miLoading sold comps…