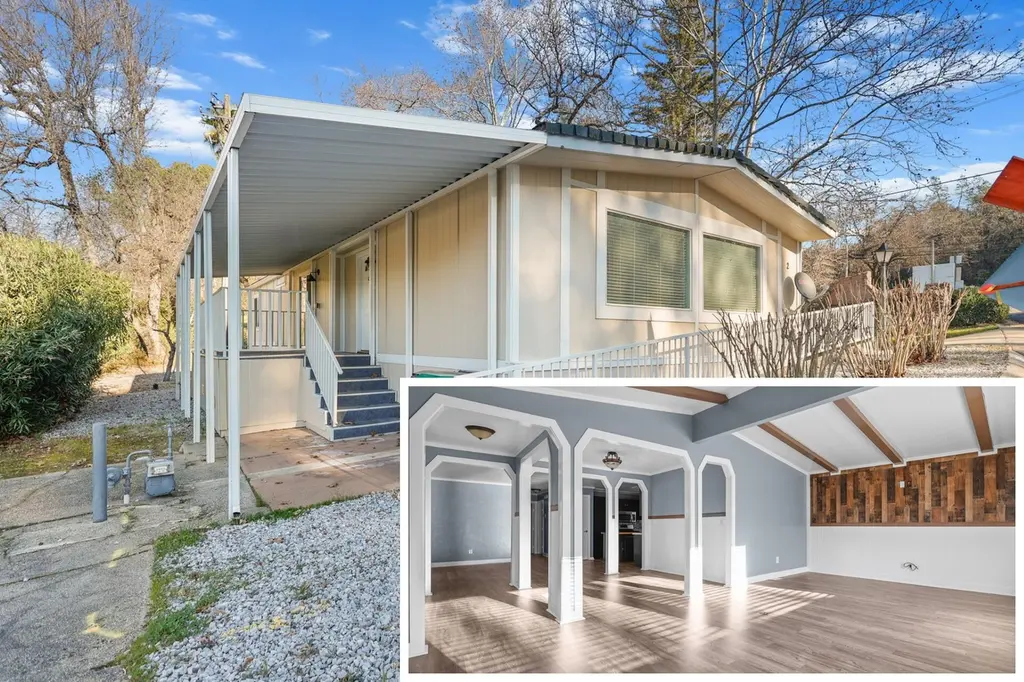
3304 Shasta Dam Blvd Spc 2 · Shasta Lake, CA
Flood risk 1/10 · Minimal
- FEMA flood zone
- X (unshaded)
- Chance of flooding over 30 yrs
- 0.0%
- Est. flood insurance / yr
- $507 – $1,088
Fire risk 7/10 · Major
- Est. fire insurance / yr
- $659 – $1,223
Heat risk 8/10 · Major
- Hot days now (above 105°F)
- 7 days/yr
- Hot days in 30 yrs
- 17 days/yr
Wind risk 1/10 · Minimal
- Chance of severe wind over 30 yrs
- —
Air-quality risk 10/10 · Severe
- Unhealthy air days now
- 44 days/yr
- Unhealthy air days in 30 yrs
- 46 days/yr
Risk factors via First Street. Map © Google.
Why this score? — see what drove the B- grade
The composite is a weighted blend of 9 inputs, each scored 0–100. Each bar is that input's sub-score; the figure is the points it added to the 100-point composite (weight × sub-score).
- Cash flow +30.0/30.0
- 1% rule +10.0/10.0
- DSCR +10.0/10.0
- ARV discount +7.5/15.0
- Condition / age +4.0/5.0
- Livability +3.2/5.0
- Rent growth +2.5/5.0
- Schools +2.5/10.0
- Appreciation +0.0/10.0
$99,900
🖨 Deal sheet (PDF) 📄 Offer letter ✓ Due diligence
Listing remarks MLS
Feels like a new home, this 2 bdrm, 2 bath manufactured home, situated on a lot on park like setting yard with lawn and shade trees. Inviting entry to separate living area from dining and kitchen areas. Tasteful wainscotting in spacious living area. Formal dining area extended from kitchen. Extensive crown molding. Kitchen hosts an island bar, stainless steel gas range and microwave, dishwasher refrigerator. New cabinets with tiled backsplash. Tiled master shower in master bathroom. All located in very desirable park with pond and water fountain, wildlife, walking trail, clubhouse with a host of events for tenants.
Key facts
- Tiled walk-in shower
- Clubhouse
- Updated kitchen
Tags
Property features AI
Finance
- Other: Located as the first mobile to the right when entering the park; cross street: Lake
Exterior
- Parking: Carport with 2 spaces
- Utilities: Public water
- Home design: Manufactured in park (Mobile Home)
- Construction: Wood siding; Pillar/post/pier foundation; Composition roof; Manufactured home model: United States; Wood skirt
- Exterior features: Deck; Asphalt road access
Interior
- Kitchen: Dishwasher; Microwave; Range/Oven; Refrigerator
- Flooring: Laminate flooring
- Heating & cooling: Central air conditioning; Forced air heating
- Interior features: Dishwasher; Dryer; Microwave; Range/Oven; Refrigerator; Washer; Laminate flooring; No fireplace
- Laundry & utility: Washer and dryer included
Neighborhood map
What this means for you Summary
Snapshot
- This is a 2-bed/2.0-bath manufactured listed at $100k. Condition is rated good.
Deal economics
- At list price, monthly cash flow is $561 ($7k/yr) — positive.
- The deal already cash-flows at list — no discount required.
- Meets the 1% rule at list price ($2k rent vs $100k).
- Cap rate 13.0% vs local median 3.7% in Shasta Lake — top-decile yield for the area; either an underpriced asset or a hidden risk that comps aren't pricing in. Stress-test before assuming the spread holds.
Location & tenants
- Location reads 65/100 on livability (#399 in CA) — a middle-class / working-renter tenant base. Strengths: housing A+, health & safety A+, commute A; Watch: employment C-, schools D-, crime F.
- Gateway Unified (suburban): math 25% / reading 35% proficiency, ranked #355 of 517 in CA (top 69%) — families likely to look elsewhere, expect single-tenant / working-renter base with shorter leases.
- Market conditions: 96 active listings in the ZIP; 1 comparable units currently listed for rent nearby; 246 units permitted in Shasta County in 2024 (0 in 5+ unit buildings).
Forward outlook
- Local home prices are declining (-3.0%/yr); year-one equity from $691 of loan paydown is wiped out by about $3k of value loss. Plan a longer hold.
- Shasta County population projected to shrink 9% by 2050 — rents likely to lag national; underwrite the cash flow, not the appreciation.
- At projected returns (-3.0% appreciation + 3.0% rent growth), your $28k cash investment doubles in ~6 years — after that, you're playing with house money.
Negotiation context
- Only 5 days on market — expect competitive offers; lowballing is unlikely to land.
- 4 sale attempts since 9y ago with the ask held roughly flat each time — persistent listings suggest the price (not the market) is what's stuck; bring a comps-based counter.
Risks & watch-outs
- Climate carrying-cost: major wildfire risk; extreme-heat days projected 7→17/yr by 2055 (HVAC capex compounding) — expect insurance premiums to compound above CPI over the hold.
Questions for the listing agent
- Is there a deadline driving the sale (1031 exchange, divorce, estate, relocation)? That informs how much negotiation room exists.
- Schools are D-rated, which usually means shorter tenancies and higher turnover. Who's the typical renter profile here, and what's been the actual vacancy rate?
- Crime grade is F in this area — have there been break-ins, vandalism, or insurance claims at this property in the last 3 years? What carrier currently insures it and at what premium?
- What's the average days-on-market for RENTAL listings here right now (not sales)? A rising rental-DOM trend means longer vacancies and softer asking-rent achievability than the comps imply.
- What's the recent tenant-quality profile in this submarket — average credit score on applications, eviction rate, late-payment / NSF rate, and stable-employment percentage? A property-management company in the area should have these aggregated.
- How much new for-sale + rental construction is in the pipeline within 1–3 miles? Heavy new supply typically softens prices + rents 12–24 months out; constrained supply supports both.
Investment metrics
- 1% rule
- 1.59% ✓
- Cap rate
- 13.03%
- Cash-on-cash
- 24.05%
- DSCR
- 2.07
- GRM
- 5.3
CMA / ARV
- ARV (median comp)
- $53,702
- List price
- $99,900
- Delta
- 114.15%
- Verdict
- OVERPRICED
- Comps
- 20 within 1.0 mi
Show comp detail 12 sales within ~0.75 mi
| Address | Dist | Beds/Ba | Sqft | Sold | Price | $/sf | Match |
|---|---|---|---|---|---|---|---|
| 3304 Shasta Dam Blvd Spc 39 | 0.08mi | 2/2.0 | 1,440 (0%) | 7mo | $72,500 | $50 | 91 |
| 3304 Shasta Dam Blvd #29 | 0.14mi | 2/2.0 | 1,440 (0%) | 8mo | $40,000 | $28 | 87 |
| 3304 Shasta Dam Blvd Spc 60 | 0.20mi | 3/2.0 (+1) | 1,440 (0%) | 2mo | $76,500 | $53 | 84 |
| 3304 Shasta Dam Blvd #96 | 0.27mi | 2/2.0 | 1,536 (+7%) | 3mo | $69,000 | $45 | 73 |
| 3304 Shasta Dam Blvd #65 | 0.44mi | 2/2.0 | 1,400 (-3%) | 3mo | $46,000 | $33 | 72 |
| 3304 Shasta Dam Blvd #52 | 0.13mi | 2/2.0 | 1,248 (-13%) | 2mo | $63,500 | $51 | 70 |
| 3304 Shasta Dam Blvd #136 | 0.24mi | 3/2.0 (+1) | 1,326 (-8%) | 1mo | $97,000 | $73 | 70 |
| 3304 Shasta Dam Blvd #147 | 0.30mi | 3/2.0 (+1) | 1,368 (-5%) | 8mo | $103,500 | $76 | 66 |
| 3304 Shasta Dam Blvd #67 | 0.27mi | 3/2.0 (+1) | 1,344 (-7%) | 6mo | $44,000 | $33 | 66 |
| 3304 Shasta Dam Blvd #8 | 0.05mi | 2/2.0 | 1,248 (-13%) | 12mo | $52,000 | $42 | 66 |
| 3304 Shasta Dam Blvd #131 | 0.22mi | 3/2.0 (+1) | 1,560 (+8%) | 7mo | $94,000 | $60 | 65 |
| 3304 Shasta Dam Blvd Spc 124 | 0.45mi | 3/2.0 (+1) | 1,508 (+5%) | 2mo | $148,000 | $98 | 64 |
Match score weights: distance 35% · size 25% · config 20% · recency 20%. Top-matched comps best support the ARV.
Projected returns pro-forma
-3.0% appreciation · 3.0% rent growth · sell at horizon
- IRR
- 17.3%
- Equity multiple
- 1.70×
- Total profit
- $19,537
- Equity at exit
- $14,895
- IRR
- 25.8%
- Equity multiple
- 3.26×
- Total profit
- $63,081
- Equity at exit
- $8,638
Cash invested: $27,972 (down + closing). Projections, not guarantees.
Landlord ↔ Tenant lean methodology
- Overall (STATE)
- 18 Strongly Tenant-Friendly
- State California
- 18 Strongly Tenant-Friendly · D+13
- County
- — inherits STATE
- City
- — inherits STATE
ZIP-level market 96019
- Active inventory
- 96
- Price-to-rent
- 5.3×
Monthly cashflow live
- Estimated rent
- $1,583 medium interval (Pro) →
- Mortgage (P&I)
- −$524
- Tax est. 1.5%
- −$125 /mo · $1,498/yr
- Insurance
- −$42
- HOA
- −$0
- Vacancy / Maint / Mgmt
- −$333
- Net cashflow
- $561
Break-even live
Sensitivity live
| Price | -10% $630 | -5% $595 | +0% $561 | +5% $526 | +10% $492 |
|---|---|---|---|---|---|
| Rent | -10% $435 | -5% $498 | +0% $561 | +5% $623 | +10% $686 |
| Rate | -1.0pp $611 | -0.5pp $586 | base $561 | +0.5pp $535 | +1.0pp $508 |
UW: 25.0% down · 7.5% · 30yr · 1.5% tax · 5.0% vac · 8.0% maint · 8.0% mgmt
Financing live
Cash to close
- Down payment
- $24,975
- Closing costs
- $2,997
- Reserves months
- —
- Total cash needed
- —
Loan-product check · same deal, 3 products live
Conventional
25% down · 7.5% · 30yr
- Down + closing
- —
- Monthly P&I
- —
- Monthly cashflow
- —
- DSCR
- —
- Eligible?
- —
Personal DTI + credit; lowest rate.
DSCR
20% down · 8.5% · 30yr
- Down + closing
- —
- Monthly P&I
- —
- Monthly cashflow
- —
- DSCR
- —
- Eligible?
- —
No personal income docs; deal must DSCR.
Hard money
10% down · 12.0% · 12mo
- Down + closing
- —
- Monthly P&I
- —
- Monthly cashflow
- —
- DSCR
- —
- Eligible?
- —
Short-term bridge; refi at stabilization.
Rent comps 1 comps
| Address | Beds | Baths | Sqft | Rent | $/sqft | DOM | Units | Dist |
|---|---|---|---|---|---|---|---|---|
| 13710 Pit St Shasta Lake, CA | 2.0 | 1.0 | 1165 | $1,475 | $1.27 | 44d | 1 | 0.51mi |
Listing history 11 events
-
2026-06-21days on market $99,900 Active 5 DOM
-
2026-06-19days on market $99,900 Active 3 DOM
-
2026-06-18days on market $99,900 Active 2 DOM
-
2026-06-16pricedays on market $99,900 Active 1 DOM
-
2026-04-22price $115,000 752-char remark
-
2026-03-09price $124,900 752-char remark
-
2026-01-19$139,900 Active 752-char remark
-
2024-07-12soldstatus $138,500 Closed 623-char remark
Show marketing remark (623 chars)
Feels like a new home, this 2 bdrm, 2 bath manufactured home, situated on a lot on park like setting yard with lawn and shade trees. Inviting entry to separate living area from dining and kitchen areas. Tasteful wainscotting in spacious living area. Formal dining area extended from kitchen. Extensive crown molding. Kitchen hosts an island bar, stainless steel gas range and microwave, dishwasher refrigerator. New cabinets with tiled backsplash. Tiled master shower in master bathroom. All located in very desirable park with pond and water fountain, wildlife, walking trail, clubhouse with a host of events for tenants.
-
2024-06-14status Pending 623-char remark
Show marketing remark (623 chars)
Feels like a new home, this 2 bdrm, 2 bath manufactured home, situated on a lot on park like setting yard with lawn and shade trees. Inviting entry to separate living area from dining and kitchen areas. Tasteful wainscotting in spacious living area. Formal dining area extended from kitchen. Extensive crown molding. Kitchen hosts an island bar, stainless steel gas range and microwave, dishwasher refrigerator. New cabinets with tiled backsplash. Tiled master shower in master bathroom. All located in very desirable park with pond and water fountain, wildlife, walking trail, clubhouse with a host of events for tenants.
-
2024-04-01$149,900 Active 623-char remark
Show marketing remark (623 chars)
Feels like a new home, this 2 bdrm, 2 bath manufactured home, situated on a lot on park like setting yard with lawn and shade trees. Inviting entry to separate living area from dining and kitchen areas. Tasteful wainscotting in spacious living area. Formal dining area extended from kitchen. Extensive crown molding. Kitchen hosts an island bar, stainless steel gas range and microwave, dishwasher refrigerator. New cabinets with tiled backsplash. Tiled master shower in master bathroom. All located in very desirable park with pond and water fountain, wildlife, walking trail, clubhouse with a host of events for tenants.
-
2017-10-20$29,000
ⓘ Source: listings_history table (triggers on properties + properties_extension) + one-shot
backfill from property_details.listing_events for pre-trigger history.
Climate risk First Street
- Flood 1/10 Low FEMA zone X (unshaded) · 0% chance over 30 yrs
- Wildfire 7/10 Severe
- Heat 8/10 Severe 7 d/yr ≥105°F today · 17 d/yr by 30 yrs out
- Wind 1/10 Low
- Air quality 10/10 Extreme 44 unhealthy d/yr today · 46 by 30 yrs out
Nearby sold comps map
Loading sold comps map…
Walkable amenities ~0.75 mi
Loading nearby amenities…
Taxation est. · year 1
- Rental income
- $19,002
- − Mortgage interest
- −$5,596
- − Property taxes
- −$1,498
- − Insurance
- −$500
- − Repairs & maintenance
- −$1,520
- − Management
- −$1,520
- − Depreciation
- −$2,906
- Taxable income
- $5,461
- Est. tax owed @ 24.0%
- −$1,311
- After-tax cash flow
- $5,416/yr
For passive investors: Depreciation is non-cash, so a rental often shows a tax loss while cash-flowing — sheltering income. Rental losses are passive: they offset passive income freely, and up to $25,000/yr can offset ordinary (W-2) income if you actively participate and your MAGI is under $100k (phasing out to $0 by $150k); unused losses carry forward. On sale, claimed depreciation is recaptured at up to 25%, and gains may owe capital-gains tax (a 1031 exchange can defer both). Figures are a year-1 estimate at your 24.0% rate — not tax advice; consult a CPA.
Condition & rehab AI · 12 photos
This move-in ready manufactured home offers a bright and open floor plan with updated kitchen and bathrooms, fresh paint, and wood-look tile flooring. The home is in good condition with minimal maintenance required.
Value-add opportunities
- Both landscaping — enhances curb appeal and adds value
- Both furniture — improves the home's livability and appeal
- Both smart home integration — increases convenience and marketability
Renovation cost estimate screening
Value-add ROI direction
- Both landscaping — enhances curb appeal and adds value ↑
- Both furniture — improves the home's livability and appeal ↑
- Both smart home integration — increases convenience and marketability ↑
ⓘ Cost ranges are severity-bucket heuristics (US national rule-of-thumb). Get contractor quotes + a written scope before underwriting a rehab budget.
Schools (NCES district)
- District
- Gateway Unified
- NCES district ID
- 0614950
- Math proficiency
- 25% ▼ -5.00%
- Reading proficiency
- 35% ▲ 2.00%
- Median HH income
- $41,888
- Composite
- 25.39/100
- National rank
- #7465
- State rank
- #355 of 517 in CA
Livability — Shasta Lake
- Score
- 65/100
- State rank
- #399
- US rank
- #13546
Category grades
Schools grade is shown separately in the Schools card above.
Census & demographics
- Census place
- Shasta Lake, CA
- County
- Shasta County · 147,641 people
- City population
- 10,350
- Metro
- Redding, CA
- Population (ZIP)
- 10,350
- Household income
- $67,446
- Rent vs Own
- Severe rent burden
- 260.0
Population outlook (Shasta County) Hauer SSP2
- Today (2025)
- 179,231 people
- By 2030
- 176,953 · -1.3%
- By 2040
- 169,982 · -5.2%
- By 2050
- 162,547 · -9.3%
- By 2075
- 145,649 · -18.7%
- By 2100
- 123,025 · -31.4%
Race, ethnicity, and origin ACS 2023
- Neighborhood character
- Predominantly White (77%)
- Race & ethnicity
- White 77% Two or more races 12% Hispanic / Latino 9% Asian 4% Native American 2%
- Hispanic origin (detail)
- Mexican 8%
- Common ancestry
- Russian 4% Romanian 4% Italian 4%
- Foreign-born
- 2% · Canada
- Languages at home
- 94% English-only · Spanish 4% Other Asian/Pacific 1%
Political lean MEDSL · Shasta
- 2024 margin
- Solid R (+36.5) · D 30.5% · R 67.0% · Other 2.5%
- 2008→2024 swing
- -10.7pp toward R · 2008: -25.8pp · 2024: -36.5pp
- All cycles
- 2024: R+36.5 2020: R+33.1 2016: R+37.4 2012: R+30.3 2008: R+25.8
Not yet ingested
- Civics
- —
Market trends
- HPI YoY
- ▼ -194.66%
- Current HPI
- 170.6085
- Rent YoY
- —
- Metro
- Redding, CA
- State GDP YoY
- ▲ 3.21%
- F500 in state
- 116
Industry mix (Fortune 500 HQ in CA)
| Industry | F500 HQs | Revenue |
|---|---|---|
| Technology | 27 | $1,492B |
|
||
| Financial Services | 3 | $174B |
|
||
| Retail | 3 | $44B |
|
||
| Insurance | 3 | $26B |
|
||
| Media / Entertainment | 2 | $115B |
|
||
| Pharmaceuticals / Biotech | 2 | $62B |
|
||
Price history
+244.5% since first listed8 events — show timeline
- 2026-06-16 Listed $99,900 SAOR
- 2026-04-22 Price Changed $115,000 SAOR
- 2026-03-09 Price Changed $124,900 SAOR
- 2026-01-19 Listed $139,900 SAOR
- 2024-07-12 Sold (MLS) $138,500 SAOR
- 2024-06-14 Pending — SAOR
- 2024-04-01 Listed $149,900 SAOR
- 2017-10-20 Listed $29,000 SAOR
Cash-flow waterfall
monthlySold comps — $/sqft
last 12 mo · ≤1 miLoading sold comps…