215 Riverside Dr Unit 14 B · Campton, NH
Flood risk 5/10 · Moderate
- FEMA flood zone
- A
- Chance of flooding over 30 yrs
- 0.24%
- Est. flood insurance / yr
- $1,009 – $1,996
Fire risk 1/10 · Minimal
- Est. fire insurance / yr
- $507 – $941
Heat risk 3/10 · Minor
- Hot days now (above 90°F)
- 7 days/yr
- Hot days in 30 yrs
- 16 days/yr
Wind risk 3/10 · Minor
- Chance of severe wind over 30 yrs
- 5.0%
Air-quality risk 1/10 · Minimal
- Unhealthy air days now
- 0 days/yr
- Unhealthy air days in 30 yrs
- 0 days/yr
Risk factors via First Street. Map © Google.
Why this score? — see what drove the C- grade
The composite is a weighted blend of 9 inputs, each scored 0–100. Each bar is that input's sub-score; the figure is the points it added to the 100-point composite (weight × sub-score).
- Cash flow +15.0/30.0
- Appreciation +10.0/10.0
- ARV discount +7.5/15.0
- 1% rule +5.0/10.0
- DSCR +5.0/10.0
- Schools +5.0/10.0
- Rent growth +2.5/5.0
- Livability +2.5/5.0
- Condition / age +2.2/5.0
$34,900
🖨 Deal sheet 📄 Offer letter ✓ Due diligence
Listing remarks
This 3 bed 2 bath home is two minutes to I 93, and close to Waterville Valley and many recreation areas. Dogs and cats are allowed! With a brand-new roof and updated kitchen mostly completed, you can add your own finishing touches and build instant equity. An entry room welcomes you and provides storage as well. The sale includes a shed, with a partially new roof. For gardening enthusiasts, there are large metal planters and an open, sunny yard. The lots in that part of the park are larger than typical. The location is very convenient for skiers, outdoor enthusiasts, and anyone wanting to be close to I 93 for commuting. ATV trails are connected to the park. Just outside the park entrance i
Key facts
- Built 1972
- Listed 17 days
Property features AI
Finance
- Other: Lot number: 14
- HOA & community: Monthly association fee; HOA fee covers plowing, sewer, trash and water; Association provides snow removal and trash removal
Exterior
- Parking: Paved driveway
- Utilities: Private water supply; Private sewer; Circuit breaker electrical service (NHEC); Dead River fuel service; Cable available on site; High-speed internet available
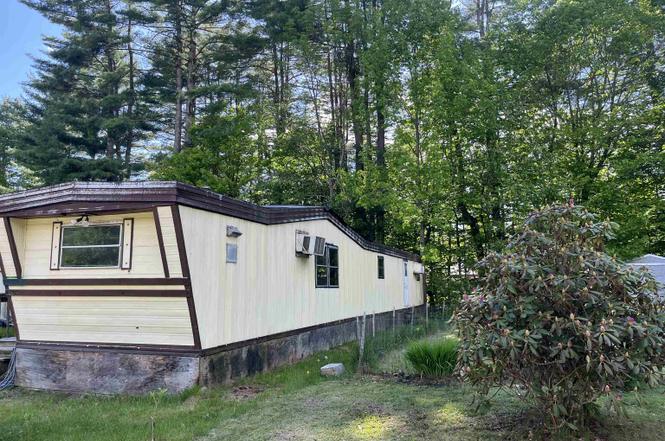
- Home design: Manufactured/mobile home; Pale yellow exterior; Shingle (asphalt) roof; Unit/Lot: 14 B
- Construction: Aluminum siding; Built in 1972; Existing structure
- Exterior features: Leased lot; Near shopping; Near skiing; Near schools; Privately maintained road frontage; Paved driveway
Interior
- Kitchen: Dishwasher; Electric range; Refrigerator
- Flooring: Vinyl
- Bathrooms: One full bathroom; One 3/4 bathroom
- Heating & cooling: Forced air heating; Wall AC units
- Interior features: Seven total rooms; Vinyl flooring
- Laundry & utility: Electric water heater
Neighborhood map
What this means for you Summary
Snapshot
- This is a 3-bed/2.0-bath single-family listed at $35k. Condition is rated fair.
Deal economics
- At list price, monthly cash flow is $194 ($2k/yr) — positive.
- The deal already cash-flows at list — no discount required.
- Meets the 1% rule at list price ($1k rent vs $35k).
- Recommended offer: $34k (1.5% below list) — sets the bar for market timing.
Location & tenants
- Location reads: area grade C — affects rentability + tenant quality, not the cash-flow math above.
- Pemi-Baker Regional School District (rural): math 45% / reading 70% proficiency, ranked #77 of 171 in NH (top 45%) — acceptable for families but not a draw, mixed tenant base, ~2y average lease.
- Market conditions: 67 active listings in the ZIP; 487 units permitted in Grafton County in 2024 (127 in 5+ unit buildings).
Forward outlook
- In year one you build about $4k of equity ($241 loan paydown + $3k appreciation (10.0% local appreciation)).
- Grafton County population projected at -13% by 2050 — secular population decline; favor cash flow + early exit over multi-decade hold.
- At projected returns (10.0% appreciation + 3.0% rent growth), your $10k cash investment doubles in ~2 years — after that, you're playing with house money.
- By year 8, paydown + projected appreciation supports a ~$32k cash-out refi (75% LTV) — recoverable capital for the next deal without selling this one.
Negotiation context
- It's been on market 17 days — a 2% lower offer ($34k) is reasonable based on typical stale-listing flexibility.
Risks & watch-outs
- Watch-outs: flood insurance adds $125/mo; HOA is 41% of rent.
- Climate carrying-cost: in FEMA flood zone A (mandatory federal flood insurance) — expect insurance premiums to compound above CPI over the hold.
Questions for the listing agent
- Have any recent inspections been done? Can we get a copy of the seller's disclosures and any deferred-maintenance estimates?
- Built in 1972 — when were the roof, HVAC, electrical panel, plumbing, and water heater last replaced?
- What's the actual annual flood-insurance premium (NFIP or private), and is the property in a SFHA with mandatory coverage?
- What does the HOA fee cover, when was the last increase, and are there any pending special assessments or reserve-fund shortfalls?
- Is there a deadline driving the sale (1031 exchange, divorce, estate, relocation)? That informs how much negotiation room exists.
- What's the average days-on-market for RENTAL listings here right now (not sales)? A rising rental-DOM trend means longer vacancies and softer asking-rent achievability than the comps imply.
- What's the recent tenant-quality profile in this submarket — average credit score on applications, eviction rate, late-payment / NSF rate, and stable-employment percentage? A property-management company in the area should have these aggregated.
- How much new for-sale + rental construction is in the pipeline within 1–3 miles? Heavy new supply typically softens prices + rents 12–24 months out; constrained supply supports both.
Investment metrics
- 1% rule
- 4.17% ✓
- Cap rate
- 17.25%
- Cash-on-cash
- 39.15%
- DSCR
- 2.74
- GRM
- 2.0
CMA / ARV
No comps found within radius.
Projected returns pro-forma
10.0% appreciation · 3.0% rent growth · sell at horizon
- IRR
- 42.6%
- Equity multiple
- 4.25×
- Total profit
- $31,798
- Equity at exit
- $31,441
- IRR
- 37.1%
- Equity multiple
- 9.68×
- Total profit
- $84,861
- Equity at exit
- $67,803
Cash invested: $9,772 (down + closing). Projections, not guarantees.
Landlord ↔ Tenant lean methodology
- Overall (STATE)
- 56 Moderately Landlord-Leaning
- State New Hampshire
- 56 Moderately Landlord-Leaning · D+1
- County
- — inherits STATE
- City
- — inherits STATE
ZIP-level market 03223
- Home prices YoY
- 20.4%
- Active inventory
- 67
- Price-to-rent
- 2.0×
Monthly cashflow live
- Estimated rent
- $1,456 medium interval (Pro) →
- Mortgage (P&I)
- −$183
- Tax est. 1.5%
- −$44 /mo · $524/yr
- Insurance
- −$15
- Flood insurance flood zone
- −$125 /mo · $1,502/yr
- HOA
- −$590
- Vacancy / Maint / Mgmt
- −$306
- Net cashflow
- $194
Break-even live
UW: 25.0% down · 7.5% · 30yr · 1.5% tax · 5.0% vac · 8.0% maint · 8.0% mgmt
Financing live
Cash to close
- Down payment
- $8,725
- Closing costs
- $1,047
- Reserves months
- —
- Total cash needed
- —
Loan-product check · same deal, 3 products live
Conventional
25% down · 7.5% · 30yr
- Down + closing
- —
- Monthly P&I
- —
- Monthly cashflow
- —
- DSCR
- —
- Eligible?
- —
Personal DTI + credit; lowest rate.
DSCR
20% down · 8.5% · 30yr
- Down + closing
- —
- Monthly P&I
- —
- Monthly cashflow
- —
- DSCR
- —
- Eligible?
- —
No personal income docs; deal must DSCR.
Hard money
10% down · 12.0% · 12mo
- Down + closing
- —
- Monthly P&I
- —
- Monthly cashflow
- —
- DSCR
- —
- Eligible?
- —
Short-term bridge; refi at stabilization.
HOA detail
- Monthly dues
- $590 · $7,080/yr
- Likely covers
- water
Listing history 15 events
-
2026-06-18days on market $34,900 Active 17 DOM
-
2026-06-17days on market $34,900 Active 16 DOM
-
2026-06-16days on market $34,900 Active 15 DOM
-
2026-06-16price $34,900 Active 14 DOM
-
2026-06-15days on market $39,900 Active 14 DOM
-
2026-06-13days on market $39,900 Active 12 DOM
-
2026-06-12pricedays on market $39,900 Active 11 DOM
-
2026-06-09days on market $42,900 Active 8 DOM
-
2026-06-08days on market $42,900 Active 7 DOM
-
2026-06-07days on market $42,900 Active 6 DOM
-
2026-06-07days on market $42,900 Active 5 DOM
-
2026-06-04days on market $42,900 Active 2 DOM
-
2026-06-01statusdays on market $42,900 Active 1 DOM
-
2026-05-31days on market $42,900 Coming Soon 3 DOM
-
2026-05-29historical $42,900
ⓘ Source: listings_history table (triggers on properties + properties_extension) + one-shot
backfill from property_details.listing_events for pre-trigger history.
Climate risk First Street
- Flood 5/10 Major FEMA zone A · 24% chance over 30 yrs
- Wildfire 1/10 Low
- Heat 3/10 Moderate 7 d/yr ≥90°F today · 16 d/yr by 30 yrs out
- Wind 3/10 Moderate 5% chance of damaging wind over 30 yrs
- Air quality 1/10 Low 0 unhealthy d/yr today · 0 by 30 yrs out
Nearby sold comps map
Loading sold comps map…
Walkable amenities ~0.75 mi
Loading nearby amenities…
Taxation est. · year 1
- Rental income
- $17,468
- − Mortgage interest
- −$1,955
- − Property taxes
- −$524
- − Insurance
- −$1,677
- − Repairs & maintenance
- −$1,397
- − Management
- −$1,397
- − HOA
- −$7,080
- − Depreciation
- −$1,015
- Taxable income
- $2,422
- Est. tax owed @ 24.0%
- −$581
- After-tax cash flow
- $1,741/yr
For passive investors: Depreciation is non-cash, so a rental often shows a tax loss while cash-flowing — sheltering income. Rental losses are passive: they offset passive income freely, and up to $25,000/yr can offset ordinary (W-2) income if you actively participate and your MAGI is under $100k (phasing out to $0 by $150k); unused losses carry forward. On sale, claimed depreciation is recaptured at up to 25%, and gains may owe capital-gains tax (a 1031 exchange can defer both). Figures are a year-1 estimate at your 24.0% rate — not tax advice; consult a CPA.
Condition & rehab AI · 13 photos
This home requires moderate repairs and updates to its bathrooms, but has a good roof and new kitchen. The exterior could benefit from painting to enhance curb appeal.
Repairs flagged
- Major bathroom walls — paint peeling
- Major bathroom flooring — visible wear
- Major bathroom windows — potential leaks
Value-add opportunities
- Both paint exterior — enhances curb appeal and value
- Both replace bathroom flooring — improves functionality and aesthetics
- Both repair bathroom walls — prevents further damage and improves appearance
Renovation cost estimate screening
| Repair item | Severity | Est. cost |
|---|---|---|
| bathroom walls · paint peeling | Major | $15,000–50,000 |
| bathroom flooring · visible wear | Major | $15,000–50,000 |
| bathroom windows · potential leaks | Major | $15,000–50,000 |
| Total estimated repair cost · 3 items | $45,000–150,000 |
Value-add ROI direction
- Both paint exterior — enhances curb appeal and value ↑
- Both replace bathroom flooring — improves functionality and aesthetics ↑
- Both repair bathroom walls — prevents further damage and improves appearance ↑
ⓘ Cost ranges are severity-bucket heuristics (US national rule-of-thumb). Get contractor quotes + a written scope before underwriting a rehab budget.
Schools (NCES district)
- District
- Pemi-Baker Regional School District
- NCES district ID
- 3399965
- Math proficiency
- 45% ▲ 10.00%
- Reading proficiency
- 70% ▲ 15.00%
- Median HH income
- $42,275
- Composite
- 49.93/100
- National rank
- #4161
- State rank
- #77 of 171 in NH
Livability — Campton
No livability data for this city. (Only ~50 U.S. cities are tracked.)
Census & demographics
- Population (ZIP)
- 3,398
Population outlook (Grafton County) Hauer SSP2
- Today (2025)
- 88,798 people
- By 2030
- 87,131 · -1.9%
- By 2040
- 82,000 · -7.7%
- By 2050
- 77,064 · -13.2%
- By 2075
- 68,769 · -22.6%
- By 2100
- 61,631 · -30.6%
Race, ethnicity, and origin ACS 2023
- Neighborhood character
- Predominantly White (92%)
- Race & ethnicity
- White 92% Black 6%
- Common ancestry
- Lithuanian 14% Slovak 10% Romanian 10%
- Foreign-born
- 8% · Canada
- Languages at home
- 93% English-only · French/Haitian/Cajun 7%
Political lean MEDSL · Grafton
- 2024 margin
- D (+19.9) · D 59.4% · R 39.4% · Other 1.2%
- 2008→2024 swing
- -7.8pp toward R · 2008: 27.7pp · 2024: 19.9pp
- All cycles
- 2024: D+19.9 2020: D+24.6 2016: D+19.0 2012: D+23.8 2008: D+27.7
Not yet ingested
- Civics
- —
Market trends
- HPI YoY
- ▲ 77.21%
- Current HPI
- 455.3118
- Rent YoY
- —
- Metro
- —
- State GDP YoY
- —
- F500 in state
- 0
Price history
1 event — show timeline
- 2026-05-29 Coming Soon $42,900 PrimeMLS
Cash-flow waterfall
monthlySold comps — $/sqft
last 12 mo · ≤1 miLoading sold comps…