57 Oakmont St · Prescott, AZ
Flood risk 9/10 · Severe
- FEMA flood zone
- X (unshaded)
- Chance of flooding over 30 yrs
- 0.99%
- Est. flood insurance / yr
- $507 – $1,088
Fire risk 5/10 · Moderate
- Est. fire insurance / yr
- $610 – $1,132
Heat risk 3/10 · Minor
- Hot days now (above 91°F)
- 8 days/yr
- Hot days in 30 yrs
- 22 days/yr
Wind risk 1/10 · Minimal
- Chance of severe wind over 30 yrs
- —
Air-quality risk 1/10 · Minimal
- Unhealthy air days now
- 0 days/yr
- Unhealthy air days in 30 yrs
- 0 days/yr
Risk factors via First Street. Map © Google.
Why this score? — see what drove the B grade
The composite is a weighted blend of 9 inputs, each scored 0–100. Each bar is that input's sub-score; the figure is the points it added to the 100-point composite (weight × sub-score).
- Cash flow +30.0/30.0
- 1% rule +10.0/10.0
- DSCR +10.0/10.0
- ARV discount +7.5/15.0
- Condition / age +4.0/5.0
- Livability +3.7/5.0
- Schools +3.3/10.0
- Rent growth +2.8/5.0
- Appreciation +0.0/10.0
$89,700
🖨 Deal sheet (PDF) 📄 Offer letter ✓ Due diligence
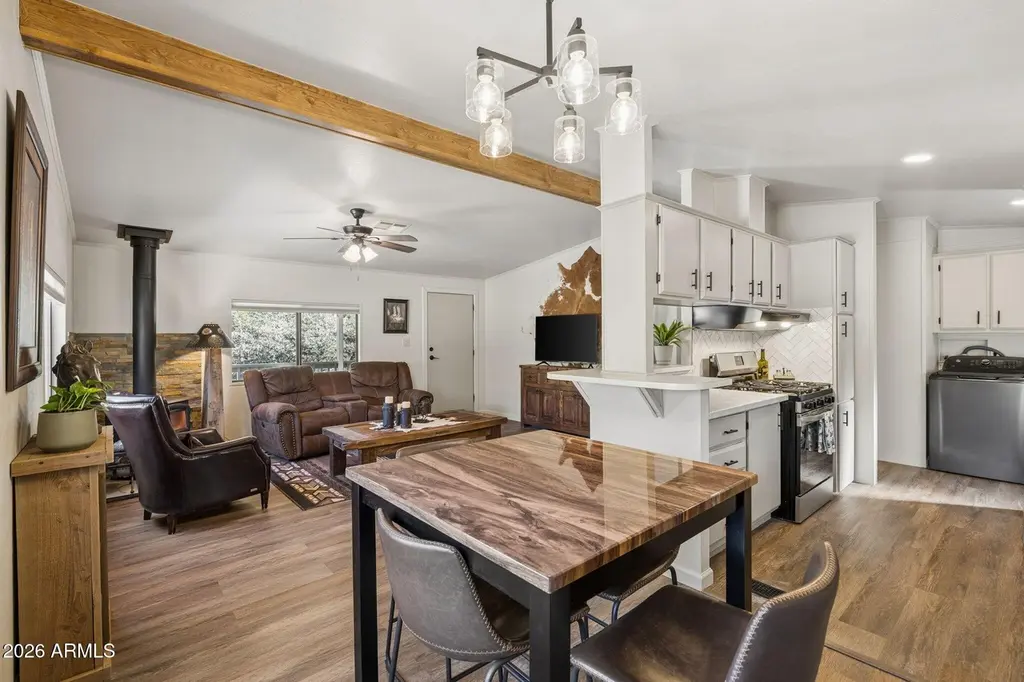
Listing remarks
PRICED TO SELL! Fully Remodeled Prescott Retreat | Luxury Vinyl Flooring | Updated Kitchen | Stainless Steel Appliances | Slate Fireplace Wall | Walk In Tile Shower | Covered Parking | Prescott National Forest Access Spectacular fully remodeled hidden gem nestled among towering ponderosa pines in the highly desirable Pine Lakes 55+ community, offering modern finishes, extensive upgrades, and peaceful forest living just minutes from historic downtown Prescott. This move in ready home features professionally retextured walls and ceilings, fresh Sherwin Williams premium paint, luxury vinyl flooring throughout, updated lighting, new baseboards, new door hardware, and a bright modern interior r
Key facts
- Fully remodeled
- Covered parking
- Slate fireplace wall
Tags
Property features AI
Finance
- HOA & community: Land lease community — monthly land lease payment of $1,198; Association fee includes: other (see remarks); Community amenities include pool, community heated spa, tennis courts, pickleball courts, lake, fitness center, and biking/walking paths
Exterior
- Parking: 1 covered parking space; 1 open parking space; 1 carport space
- Utilities: City water; Public sewer (connected)
- Home design: Manufactured/mobile home; Fee simple ownership; Asphalt road surface
- Construction: Wood siding and wood frame construction; Painted exterior; Composition roof; Building area per builder
- Exterior features: Gravel/stone front; City and private maintained road access
Interior
- Kitchen: Laminate counters; Refrigerator; Dishwasher; Disposal
- Bedrooms: 2 possible bedrooms
- Flooring: Vinyl
- Bathrooms: 2 full bathrooms
- Heating & cooling: Has heating; Evaporative cooling
- Interior features: High-speed internet available; Vaulted ceilings; 3/4 bath in primary bedroom; Accessible approach with ramp; Fireplace in family room; Storage
- Laundry & utility: Laundry inside
Neighborhood map
What this means for you Summary
Snapshot
- This is a 2-bed/2.0-bath single-family listed at $90k. Condition is rated good.
Deal economics
- At list price, monthly cash flow is $639 ($8k/yr) — positive.
- The deal already cash-flows at list — no discount required.
- Meets the 1% rule at list price ($2k rent vs $90k).
- Recommended offer: $88k (1.5% below list) — sets the bar for market timing.
- Cap rate 15.7% vs local median 2.4% in Prescott — top-decile yield for the area; either an underpriced asset or a hidden risk that comps aren't pricing in. Stress-test before assuming the spread holds.
Location & tenants
- Location reads 73/100 on livability (#22 in AZ) — a middle-class / working-renter tenant base. Strengths: health & safety A+, amenities A, schools A-; Watch: cost of living D, commute F.
- Prescott Unified District (4466) (urban): math 34% / reading 44% proficiency, ranked #70 of 249 in AZ (top 28%) — families likely to look elsewhere, expect single-tenant / working-renter base with shorter leases.
- Market conditions: Rents rising (+1.0%/yr); 707 active listings in the ZIP; solid renter incomes; 2,062 units permitted in Yavapai County in 2024 (98 in 5+ unit buildings).
Forward outlook
- Local home prices are declining (-3.0%/yr); year-one equity from $620 of loan paydown is wiped out by about $3k of value loss. Plan a longer hold.
- Yavapai County population projected at +10% by 2050 — modest demand growth; plan on rents tracking national, not racing it.
- At projected returns (-3.0% appreciation + 1.0% rent growth), your $25k cash investment doubles in ~5 years — after that, you're playing with house money.
Negotiation context
- It's been on market 23 days — a 2% lower offer ($88k) is reasonable based on typical stale-listing flexibility.
- 2 sale attempts; this cycle's ask has dropped $5k (5%) from the opening price — seller is motivated, your offer sets the floor, not the list.
Risks & watch-outs
- Watch-outs: flood insurance adds $66/mo.
- Climate carrying-cost: severe flood risk; moderate wildfire risk — expect insurance premiums to compound above CPI over the hold.
Questions for the listing agent
- What's the actual annual flood-insurance premium (NFIP or private), and is the property in a SFHA with mandatory coverage?
- Is there a deadline driving the sale (1031 exchange, divorce, estate, relocation)? That informs how much negotiation room exists.
- Schools are A-rated — typically a magnet for longer-tenancy family renters. What's the average tenant stay here, and is there a school-zone premium baked into asking?
- What's the average days-on-market for RENTAL listings here right now (not sales)? A rising rental-DOM trend means longer vacancies and softer asking-rent achievability than the comps imply.
- What's the recent tenant-quality profile in this submarket — average credit score on applications, eviction rate, late-payment / NSF rate, and stable-employment percentage? A property-management company in the area should have these aggregated.
- How much new for-sale + rental construction is in the pipeline within 1–3 miles? Heavy new supply typically softens prices + rents 12–24 months out; constrained supply supports both.
Investment metrics
- 1% rule
- 1.87% ✓
- Cap rate
- 15.73%
- Cash-on-cash
- 33.70%
- DSCR
- 2.50
- GRM
- 4.5
CMA / ARV
- ARV (median comp)
- $487,774
- List price
- $89,700
- Delta
- -78.49%
- Verdict
- UNDERPRICED
- Comps
- 7 within 1.0 mi
Show comp detail 1 sale within ~0.75 mi
| Address | Dist | Beds/Ba | Sqft | Sold | Price | $/sf | Match |
|---|---|---|---|---|---|---|---|
| 1746 Timberlane | 0.52mi | 2/2.0 | 1,208 (+14%) | 1mo | $499,000 | $413 | 51 |
Match score weights: distance 35% · size 25% · config 20% · recency 20%. Top-matched comps best support the ARV.
Projected returns pro-forma
-3.0% appreciation · 1.01% rent growth · sell at horizon
- IRR
- 22.9%
- Equity multiple
- 1.91×
- Total profit
- $22,931
- Equity at exit
- $13,375
- IRR
- 29.5%
- Equity multiple
- 3.38×
- Total profit
- $59,651
- Equity at exit
- $7,756
Cash invested: $25,116 (down + closing). Projections, not guarantees.
Landlord ↔ Tenant lean methodology
- Overall (STATE)
- 87 Strongly Landlord-Friendly
- State Arizona
- 87 Strongly Landlord-Friendly · R+3
- County
- — inherits STATE
- City
- — inherits STATE
ZIP-level market 86305
- Home prices YoY
- -18.7%
- Rents YoY
- 1.0%
- Active inventory
- 707
- Price-to-rent
- 4.5×
Monthly cashflow live
- Estimated rent
- $1,678 medium interval (Pro) →
- Mortgage (P&I)
- −$470
- Tax est. 1.5%
- −$112 /mo · $1,346/yr
- Insurance
- −$37
- Flood insurance flood zone
- −$66 /mo · $798/yr
- HOA
- −$0
- Vacancy / Maint / Mgmt
- −$352
- Net cashflow
- $639
Break-even live
Sensitivity live
| Price | -10% $701 | -5% $670 | +0% $639 | +5% $608 | +10% $577 |
|---|---|---|---|---|---|
| Rent | -10% $506 | -5% $573 | +0% $639 | +5% $705 | +10% $771 |
| Rate | -1.0pp $684 | -0.5pp $662 | base $639 | +0.5pp $616 | +1.0pp $592 |
UW: 25.0% down · 7.5% · 30yr · 1.5% tax · 5.0% vac · 8.0% maint · 8.0% mgmt
Financing live
Cash to close
- Down payment
- $22,425
- Closing costs
- $2,691
- Reserves months
- —
- Total cash needed
- —
Loan-product check · same deal, 3 products live
Conventional
25% down · 7.5% · 30yr
- Down + closing
- —
- Monthly P&I
- —
- Monthly cashflow
- —
- DSCR
- —
- Eligible?
- —
Personal DTI + credit; lowest rate.
DSCR
20% down · 8.5% · 30yr
- Down + closing
- —
- Monthly P&I
- —
- Monthly cashflow
- —
- DSCR
- —
- Eligible?
- —
No personal income docs; deal must DSCR.
Hard money
10% down · 12.0% · 12mo
- Down + closing
- —
- Monthly P&I
- —
- Monthly cashflow
- —
- DSCR
- —
- Eligible?
- —
Short-term bridge; refi at stabilization.
Listing history 17 events
-
2026-06-18days on market $89,700 Active 23 DOM
-
2026-06-17days on market $89,700 Active 22 DOM
-
2026-06-16days on market $89,700 Active 21 DOM
-
2026-06-15days on market $89,700 Active 20 DOM
-
2026-06-14days on market $89,700 Active 18 DOM
-
2026-06-13days on market $89,700 Active 17 DOM
-
2026-06-10days on market $89,700 Active 15 DOM
-
2026-06-09days on market $89,700 Active 14 DOM
-
2026-06-08days on market $89,700 Active 13 DOM
-
2026-06-07days on market $89,700 Active 12 DOM
-
2026-06-05pricedays on market $89,700 Active 9 DOM
-
2026-06-02days on market $94,700 Active 7 DOM
-
2026-06-01days on market $94,700 Active 6 DOM
-
2026-05-31days on market $94,700 Active 5 DOM
-
2026-05-30days on market $94,700 Active 4 DOM
-
2026-05-01historical
-
2026-03-30$104,900 Active
ⓘ Source: listings_history table (triggers on properties + properties_extension) + one-shot
backfill from property_details.listing_events for pre-trigger history.
Climate risk First Street
- Flood 9/10 Extreme FEMA zone X (unshaded) · 99% chance over 30 yrs
- Wildfire 5/10 Major
- Heat 3/10 Moderate 8 d/yr ≥91°F today · 22 d/yr by 30 yrs out
- Wind 1/10 Low
- Air quality 1/10 Low 0 unhealthy d/yr today · 0 by 30 yrs out
Nearby sold comps map
Loading sold comps map…
Walkable amenities ~0.75 mi
Loading nearby amenities…
Taxation est. · year 1
- Rental income
- $20,131
- − Mortgage interest
- −$5,025
- − Property taxes
- −$1,346
- − Insurance
- −$1,246
- − Repairs & maintenance
- −$1,610
- − Management
- −$1,610
- − Depreciation
- −$2,609
- Taxable income
- $6,684
- Est. tax owed @ 24.0%
- −$1,604
- After-tax cash flow
- $6,063/yr
For passive investors: Depreciation is non-cash, so a rental often shows a tax loss while cash-flowing — sheltering income. Rental losses are passive: they offset passive income freely, and up to $25,000/yr can offset ordinary (W-2) income if you actively participate and your MAGI is under $100k (phasing out to $0 by $150k); unused losses carry forward. On sale, claimed depreciation is recaptured at up to 25%, and gains may owe capital-gains tax (a 1031 exchange can defer both). Figures are a year-1 estimate at your 24.0% rate — not tax advice; consult a CPA.
Condition & rehab AI · 12 photos
This fully remodeled home in Prescott offers modern finishes and peaceful forest living. It is move-in ready with a good condition score and minimal repairs needed.
Value-add opportunities
- Resale Paint touch-ups — Fresh paint enhances curb appeal and interior aesthetics.
- Resale Replace light fixtures — Modern light fixtures improve the home's curb appeal and interior aesthetics.
- Both Landscaping improvements — Enhanced landscaping can increase both resale and rental value.
- Both Deck maintenance — A well-maintained deck can increase both resale and rental value.
- Both Replace flooring — Luxury vinyl flooring is durable and can increase both resale and rental value.
- Resale Replace kitchen appliances — Modern appliances can increase the home's appeal to potential buyers.
- Resale Replace bathroom fixtures — Modern fixtures can increase the home's appeal to potential buyers.
Renovation cost estimate screening
Value-add ROI direction
- Resale Paint touch-ups — Fresh paint enhances curb appeal and interior aesthetics. ↑
- Resale Replace light fixtures — Modern light fixtures improve the home's curb appeal and interior aesthetics. ↑
- Both Landscaping improvements — Enhanced landscaping can increase both resale and rental value. ↑
- Both Deck maintenance — A well-maintained deck can increase both resale and rental value. ↑
- Both Replace flooring — Luxury vinyl flooring is durable and can increase both resale and rental value. ↑
- Resale Replace kitchen appliances — Modern appliances can increase the home's appeal to potential buyers. ↑
- Resale Replace bathroom fixtures — Modern fixtures can increase the home's appeal to potential buyers. ↑
ⓘ Cost ranges are severity-bucket heuristics (US national rule-of-thumb). Get contractor quotes + a written scope before underwriting a rehab budget.
Schools (NCES district)
- District
- Prescott Unified District (4466)
- NCES district ID
- 0406730
- Math proficiency
- 34% ▼ -16.00%
- Reading proficiency
- 44% ▼ -13.00%
- Median HH income
- $48,354
- Composite
- 33.47/100
- National rank
- #5450
- State rank
- #70 of 249 in AZ
Livability — Prescott
- Score
- 73/100
- State rank
- #22
- US rank
- #5579
Category grades
Schools grade is shown separately in the Schools card above.
Census & demographics
- County
- Yavapai County · 190,406 people
- City population
- 66,312
- Metro
- Prescott Valley-Prescott, AZ
- Population (ZIP)
- 19,790
- Household income
- $80,436
- Rent vs Own
- Severe rent burden
- 380.0
Population outlook (Yavapai County) Hauer SSP2
- Today (2025)
- 241,389 people
- By 2030
- 249,523 · +3.4%
- By 2040
- 259,966 · +7.7%
- By 2050
- 264,736 · +9.7%
- By 2075
- 269,334 · +11.6%
- By 2100
- 256,505 · +6.3%
Race, ethnicity, and origin ACS 2023
- Neighborhood character
- Predominantly White (86%)
- Race & ethnicity
- White 86% Hispanic / Latino 8% Two or more races 6% Asian 1%
- Hispanic origin (detail)
- Mexican 5% Puerto Rican 2%
- Common ancestry
- Slovak 4% Italian 3% Lithuanian 3%
- Foreign-born
- 4% · Canada
- Languages at home
- 95% English-only · Spanish 3%
Political lean MEDSL · Yavapai
- 2024 margin
- Solid R (+33.9) · D 32.6% · R 66.5%
- 2008→2024 swing
- -9.5pp toward R · 2008: -24.4pp · 2024: -33.9pp
- All cycles
- 2024: R+33.9 2020: R+29.3 2016: R+31.4 2012: R+30.7 2008: R+24.4
Not yet ingested
- Civics
- —
Market trends
- HPI YoY
- ▼ -80.31%
- Current HPI
- 348.5199
- Rent YoY
- ▲ 1.01%
- Metro
- Prescott Valley-Prescott, AZ
- State GDP YoY
- ▲ 4.54%
- F500 in state
- 20
Industry mix (Fortune 500 HQ in AZ)
| Industry | F500 HQs | Revenue |
|---|---|---|
| Technology | 2 | $13B |
|
||
| Mining / Metals | 1 | $23B |
|
||
| Environmental Services | 1 | $16B |
|
||
| Metals / Steel | 1 | $14B |
|
||
| Technology Distribution | 1 | $9B |
|
||
| Homebuilding | 1 | $8B |
|
||
Price history
-14.5% since first listed4 events — show timeline
- 2026-06-04 Price Changed $89,700 ARMLS
- 2026-05-26 Listed $94,700 ARMLS
- 2026-05-01 Listing Removed — PAARMLS as Distributed by MLS Grid
- 2026-03-30 Listed $104,900 PAARMLS as Distributed by MLS Grid
Cash-flow waterfall
monthlySold comps — $/sqft
last 12 mo · ≤1 miLoading sold comps…