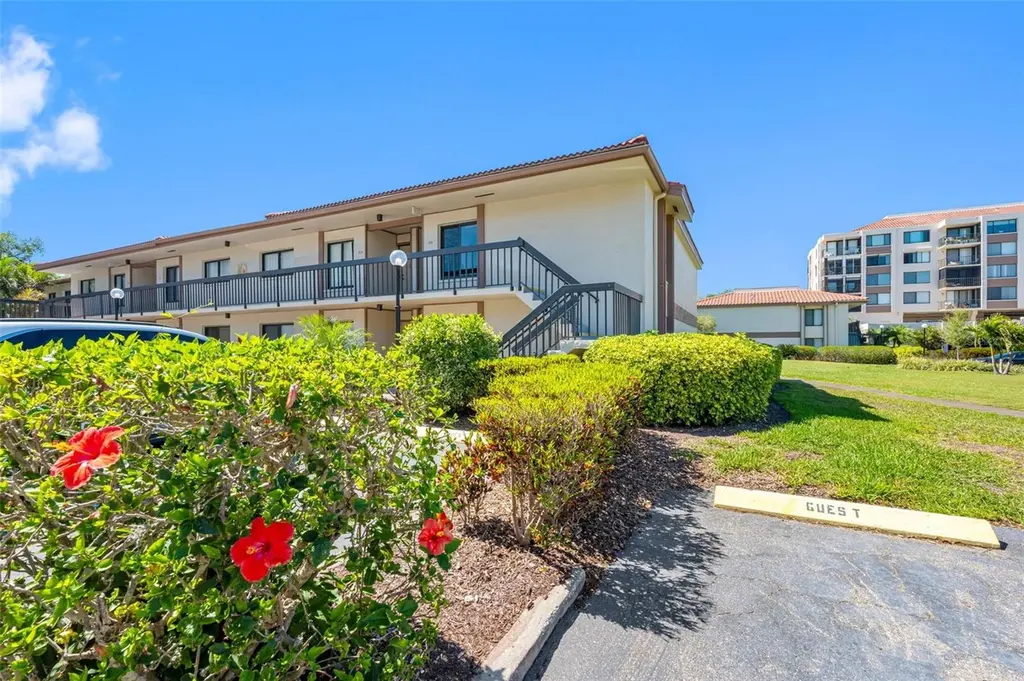
6269 Palma Del Mar Blvd S #216 · St. Petersburg, FL
Flood risk 9/10 · Severe
- FEMA flood zone
- AE
- Chance of flooding over 30 yrs
- 0.99%
- Est. flood insurance / yr
- $1,737 – $8,500
Fire risk 1/10 · Minimal
- Est. fire insurance / yr
- $947 – $1,759
Heat risk 10/10 · Severe
- Hot days now (above 106°F)
- 7 days/yr
- Hot days in 30 yrs
- 27 days/yr
Wind risk 10/10 · Severe
- Chance of severe wind over 30 yrs
- 99.0%
Air-quality risk 3/10 · Minor
- Unhealthy air days now
- 3 days/yr
- Unhealthy air days in 30 yrs
- 3 days/yr
Risk factors via First Street. Map © Google.
Why this score? — see what drove the C grade
The composite is a weighted blend of 9 inputs, each scored 0–100. Each bar is that input's sub-score; the figure is the points it added to the 100-point composite (weight × sub-score).
- Cash flow +17.7/30.0
- 1% rule +8.7/10.0
- ARV discount +7.5/15.0
- DSCR +5.5/10.0
- Appreciation +4.9/10.0
- Schools +4.3/10.0
- Rent growth +2.5/5.0
- Livability +2.5/5.0
- Condition / age +2.5/5.0
$210,000
🖨 Deal sheet (PDF) 📄 Offer letter ✓ Due diligence
Listing remarks
It’s time to live the island life in Palma Del Mar overlooking the Isla Del Sol Yacht & Country Club golf course. With peek of Boca Ciega bay. Palma is a beautiful resort-style community with heated pool & spa, a fishing pier, kayak and bike storage, recreation and fitness rooms. For days out, you can follow the biking trail to Fort Desoto stopping at several restaurants along the way. For a car ride enjoy easy interstate access to downtown St Peterburg and Tampa. Bountiful storage space with two exterior storage closets and a primary bedroom walk in. Unit 216 is a corner unit on the 2nd floor with no neighbors above and connects directly to your garage parking spot. The H
Key facts
- $797 HOA
- Garage
- Community pool
Property features AI
Finance
- Other: Furnished; Association fee required and collected monthly
- Financial info: Total annual HOA fees $9,564; Lease restrictions apply
- HOA & community: HOA (PBM) with monthly fee of $797; Condo fees include cable TV, internet, pool, fitness center, maintenance (structure & grounds), insurance, sewer, trash, common area taxes, escrow reserves fund; Association approval required; Condo land included; Pets allowed (max 30 lb); Community amenities: clubhouse, community mailbox, fitness center, golf, pool, sidewalks, reclaimed water irrigation, deed restrictions
Exterior
- Parking: Covered parking; Guest parking; Basement parking; 1-car garage
- Utilities: Public water; Public sewer; Cable connected; Electricity connected; Water connected; Sewer connected
- Home design: Condominium; Residential property; Two levels; Unit on 2nd floor; Faces south
- Construction: Block construction; Tile roof; Slab foundation; Built as part of PALMA DEL MAR III
- Exterior features: Balcony; Sliding doors; Storage; Private maintained asphalt road
Interior
- Kitchen: Range; Microwave; Refrigerator; Electric water heater
- Bedrooms: 2 bedrooms
- Flooring: Laminate
- Bathrooms: 2 full bathrooms
- Heating & cooling: Central heating (electric); Central air conditioning
- Interior features: Open floorplan; Living room/dining room combo; Balcony; Sliding doors; Storage
- Laundry & utility: Indoor laundry in a laundry closet
Neighborhood map
What this means for you Summary
Snapshot
- This is a 2-bed/2.0-bath condo listed at $210k.
Deal economics
- At list price, monthly cash flow is $-258 ($-3k/yr) — negative.
- To cash-flow at today's rent, offer at most $164k (21.7% below list).
- Meets the 1% rule at list price ($3k rent vs $210k).
- Recommended offer: $164k (21.7% below list) — sets the bar for cash-flow.
- Cap rate 7.3% vs local median 2.6% in St. Petersburg — top-decile yield for the area; either an underpriced asset or a hidden risk that comps aren't pricing in. Stress-test before assuming the spread holds.
Location & tenants
- Location reads: area grade C — affects rentability + tenant quality, not the cash-flow math above.
- Pinellas (suburban): math 51% / reading 51% proficiency, ranked #31 of 73 in FL (top 42%) — acceptable for families but not a draw, mixed tenant base, ~2y average lease.
- Zoned schools: Gulfport Montessori Elementary School (math 35% / reading 33%, grade F, #1,744 of 2,144 statewide, top 82%, 435 students, 86% FRL); Bay Point Middle School (math 38% / reading 38%, grade F, #388 of 571 statewide, top 69%, 770 students, 69% FRL); Lakewood High School (math 27% / reading 44%, grade F, #367 of 667 statewide, top 57%, 915 students, 59% FRL) — zoned schools average 71% FRL vs 48% district-wide (23 pts higher); higher-poverty schools than district average — tighter screening recommended.
- Zoned-school proficiency averages 36% at this address vs 51% district-wide (-15 pts) — the specific schools serving this property underperform the Pinellas average; the district grade overstates school quality for this exact location.
- Market conditions: 285 active listings in the ZIP; 40 comparable units currently listed for rent nearby; rentals at typical pace (median 26d on market — plan ~3-4 weeks tenant-placement turnaround); solid renter incomes; 2,676 units permitted in Pinellas County in 2024 (1,422 in 5+ unit buildings).
- This rent runs 34% of the median local income ($103k/yr) — at the standard rent-burdened threshold; future hikes will face affordability resistance.
Forward outlook
- In year one you build about $1k of equity ($1k loan paydown + $-325 appreciation (-0.1% local appreciation)).
- Pinellas County population projected at +14% by 2050 — modest demand growth; plan on rents tracking national, not racing it.
Negotiation context
- It's been on market 89 days — a 6% lower offer ($197k) is reasonable based on typical stale-listing flexibility.
- Current owner paid $70k; list at $210k implies a 200% gain — meaningful room to come down on a strong offer.
Risks & watch-outs
- Watch-outs: flood insurance adds $427/mo; HOA is 28% of rent.
- Climate carrying-cost: in FEMA flood zone AE (mandatory federal flood insurance); severe wind risk, 99% chance of damaging wind over 30y; extreme-heat days projected 7→27/yr by 2055 (HVAC capex compounding) — expect insurance premiums to compound above CPI over the hold.
Questions for the listing agent
- What do current leases actually rent for vs. the listed asking? Can we see a recent rent roll and the last 12 months of T-12 income?
- It's been on market 89 days. Have you received any prior offers? Is the seller open to a 22% concession, seller financing, or rate buy-down credit?
- What's the actual annual flood-insurance premium (NFIP or private), and is the property in a SFHA with mandatory coverage?
- What does the HOA fee cover, when was the last increase, and are there any pending special assessments or reserve-fund shortfalls?
- Any open or pending special assessments — roof, HVAC, plumbing, elevator, façade? What's the per-unit balance and payoff schedule, and is the seller paying it off at close or rolling it to the buyer?
- Why hasn't it sold? Are there any deal-killer items the seller is aware of (foundation, flood, title, zoning, code violations)?
- Is there a deadline driving the sale (1031 exchange, divorce, estate, relocation)? That informs how much negotiation room exists.
- What's the average days-on-market for RENTAL listings here right now (not sales)? A rising rental-DOM trend means longer vacancies and softer asking-rent achievability than the comps imply.
- What's the recent tenant-quality profile in this submarket — average credit score on applications, eviction rate, late-payment / NSF rate, and stable-employment percentage? A property-management company in the area should have these aggregated.
- How much new apartment / multifamily construction is in the pipeline within 1–3 miles? Heavy new supply (>2% of stock underway) typically softens rents 12–24 months out; light construction supports rent growth.
Investment metrics
- 1% rule
- 1.37% ✓
- Cap rate
- 7.25%
- Cash-on-cash
- 3.43%
- DSCR
- 1.15
- GRM
- 6.1
CMA / ARV
No comps found within radius.
Projected returns pro-forma
-0.15% appreciation · 3.0% rent growth · sell at horizon
- IRR
- -8.6%
- Equity multiple
- 0.60×
- Total profit
- $-23,422
- Equity at exit
- $59,356
- IRR
- -2.1%
- Equity multiple
- 0.78×
- Total profit
- $-12,880
- Equity at exit
- $70,068
Cash invested: $58,800 (down + closing). Projections, not guarantees.
Landlord ↔ Tenant lean methodology
- Overall (STATE)
- 87 Strongly Landlord-Friendly
- State Florida
- 87 Strongly Landlord-Friendly · R+3
- County
- — inherits STATE
- City
- — inherits STATE
ZIP-level market 33715
- Home prices YoY
- -0.1%
- Active inventory
- 285
- Price-to-rent
- 6.1×
Monthly cashflow live
- Estimated rent
- $2,877 high interval (Pro) →
- Mortgage (P&I)
- −$1,101
- Tax from tax record
- −$119 /mo · $1,424/yr
- Insurance
- −$88
- Flood insurance flood zone
- −$427 /mo · $5,118/yr
- HOA
- −$797
- Vacancy / Maint / Mgmt
- −$604
- Net cashflow
- $-258
Break-even live
Sensitivity live
| Price | -10% $-140 | -5% $-199 | +0% $-258 | +5% $-318 | +10% $-377 |
|---|---|---|---|---|---|
| Rent | -10% $-486 | -5% $-372 | +0% $-258 | +5% $-145 | +10% $-31 |
| Rate | -1.0pp $-153 | -0.5pp $-205 | base $-258 | +0.5pp $-313 | +1.0pp $-368 |
UW: 25.0% down · 7.5% · 30yr · 1.5% tax · 5.0% vac · 8.0% maint · 8.0% mgmt
Financing live
Cash to close
- Down payment
- $52,500
- Closing costs
- $6,300
- Reserves months
- —
- Total cash needed
- —
Loan-product check · same deal, 3 products live
Conventional
25% down · 7.5% · 30yr
- Down + closing
- —
- Monthly P&I
- —
- Monthly cashflow
- —
- DSCR
- —
- Eligible?
- —
Personal DTI + credit; lowest rate.
DSCR
20% down · 8.5% · 30yr
- Down + closing
- —
- Monthly P&I
- —
- Monthly cashflow
- —
- DSCR
- —
- Eligible?
- —
No personal income docs; deal must DSCR.
Hard money
10% down · 12.0% · 12mo
- Down + closing
- —
- Monthly P&I
- —
- Monthly cashflow
- —
- DSCR
- —
- Eligible?
- —
Short-term bridge; refi at stabilization.
Rent comps 40 comps
| Address | Beds | Baths | Sqft | Rent | $/sqft | DOM | Units | Dist |
|---|---|---|---|---|---|---|---|---|
| 6269 Palma del Mar Blvd S #501 Saint Petersburg, FL | 1.0 | 1.5 | 780 | $2,000 | $2.56 | 6d | 1 | 0.01mi |
| 6269 Palma del Mar Blvd S #308 Saint Petersburg, FL | 2.0 | 2.0 | 1050 | $2,495 | $2.38 | 6d | 1 | 0.01mi |
| 6269 Palma del Mar Blvd S #104 Saint Petersburg, FL | 2.0 | 2.0 | 890 | $2,500 | $2.81 | 6d | 1 | 0.01mi |
| 6269 Palma del Mar Blvd S #302 Saint Petersburg, FL | 2.0 | 2.0 | 1050 | $2,395 | $2.28 | 6d | 1 | 0.01mi |
| 6268 Palma del Mar Blvd S #102 Saint Petersburg, FL | 2.0 | 2.0 | 890 | $2,500 | $2.81 | 26d | 1 | 0.05mi |
| 6268 Palma del Mar Blvd S Saint Petersburg, FL | 2.0 | 2.0 | 1050 | $1,795 | $1.71 | 26d | 1 | 0.05mi |
| 6268 Palma del Mar Blvd S #306 Saint Petersburg, FL | 2.0 | 2.0 | 1050 | $2,750 | $2.62 | 26d | 1 | 0.05mi |
| 6268 Palma Del Mar Blvd S Unit 1546126P St. Petersburg, FL | 1.0 | 1.0 | 796 | $3,226 | $4.05 | 16d | 1 | 0.05mi |
| 6268 Palma del Mar Blvd S #111 Saint Petersburg, FL | 2.0 | 2.0 | 915 | $3,000 | $3.28 | 26d | 1 | 0.05mi |
| 6322 Palma del Mar Blvd S #216 Saint Petersburg, FL | 2.0 | 2.0 | 890 | $2,395 | $2.69 | 9d | 1 | 0.08mi |
| 6322 Palma del Mar Blvd S #216 Saint Petersburg, FL | 2.0 | 2.0 | 890 | $2,395 | $2.69 | 19d | 1 | 0.08mi |
| 6219 Palma del Mar Blvd S #105 Saint Petersburg, FL | 2.0 | 2.0 | 890 | $2,400 | $2.70 | 26d | 1 | 0.08mi |
| 6219 Palma del Mar Blvd S #305 Saint Petersburg, FL | 1.0 | 1.5 | 780 | $2,200 | $2.82 | 26d | 1 | 0.08mi |
| 6219 Palma del Mar Blvd S #112 Saint Petersburg, FL | 2.0 | 2.0 | 890 | $2,100 | $2.36 | 26d | 1 | 0.08mi |
| 6219 Palma del Mar Blvd S #210 Saint Petersburg, FL | 2.0 | 2.0 | 915 | $2,250 | $2.46 | 26d | 1 | 0.08mi |
| 6219 Palma del Mar Blvd S #206 Saint Petersburg, FL | 2.0 | 2.0 | 915 | $2,600 | $2.84 | 26d | 1 | 0.08mi |
| 6343 Palma del Mar Blvd S #228 Saint Petersburg, FL | 2.0 | 2.0 | 890 | $2,395 | $2.69 | 26d | 1 | 0.09mi |
| 6343 Palma del Mar Blvd S #226 Saint Petersburg, FL | 2.0 | 2.0 | 890 | $2,235 | $2.51 | 19d | 1 | 0.09mi |
| 6218 Palma del Mar Blvd S #405 St Petersburg, FL | 1.0 | 1.5 | 780 | $2,000 | $2.56 | 6d | 1 | 0.10mi |
| 6218 Palma Del Mar Blvd S Unit 1546234P St. Petersburg, FL | 2.0 | 2.0 | 882 | $3,590 | $4.07 | 16d | 1 | 0.10mi |
| 6218 Palma del Mar Blvd S #401 Saint Petersburg, FL | 1.0 | 1.5 | 780 | $3,810 | $4.88 | 26d | 1 | 0.10mi |
| 6218 Palma del Mar Blvd S #507 Saint Petersburg, FL | 1.0 | 1.5 | 780 | $3,360 | $4.31 | 26d | 1 | 0.10mi |
| 6372 Palma Del Mar Blvd S Unit 1545876P St. Petersburg, FL | 2.0 | 2.0 | 882 | $2,258 | $2.56 | 16d | 1 | 0.14mi |
| 6372 Palma Del Mar Blvd S Unit 1546269P St. Petersburg, FL | 1.0 | 1.0 | 721 | $2,581 | $3.58 | 16d | 1 | 0.14mi |
| 6382 Palma del Mar Blvd S #222 Saint Petersburg, FL | 2.0 | 2.0 | 890 | $2,200 | $2.47 | 26d | 1 | 0.14mi |
| 6121 Palma del Mar Blvd S #228 Saint Petersburg, FL | 2.0 | 2.0 | 980 | $2,500 | $2.55 | 6d | 1 | 0.15mi |
| 6158 Palma del Mar Blvd S #401 Saint Petersburg, FL | 1.0 | 1.5 | 780 | $2,200 | $2.82 | 26d | 1 | 0.18mi |
| 6158 Palma del Mar Blvd S #205 Saint Petersburg, FL | 2.0 | 2.0 | 890 | $2,400 | $2.70 | 26d | 1 | 0.18mi |
| 6365 Bahia del Mar Blvd St Petersburg, FL | 1.0–2.0 | 1.5–2.0 | 827 | $2,500 | $3.02 | 19d | 3 | 0.22mi |
| 6059 Bahia del Mar Blvd #241 Saint Petersburg, FL | 2.0 | 2.0 | 1070 | $5,170 | $4.83 | 19d | 1 | 0.23mi |
| 6361 Bahia del Mar Blvd St Petersburg, FL | 1.0–2.0 | 1.5–2.0 | 835 | $5,800 | $6.95 | 5d | 3 | 0.25mi |
| 6104 Palma del Mar Blvd S #604 St Petersburg, FL | 2.0 | 2.0 | 1050 | $4,500 | $4.29 | 6d | 1 | 0.25mi |
| 6077 Bahia del Mar Blvd St Petersburg, FL | 2.0 | 2.0 | 1107 | $2,198 | $1.98 | 14d | 2 | 0.25mi |
| 6357 Bahia del Mar Blvd St Petersburg, FL | 1.0–2.0 | 1.5–2.0 | 915 | $7,000 | $7.65 | 26d | 2 | 0.29mi |
| 6151 Bahia del Mar Blvd St Petersburg, FL | 2.0 | 2.0 | 1107 | $4,540 | $4.10 | 26d | 3 | 0.32mi |
| 6281 Bahia del Mar Blvd #208 Saint Petersburg, FL | 2.0 | 2.0 | 890 | $2,100 | $2.36 | 26d | 1 | 0.32mi |
| 6294 Bahia del Mar Cir St Petersburg, FL | 2.0 | 2.0 | 945 | $4,142 | $4.38 | 26d | 3 | 0.34mi |
| 6295 Bahia del Mar Cir St Petersburg, FL | 1.0–2.0 | 1.0–2.0 | 915 | $7,110 | $7.77 | 26d | 6 | 0.34mi |
| 6273 Bahia del Mar Blvd #216 Saint Petersburg, FL | 2.0 | 2.0 | 915 | $5,700 | $6.23 | 26d | 1 | 0.35mi |
| 6191 Bahia del Mar Blvd #205 Saint Petersburg, FL | 2.0 | 2.0 | 1070 | $3,400 | $3.18 | 26d | 1 | 0.42mi |
HOA detail condo
- Monthly dues
- $797 · $9,564/yr
- Likely covers
- pool
- Assessments
- None detected in remarks — confirm with the listing agent.
Listing history 19 events
-
2026-06-22days on market $210,000 Active 89 DOM
-
2026-06-18days on market $210,000 Active 86 DOM
-
2026-06-17days on market $210,000 Active 85 DOM
-
2026-06-16days on market $210,000 Active 84 DOM
-
2026-06-15price $210,000 Active 83 DOM
-
2026-06-15days on market $249,000 Active 83 DOM
-
2026-06-13days on market $249,000 Active 81 DOM
-
2026-06-09days on market $249,000 Active 77 DOM
-
2026-06-08days on market $249,000 Active 76 DOM
-
2026-06-07days on market $249,000 Active 75 DOM
-
2026-06-04days on market $249,000 Active 72 DOM
-
2026-06-03days on market $249,000 Active 71 DOM
-
2026-06-01days on market $249,000 Active 69 DOM
-
2026-05-31days on market $249,000 Active 68 DOM
-
2026-05-13price $249,000
-
2026-04-21price $259,000
-
2026-03-24$279,000 Active
-
1996-10-07soldstatus $70,000
-
1981-03-01soldstatus $70,900
ⓘ Source: listings_history table (triggers on properties + properties_extension) + one-shot
backfill from property_details.listing_events for pre-trigger history.
Tax reassessment forecast FL · Resets to sale price
- Current annual tax
- $1,424 · $119/mo
- Projected year-2 tax
- $1,743 · $145/mo
- Expected delta
- +$319/yr (+$27/mo · 22.4%)
ⓘ Screening estimate from a state-policy table — verify with the county assessor before closing.
Climate risk First Street
- Flood 9/10 Extreme FEMA zone AE · 99% chance over 30 yrs
- Wildfire 1/10 Low
- Heat 10/10 Extreme 7 d/yr ≥106°F today · 27 d/yr by 30 yrs out
- Wind 10/10 Extreme 99% chance of damaging wind over 30 yrs
- Air quality 3/10 Moderate 3 unhealthy d/yr today · 3 by 30 yrs out
Nearby sold comps map
Loading sold comps map…
Walkable amenities ~0.75 mi
Loading nearby amenities…
Taxation est. · year 1
- Rental income
- $34,519
- − Mortgage interest
- −$11,763
- − Property taxes
- −$1,424
- − Insurance
- −$6,169
- − Repairs & maintenance
- −$2,762
- − Management
- −$2,762
- − HOA
- −$9,564
- − Depreciation
- −$6,109
- Taxable loss
- −$6,033
- Est. tax savings @ 24.0%
- +$1,448
- After-tax cash flow
- $-1,654/yr
For passive investors: Depreciation is non-cash, so a rental often shows a tax loss while cash-flowing — sheltering income. Rental losses are passive: they offset passive income freely, and up to $25,000/yr can offset ordinary (W-2) income if you actively participate and your MAGI is under $100k (phasing out to $0 by $150k); unused losses carry forward. On sale, claimed depreciation is recaptured at up to 25%, and gains may owe capital-gains tax (a 1031 exchange can defer both). Figures are a year-1 estimate at your 24.0% rate — not tax advice; consult a CPA.
Schools (NCES district)
- District
- Pinellas
- NCES district ID
- 1201560
- Math proficiency
- 51% ▼ -5.00%
- Reading proficiency
- 51% ▼ -3.00%
- Median HH income
- $46,270
- Composite
- 43.27/100
- National rank
- #3046
- State rank
- #31 of 73 in FL
Livability — St. Petersburg
No livability data for this city. (Only ~50 U.S. cities are tracked.)
Census & demographics
- Census place
- St. Petersburg, FL
- County
- Pinellas County · 939,478 people
- City population
- 249,151
- Metro
- Tampa-St. Petersburg-Clearwater, FL
- Population (ZIP)
- 8,032
- Household income
- $102,782
- Rent vs Own
- Severe rent burden
- 106.0
Population outlook (Pinellas County) Hauer SSP2
- Today (2025)
- 1,027,532 people
- By 2030
- 1,063,586 · +3.5%
- By 2040
- 1,125,020 · +9.5%
- By 2050
- 1,168,637 · +13.7%
- By 2075
- 1,265,188 · +23.1%
- By 2100
- 1,260,357 · +22.7%
Race, ethnicity, and origin ACS 2023
- Neighborhood character
- Predominantly White (89%)
- Race & ethnicity
- White 89% Two or more races 5% Hispanic / Latino 5% Asian 2%
- Hispanic origin (detail)
- Puerto Rican 2%
- Common ancestry
- Romanian 6% Hungarian 3% Lithuanian 3%
- Foreign-born
- 11% · Canada, China
- Languages at home
- 88% English-only · Spanish 5% Russian/Polish/Slavic 2% Arabic 1%
Political lean MEDSL · Pinellas
- 2024 margin
- Lean R (+5.2) · D 46.9% · R 52.1%
- 2008→2024 swing
- -13.5pp toward R · 2008: 8.3pp · 2024: -5.2pp
- All cycles
- 2024: R+5.2 2020: D+0.2 2016: R+1.1 2012: D+5.6 2008: D+8.3
Not yet ingested
- Civics
- —
Market trends
- HPI YoY
- ▼ -0.15%
- Current HPI
- 264.9727
- Rent YoY
- —
- Metro
- Tampa-St. Petersburg-Clearwater, FL
- State GDP YoY
- ▲ 3.28%
- F500 in state
- 36
Industry mix (Fortune 500 HQ in FL)
| Industry | F500 HQs | Revenue |
|---|---|---|
| Industrial Technology | 2 | $29B |
|
||
| Insurance | 2 | $17B |
|
||
| Retail | 1 | $60B |
|
||
| Technology Distribution | 1 | $58B |
|
||
| Homebuilding | 1 | $35B |
|
||
| Technology Manufacturing | 1 | $35B |
|
||
Price history
+251.2% since first listed5 events — show timeline
- 2026-05-13 Price Changed $249,000 Stellar MLS as Distributed by MLS Grid
- 2026-04-21 Price Changed $259,000 Stellar MLS as Distributed by MLS Grid
- 2026-03-24 Listed $279,000 Stellar MLS as Distributed by MLS Grid
- 1996-10-07 Sold (Public Records) $70,000 Public Records
- 1981-03-01 Sold (Public Records) $70,900 Public Records
Property tax history
-4.1%/yrLatest (2025): $1,424 · +6.8% YoY. Source: county tax records.
Cash-flow waterfall
monthlySold comps — $/sqft
last 12 mo · ≤1 miLoading sold comps…