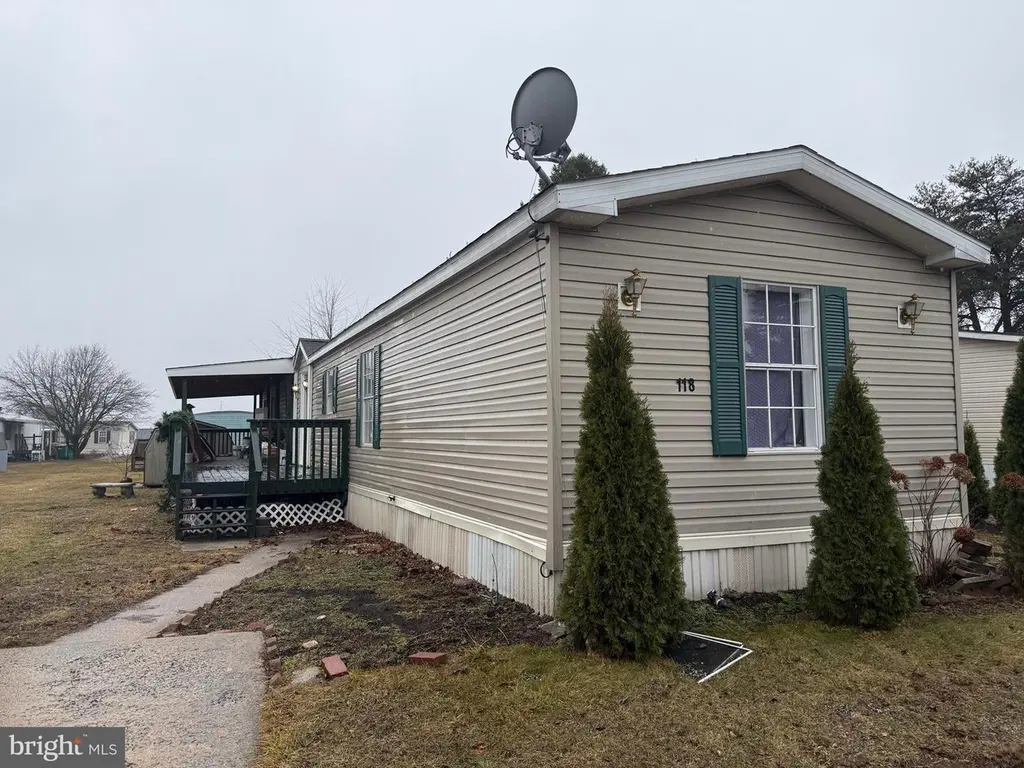
118 Tower Cir · North Middleton, PA
Flood risk 1/10 · Minimal
- FEMA flood zone
- X (unshaded)
- Chance of flooding over 30 yrs
- 0.0%
- Est. flood insurance / yr
- $507 – $1,088
Fire risk 1/10 · Minimal
- Est. fire insurance / yr
- $511 – $949
Heat risk 5/10 · Moderate
- Hot days now (above 101°F)
- 7 days/yr
- Hot days in 30 yrs
- 15 days/yr
Wind risk 2/10 · Minimal
- Chance of severe wind over 30 yrs
- 3.0%
Air-quality risk 2/10 · Minimal
- Unhealthy air days now
- 1 days/yr
- Unhealthy air days in 30 yrs
- 3 days/yr
Risk factors via First Street. Map © Google.
Why this score? — see what drove the B grade
The composite is a weighted blend of 9 inputs, each scored 0–100. Each bar is that input's sub-score; the figure is the points it added to the 100-point composite (weight × sub-score).
- Cash flow +30.0/30.0
- ARV discount +12.4/15.0
- 1% rule +10.0/10.0
- DSCR +10.0/10.0
- Schools +3.8/10.0
- Rent growth +3.1/5.0
- Livability +2.5/5.0
- Condition / age +2.5/5.0
- Appreciation +0.0/10.0
$75,900
🖨 Deal sheet 📄 Offer letter ✓ Due diligence
Listing remarks MLS
Beautifully remodeled doublewide mobile home offering modern updates throughout. The home features a fully upgraded kitchen with new cabinets, countertops, and updated appliances. Both bathrooms have been completely remodeled with contemporary finishes. Enjoy new flooring, fresh paint, and a bright open layout. Step outside to a brand-new deck, perfect for relaxing or entertaining guests. This move-in ready home combines comfort, style, and affordability.
Key facts
- Built 1998
- Listed 98 days
Neighborhood map
What this means for you Summary
Snapshot
- This is a 2-bed/2.0-bath manufactured listed at $76k.
Deal economics
- At list price, monthly cash flow is $791 ($9k/yr) — positive.
- The deal already cash-flows at list — no discount required.
- Meets the 1% rule at list price ($2k rent vs $76k).
- Recommended offer: $69k (9.0% below list) — sets the bar for market timing.
Location & tenants
- Location reads: area grade B — affects rentability + tenant quality, not the cash-flow math above.
- Carlisle Area SD (urban): math 33% / reading 55% proficiency, ranked #277 of 539 in PA (top 51%) — families likely to look elsewhere, expect single-tenant / working-renter base with shorter leases.
- Market conditions: Rents rising (+2.5%/yr); 308 active listings in the ZIP; 1 comparable units currently listed for rent nearby; 1,052 units permitted in Cumberland County in 2024 (310 in 5+ unit buildings).
Forward outlook
- Local home prices are declining (-3.0%/yr); year-one equity from $525 of loan paydown is wiped out by about $2k of value loss. Plan a longer hold.
- Cumberland County population projected at +17% by 2050 — long-run rental-demand tailwind backs the buy-and-hold thesis.
- At projected returns (-3.0% appreciation + 2.5% rent growth), your $21k cash investment doubles in ~3 years — after that, you're playing with house money.
Negotiation context
- It's been on market 98 days — a 9% lower offer ($69k) is reasonable based on typical stale-listing flexibility.
- 2 sale attempts with the ask held roughly flat each time — persistent listings suggest the price (not the market) is what's stuck; bring a comps-based counter.
Risks & watch-outs
- Climate carrying-cost: extreme-heat days projected 7→15/yr by 2055 (HVAC capex compounding) — expect insurance premiums to compound above CPI over the hold.
Questions for the listing agent
- It's been on market 98 days. Have you received any prior offers? Is the seller open to a 9% concession, seller financing, or rate buy-down credit?
- Why hasn't it sold? Are there any deal-killer items the seller is aware of (foundation, flood, title, zoning, code violations)?
- Is there a deadline driving the sale (1031 exchange, divorce, estate, relocation)? That informs how much negotiation room exists.
- What's the average days-on-market for RENTAL listings here right now (not sales)? A rising rental-DOM trend means longer vacancies and softer asking-rent achievability than the comps imply.
- What's the recent tenant-quality profile in this submarket — average credit score on applications, eviction rate, late-payment / NSF rate, and stable-employment percentage? A property-management company in the area should have these aggregated.
- How much new for-sale + rental construction is in the pipeline within 1–3 miles? Heavy new supply typically softens prices + rents 12–24 months out; constrained supply supports both.
Investment metrics
- 1% rule
- 2.11% ✓
- Cap rate
- 18.79%
- Cash-on-cash
- 44.64%
- DSCR
- 2.99
- GRM
- 3.9
CMA / ARV
- ARV (median comp)
- $85,193
- List price
- $75,900
- Delta
- -10.91%
- Verdict
- UNDERPRICED
- Comps
- 20 within 1.0 mi
Projected returns pro-forma
-3.0% appreciation · 2.54% rent growth · sell at horizon
- IRR
- 41.2%
- Equity multiple
- 2.76×
- Total profit
- $37,314
- Equity at exit
- $11,317
- IRR
- 47.2%
- Equity multiple
- 5.44×
- Total profit
- $94,309
- Equity at exit
- $6,562
Cash invested: $21,252 (down + closing). Projections, not guarantees.
Landlord ↔ Tenant lean methodology
- Overall (STATE)
- 62 Landlord-Friendly
- State Pennsylvania
- 62 Landlord-Friendly · EVEN
- County
- — inherits STATE
- City
- — inherits STATE
ZIP-level market 17013
- Rents YoY
- 2.5%
- Active inventory
- 308
- Price-to-rent
- 3.9×
Monthly cashflow live
- Estimated rent
- $1,602 medium interval (Pro) →
- Mortgage (P&I)
- −$398
- Tax from tax record
- −$45 /mo · $542/yr
- Insurance
- −$32
- HOA
- −$0
- Vacancy / Maint / Mgmt
- −$336
- Net cashflow
- $791
Break-even live
UW: 25.0% down · 7.5% · 30yr · 1.5% tax · 5.0% vac · 8.0% maint · 8.0% mgmt
Financing live
Cash to close
- Down payment
- $18,975
- Closing costs
- $2,277
- Reserves months
- —
- Total cash needed
- —
Loan-product check · same deal, 3 products live
Conventional
25% down · 7.5% · 30yr
- Down + closing
- —
- Monthly P&I
- —
- Monthly cashflow
- —
- DSCR
- —
- Eligible?
- —
Personal DTI + credit; lowest rate.
DSCR
20% down · 8.5% · 30yr
- Down + closing
- —
- Monthly P&I
- —
- Monthly cashflow
- —
- DSCR
- —
- Eligible?
- —
No personal income docs; deal must DSCR.
Hard money
10% down · 12.0% · 12mo
- Down + closing
- —
- Monthly P&I
- —
- Monthly cashflow
- —
- DSCR
- —
- Eligible?
- —
Short-term bridge; refi at stabilization.
Rent comps 1 comps
| Address | Beds | Baths | Sqft | Rent | $/sqft | DOM | Units | Dist |
|---|---|---|---|---|---|---|---|---|
| 130 Imperial Ct Carlisle, PA | 3.0 | 2.0 | 1137 | $1,650 | $1.45 | 43d | 1 | 0.09mi |
Listing history 18 events
-
2026-06-18days on market $75,900 Active 98 DOM
-
2026-06-17days on market $75,900 Active 97 DOM
-
2026-06-16days on market $75,900 Active 96 DOM
-
2026-06-15days on market $75,900 Active 95 DOM
-
2026-06-14days on market $75,900 Active 93 DOM
-
2026-06-10days on market $75,900 Active 90 DOM
-
2026-06-09days on market $75,900 Active 89 DOM
-
2026-06-08days on market $75,900 Active 88 DOM
-
2026-06-07days on market $75,900 Active 87 DOM
-
2026-06-03days on market $75,900 Active 83 DOM
-
2026-06-02days on market $75,900 Active 82 DOM
-
2026-06-01days on market $75,900 Active 81 DOM
-
2026-05-31days on market $75,900 Active 80 DOM
-
2026-05-31days on market $75,900 Active 79 DOM
-
2026-03-13$75,900 Active 459-char remark
Show marketing remark (459 chars)
Beautifully remodeled doublewide mobile home offering modern updates throughout. The home features a fully upgraded kitchen with new cabinets, countertops, and updated appliances. Both bathrooms have been completely remodeled with contemporary finishes. Enjoy new flooring, fresh paint, and a bright open layout. Step outside to a brand-new deck, perfect for relaxing or entertaining guests. This move-in ready home combines comfort, style, and affordability.
-
2026-03-10historical $75,900 459-char remark
Show marketing remark (459 chars)
Beautifully remodeled doublewide mobile home offering modern updates throughout. The home features a fully upgraded kitchen with new cabinets, countertops, and updated appliances. Both bathrooms have been completely remodeled with contemporary finishes. Enjoy new flooring, fresh paint, and a bright open layout. Step outside to a brand-new deck, perfect for relaxing or entertaining guests. This move-in ready home combines comfort, style, and affordability.
-
2025-09-30historical
-
2025-07-12$65,000 Active
ⓘ Source: listings_history table (triggers on properties + properties_extension) + one-shot
backfill from property_details.listing_events for pre-trigger history.
Tax reassessment forecast PA · Partial reset (capped growth)
- Current annual tax
- $542 · $45/mo
- Projected year-2 tax
- $871 · $73/mo
- Expected delta
- +$328/yr (+$27/mo · 60.6%)
ⓘ Screening estimate from a state-policy table — verify with the county assessor before closing.
Climate risk First Street
- Flood 1/10 Low FEMA zone X (unshaded) · 0% chance over 30 yrs
- Wildfire 1/10 Low
- Heat 5/10 Major 7 d/yr ≥101°F today · 15 d/yr by 30 yrs out
- Wind 2/10 Low 3% chance of damaging wind over 30 yrs
- Air quality 2/10 Low 1 unhealthy d/yr today · 3 by 30 yrs out
Nearby sold comps map
Loading sold comps map…
Walkable amenities ~0.75 mi
Loading nearby amenities…
Taxation est. · year 1
- Rental income
- $19,223
- − Mortgage interest
- −$4,252
- − Property taxes
- −$542
- − Insurance
- −$380
- − Repairs & maintenance
- −$1,538
- − Management
- −$1,538
- − Depreciation
- −$2,208
- Taxable income
- $8,766
- Est. tax owed @ 24.0%
- −$2,104
- After-tax cash flow
- $7,384/yr
For passive investors: Depreciation is non-cash, so a rental often shows a tax loss while cash-flowing — sheltering income. Rental losses are passive: they offset passive income freely, and up to $25,000/yr can offset ordinary (W-2) income if you actively participate and your MAGI is under $100k (phasing out to $0 by $150k); unused losses carry forward. On sale, claimed depreciation is recaptured at up to 25%, and gains may owe capital-gains tax (a 1031 exchange can defer both). Figures are a year-1 estimate at your 24.0% rate — not tax advice; consult a CPA.
Schools (NCES district)
- District
- Carlisle Area SD
- NCES district ID
- 4205010
- Math proficiency
- 33% ▼ -14.00%
- Reading proficiency
- 55% ▼ -10.00%
- Median HH income
- $55,334
- Composite
- 38.23/100
- National rank
- #4247
- State rank
- #277 of 539 in PA
Livability — North Middleton
No livability data for this city. (Only ~50 U.S. cities are tracked.)
Census & demographics
- Census place
- Schlusser, PA
- County
- Cumberland County · 257,673 people
- Metro
- Harrisburg-Carlisle, PA
- Population (ZIP)
- 38,513
- Household income
- $71,042
- Rent vs Own
- Severe rent burden
- 1444.0
Population outlook (Cumberland County) Hauer SSP2
- Today (2025)
- 267,950 people
- By 2030
- 278,105 · +3.8%
- By 2040
- 296,552 · +10.7%
- By 2050
- 312,937 · +16.8%
- By 2075
- 349,233 · +30.3%
- By 2100
- 361,875 · +35.1%
Race, ethnicity, and origin ACS 2023
- Neighborhood character
- Predominantly White (79%)
- Race & ethnicity
- White 79% Black 8% Hispanic / Latino 7% Two or more races 6% Asian 3%
- Hispanic origin (detail)
- Puerto Rican 3% Dominican 1%
- Common ancestry
- Iranian 3% Romanian 3% Lithuanian 2%
- Foreign-born
- 7% · Canada, Vietnam
- Languages at home
- 91% English-only · Spanish 3% Russian/Polish/Slavic 1% Arabic 1%
Political lean MEDSL · Cumberland
- 2024 margin
- Lean R (+9.4) · D 44.6% · R 54.1% · Other 1.3%
- 2008→2024 swing
- +4.2pp toward D · 2008: -13.6pp · 2024: -9.4pp
- All cycles
- 2024: R+9.4 2020: R+10.6 2016: R+18.6 2012: R+18.5 2008: R+13.6
Not yet ingested
- Civics
- —
Market trends
- HPI YoY
- ▼ -140.48%
- Current HPI
- 247.337
- Rent YoY
- ▲ 2.54%
- Metro
- Harrisburg-Carlisle, PA
- State GDP YoY
- ▲ 1.68%
- F500 in state
- 34
Industry mix (Fortune 500 HQ in PA)
| Industry | F500 HQs | Revenue |
|---|---|---|
| Healthcare | 2 | $309B |
|
||
| Insurance | 2 | $27B |
|
||
| Telecommunications / Media | 1 | $124B |
|
||
| Industrial Distribution | 1 | $22B |
|
||
| Financial Services | 1 | $20B |
|
||
| Chemicals / Materials | 1 | $18B |
|
||
Price history
+16.8% since first listed4 events — show timeline
- 2026-03-13 Listed $75,900 BRIGHT MLS
- 2026-03-10 Coming Soon $75,900 BRIGHT MLS
- 2025-09-30 Listing Removed — BRIGHT MLS
- 2025-07-12 Listed $65,000 BRIGHT MLS
Property tax history
+2.7%/yrLatest (2026): $542 · +3.1% YoY. Source: county tax records.
Cash-flow waterfall
monthlySold comps — $/sqft
last 12 mo · ≤1 miLoading sold comps…