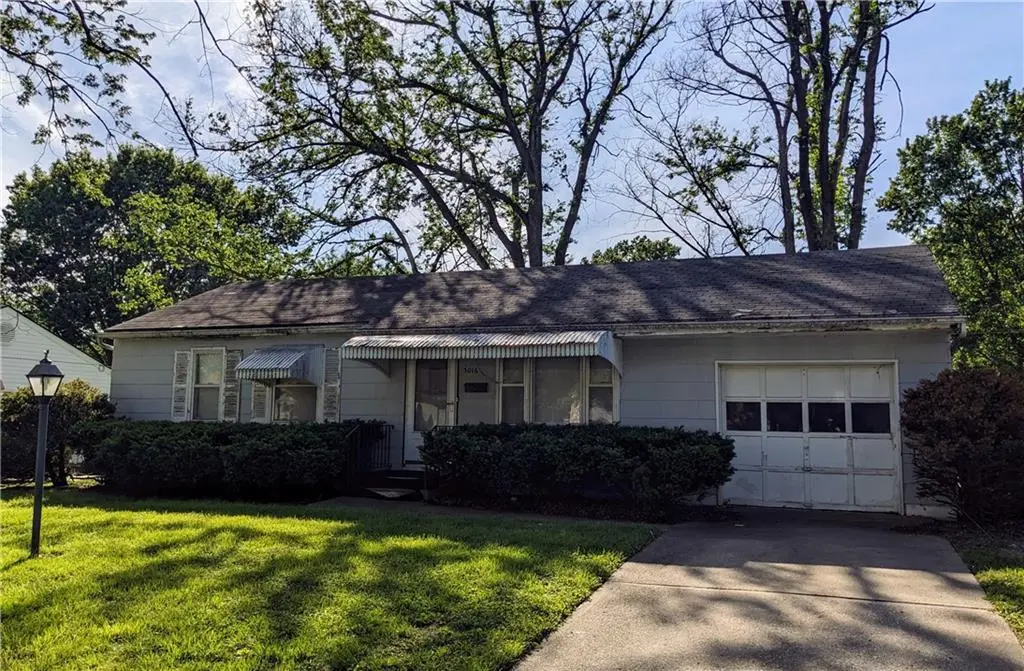
3016 Porter Rd · Independence, MO
Flood risk 1/10 · Minimal
- FEMA flood zone
- X (unshaded)
- Chance of flooding over 30 yrs
- 0.0%
- Est. flood insurance / yr
- $473 – $860
Fire risk 1/10 · Minimal
- Est. fire insurance / yr
- $1,054 – $1,958
Heat risk 4/10 · Minor
- Hot days now (above 108°F)
- 7 days/yr
- Hot days in 30 yrs
- 17 days/yr
Wind risk 2/10 · Minimal
- Chance of severe wind over 30 yrs
- —
Air-quality risk 3/10 · Minor
- Unhealthy air days now
- 3 days/yr
- Unhealthy air days in 30 yrs
- 3 days/yr
Risk factors via First Street. Map © Google.
Why this score? — see what drove the B+ grade
The composite is a weighted blend of 9 inputs, each scored 0–100. Each bar is that input's sub-score; the figure is the points it added to the 100-point composite (weight × sub-score).
- Cash flow +29.7/30.0
- ARV discount +15.0/15.0
- DSCR +10.0/10.0
- 1% rule +8.0/10.0
- Livability +4.1/5.0
- Rent growth +3.8/5.0
- Schools +2.7/10.0
- Condition / age +2.5/5.0
- Appreciation +0.0/10.0
$120,000
🖨 Deal sheet 📄 Offer letter ✓ Due diligence
Listing remarks MLS
Lots Of Tlc By Sellers! 2 Yr Old Furnace And Water Heater. 3 Nice Sized Bdrms And One Bath. Hardwood Floors In Bedrooms. Fresh Paint Throughout. Large Fenced Back Yard. Very Nice Home. Show And Sell!!
Key facts
- Eat-in area
- One-car garage
- Adjoining kitchen
Tags
Property features AI
Exterior
- Parking: Attached garage (1 car) with garage facing front
- Utilities: Public water; Public sewer
- Home design: Single family residence; Ranch floor plan; Faces southeast
- Construction: Other construction materials; Composition roof
- Exterior features: Fixer-up condition; Metal fencing; Level lot; Paved road with public maintenance
Interior
- Kitchen: Refrigerator; Gas range; Eat-in kitchen
- Bedrooms: 3 bedrooms (all on the main level)
- Flooring: Carpet; Vinyl; Wood flooring
- Bathrooms: 1 full bathroom with shower-over-tub
- Heating & cooling: Forced air heating; Electric cooling
- Interior features: Wood windows; Eat-in kitchen; Full unfinished basement
- Laundry & utility: Washer and dryer included; Dryer electric hookup in basement
Neighborhood map
What this means for you Summary
Snapshot
- This is a 3-bed/1.0-bath single-family listed at $120k.
Deal economics
- At list price, monthly cash flow is $438 ($5k/yr) — positive.
- The deal already cash-flows at list — no discount required.
- Meets the 1% rule at list price ($2k rent vs $120k).
- Cap rate 10.7% vs local median 5.0% in Independence — top-decile yield for the area; either an underpriced asset or a hidden risk that comps aren't pricing in. Stress-test before assuming the spread holds.
Location & tenants
- Location reads 82/100 on livability (#10 in MO, #1,296 nationally) — a professional / high-income tenant draw. Strengths: amenities A+, commute A+, cost of living A+; Watch: employment D+, crime F.
- Independence 30 (suburban): math 26% / reading 38% proficiency, ranked #252 of 324 in MO (top 78%) — families likely to look elsewhere, expect single-tenant / working-renter base with shorter leases.
- Zoned schools: Glendale Elem. (math 37% / reading 47%, grade F, #481 of 1,115 statewide, top 46%, 458 students, 69% FRL); Truman High (math 18% / reading 34%, grade F, #430 of 521 statewide, top 83%, 1,662 students, 52% FRL) — zoned schools at 60% FRL track the district average.
- Market conditions: Rents rising fast (+5.1%/yr); 200 active listings in the ZIP; 9 comparable units currently listed for rent nearby; rentals leasing fast (median 8d on market — plan ~1-2 weeks tenant-placement turnaround); 4,002 units permitted in Jackson County in 2024 (2,271 in 5+ unit buildings).
- This rent runs 30% of the median local income ($62k/yr) — at the standard rent-burdened threshold; future hikes will face affordability resistance.
Forward outlook
- Local home prices are declining (-3.0%/yr); year-one equity from $830 of loan paydown is wiped out by about $4k of value loss. Plan a longer hold.
- Jackson County population projected at +4% by 2050 — modest demand growth; plan on rents tracking national, not racing it.
- At projected returns (-3.0% appreciation + 5.1% rent growth), your $34k cash investment doubles in ~7 years — after that, you're playing with house money.
Negotiation context
- Only 1 days on market — expect competitive offers; lowballing is unlikely to land.
- 2 sale attempts since 27y ago with the ask held roughly flat each time — persistent listings suggest the price (not the market) is what's stuck; bring a comps-based counter.
Questions for the listing agent
- Built in 1965 — when were the roof, HVAC, electrical panel, plumbing, and water heater last replaced?
- Is there a deadline driving the sale (1031 exchange, divorce, estate, relocation)? That informs how much negotiation room exists.
- Crime grade is F in this area — have there been break-ins, vandalism, or insurance claims at this property in the last 3 years? What carrier currently insures it and at what premium?
- What's the average days-on-market for RENTAL listings here right now (not sales)? A rising rental-DOM trend means longer vacancies and softer asking-rent achievability than the comps imply.
- What's the recent tenant-quality profile in this submarket — average credit score on applications, eviction rate, late-payment / NSF rate, and stable-employment percentage? A property-management company in the area should have these aggregated.
- How much new for-sale + rental construction is in the pipeline within 1–3 miles? Heavy new supply typically softens prices + rents 12–24 months out; constrained supply supports both.
Investment metrics
- 1% rule
- 1.30% ✓
- Cap rate
- 10.67%
- Cash-on-cash
- 15.63%
- DSCR
- 1.70
- GRM
- 6.4
CMA / ARV
- ARV (on-the-fly)
- $182,400
- Comps found
- 12
Show comp detail 12 sales within ~0.75 mi
| Address | Dist | Beds/Ba | Sqft | Sold | Price | $/sf | Match |
|---|---|---|---|---|---|---|---|
| 3016 Porter Rd | 0.00mi | 3/1.0 | 912 (0%) | 1mo | $120,000 | $132 | 99 |
| 3209 S Mark Cir | 0.21mi | 3/1.0 | 912 (0%) | 7mo | $205,000 | $225 | 84 |
| 16824 E 31st St S | 0.27mi | 3/1.5 | 972 (+7%) | 2mo | $195,000 | $201 | 72 |
| 16800 E 31st St S | 0.20mi | 3/1.5 | 972 (+7%) | 6mo | $200,000 | $206 | 72 |
| 3200 Queen Ridge Dr | 0.24mi | 3/1.5 | 981 (+8%) | 12mo | $188,000 | $192 | 64 |
| 3229 S Trail Ridge Dr | 0.35mi | 3/2.0 | 912 (0%) | 19mo | $180,000 | $197 | 64 |
| 16913 Ellison Way | 0.28mi | 3/1.5 | 972 (+7%) | 14mo | $220,000 | $226 | 63 |
| 16000 E 32nd St S | 0.34mi | 3/1.5 | 975 (+7%) | 18mo | $169,500 | $174 | 55 |
| 2530 Queen Ridge Dr | 0.64mi | 3/1.0 | 1,008 (+10%) | 8mo | $180,000 | $179 | 46 |
| 2512 Queen Ridge Dr | 0.69mi | 3/1.5 | 1,040 (+14%) | 5mo | $169,900 | $163 | 38 |
| 16104 E 35th St S | 0.68mi | 3/1.0 | 975 (+7%) | 23mo | $195,000 | $200 | 38 |
| 3420 Queen Ridge Dr | 0.51mi | 3/2.0 | 1,048 (+15%) | 13mo | $219,000 | $209 | 36 |
Match score weights: distance 35% · size 25% · config 20% · recency 20%. Top-matched comps best support the ARV.
Projected returns pro-forma
-3.0% appreciation · 5.09% rent growth · sell at horizon
- IRR
- 8.7%
- Equity multiple
- 1.35×
- Total profit
- $11,796
- Equity at exit
- $17,892
- IRR
- 19.6%
- Equity multiple
- 2.80×
- Total profit
- $60,580
- Equity at exit
- $10,375
Cash invested: $33,600 (down + closing). Projections, not guarantees.
Landlord ↔ Tenant lean methodology
- Overall (STATE)
- 81 Strongly Landlord-Friendly
- State Missouri
- 81 Strongly Landlord-Friendly · R+10
- County
- — inherits STATE
- City
- — inherits STATE
ZIP-level market 64055
- Rents YoY
- 5.1%
- Active inventory
- 200
- Price-to-rent
- 6.4×
Monthly cashflow live
- Estimated rent
- $1,565 high interval (Pro) →
- Mortgage (P&I)
- −$629
- Tax from tax record
- −$120 /mo · $1,437/yr
- Insurance
- −$50
- HOA
- −$0
- Vacancy / Maint / Mgmt
- −$329
- Net cashflow
- $438
Break-even live
UW: 25.0% down · 7.5% · 30yr · 1.5% tax · 5.0% vac · 8.0% maint · 8.0% mgmt
Financing live
Cash to close
- Down payment
- $30,000
- Closing costs
- $3,600
- Reserves months
- —
- Total cash needed
- —
Loan-product check · same deal, 3 products live
Conventional
25% down · 7.5% · 30yr
- Down + closing
- —
- Monthly P&I
- —
- Monthly cashflow
- —
- DSCR
- —
- Eligible?
- —
Personal DTI + credit; lowest rate.
DSCR
20% down · 8.5% · 30yr
- Down + closing
- —
- Monthly P&I
- —
- Monthly cashflow
- —
- DSCR
- —
- Eligible?
- —
No personal income docs; deal must DSCR.
Hard money
10% down · 12.0% · 12mo
- Down + closing
- —
- Monthly P&I
- —
- Monthly cashflow
- —
- DSCR
- —
- Eligible?
- —
Short-term bridge; refi at stabilization.
Rent comps 9 comps
| Address | Beds | Baths | Sqft | Rent | $/sqft | DOM | Units | Dist |
|---|---|---|---|---|---|---|---|---|
| 16301 E 29 St S Independence, MO | 1.0–2.0 | 1.0 | 718 | $1,400 | $1.95 | 16d | 16 | 0.13mi |
| 16428 E 29th Street Ct S Unit B Independence, MO | 2.0 | 1.5 | 826 | $1,277 | $1.55 | 23d | 1 | 0.20mi |
| 2905 S Lee's Summit Rd Independence, MO | 1.0–3.0 | 1.0–2.0 | 853 | $1,746 | $2.05 | 1d | 48 | 0.34mi |
| 16801 E Larkspur Ln Independence, MO | 1.0–3.0 | 1.0–2.0 | 1125 | $1,650 | $1.47 | 1d | 7 | 0.47mi |
| 16801 E Larkspur Ln Independence, MO | 1.0–3.0 | 1.0–2.0 | 1042 | $1,549 | $1.49 | 43d | 26 | 0.47mi |
| 3605 S Stayton Ave Independence, MO | 3.0 | 2.0 | 1078 | $1,631 | $1.51 | 7d | 1 | 0.87mi |
| 8061/2 E Devon St Independence, MO | 2.0 | 1.0 | 824 | $1,195 | $1.45 | 7d | 1 | 1.28mi |
| 3926 S Redwood Dr Independence, MO | 2.0 | 1.0 | 945 | $1,050 | $1.11 | 23d | 1 | 1.36mi |
| 1900 S Brookstone Village Dr Independence, MO | 1.0–3.0 | 1.0–2.0 | 951 | $1,797 | $1.89 | 2d | 8 | 1.50mi |
Listing history 6 events
-
2026-05-15status Pending
-
2026-05-14$120,000 Active
-
1999-10-25soldstatus
-
1999-10-22soldstatus 200-char remark
Show marketing remark (200 chars)
Lots Of Tlc By Sellers! 2 Yr Old Furnace And Water Heater. 3 Nice Sized Bdrms And One Bath. Hardwood Floors In Bedrooms. Fresh Paint Throughout. Large Fenced Back Yard. Very Nice Home. Show And Sell!!
-
1999-06-17$79,900 200-char remark
Show marketing remark (200 chars)
Lots Of Tlc By Sellers! 2 Yr Old Furnace And Water Heater. 3 Nice Sized Bdrms And One Bath. Hardwood Floors In Bedrooms. Fresh Paint Throughout. Large Fenced Back Yard. Very Nice Home. Show And Sell!!
-
1989-04-13soldstatus
ⓘ Source: listings_history table (triggers on properties + properties_extension) + one-shot
backfill from property_details.listing_events for pre-trigger history.
Tax reassessment forecast MO · Resets to sale price
- Current annual tax
- $1,437 · $120/mo
- Projected year-2 tax
- $1,437 · $120/mo
- Expected delta
- $0/yr ($0/mo · 0.0%)
ⓘ Screening estimate from a state-policy table — verify with the county assessor before closing.
Climate risk First Street
- Flood 1/10 Low FEMA zone X (unshaded) · 0% chance over 30 yrs
- Wildfire 1/10 Low
- Heat 4/10 Moderate 7 d/yr ≥108°F today · 17 d/yr by 30 yrs out
- Wind 2/10 Low
- Air quality 3/10 Moderate 3 unhealthy d/yr today · 3 by 30 yrs out
Nearby sold comps map
Loading sold comps map…
Walkable amenities ~0.75 mi
Loading nearby amenities…
Taxation est. · year 1
- Rental income
- $18,786
- − Mortgage interest
- −$6,722
- − Property taxes
- −$1,437
- − Insurance
- −$600
- − Repairs & maintenance
- −$1,503
- − Management
- −$1,503
- − Depreciation
- −$3,491
- Taxable income
- $3,530
- Est. tax owed @ 24.0%
- −$847
- After-tax cash flow
- $4,405/yr
For passive investors: Depreciation is non-cash, so a rental often shows a tax loss while cash-flowing — sheltering income. Rental losses are passive: they offset passive income freely, and up to $25,000/yr can offset ordinary (W-2) income if you actively participate and your MAGI is under $100k (phasing out to $0 by $150k); unused losses carry forward. On sale, claimed depreciation is recaptured at up to 25%, and gains may owe capital-gains tax (a 1031 exchange can defer both). Figures are a year-1 estimate at your 24.0% rate — not tax advice; consult a CPA.
Schools (NCES district)
- District
- Independence 30
- NCES district ID
- 2915480
- Math proficiency
- 26% ▼ -8.00%
- Reading proficiency
- 38% ▼ -5.00%
- Median HH income
- $41,843
- Composite
- 27.04/100
- National rank
- #7054
- State rank
- #252 of 324 in MO
Livability — Independence
- Score
- 82/100
- State rank
- #10
- US rank
- #1296
Category grades
Schools grade is shown separately in the Schools card above.
Census & demographics
- Census place
- Independence, MO
- County
- Jackson County · 687,798 people
- City population
- 117,675
- Metro
- Kansas City, MO-KS
- Population (ZIP)
- 35,960
- Household income
- $62,439
- Rent vs Own
- Severe rent burden
- 1404.0
Population outlook (Jackson County) Hauer SSP2
- Today (2025)
- 719,589 people
- By 2030
- 731,456 · +1.6%
- By 2040
- 746,689 · +3.8%
- By 2050
- 749,289 · +4.1%
- By 2075
- 736,227 · +2.3%
- By 2100
- 668,210 · -7.1%
Race, ethnicity, and origin ACS 2023
- Neighborhood character
- Predominantly White (71%)
- Race & ethnicity
- White 71% Black 13% Hispanic / Latino 10% Two or more races 8% Asian 1%
- Hispanic origin (detail)
- Mexican 7% Puerto Rican 2%
- Common ancestry
- Italian 9% Lithuanian 2% Slovak 2%
- Foreign-born
- 4% · Canada
- Languages at home
- 94% English-only · Spanish 4%
Political lean MEDSL · Jackson
- 2024 margin
- D (+19.3) · D 58.9% · R 39.5% · Other 1.6%
- 2008→2024 swing
- -6.1pp toward R · 2008: 25.4pp · 2024: 19.3pp
- All cycles
- 2024: D+19.3 2020: D+22.0 2016: D+16.6 2012: D+19.0 2008: D+25.4
Not yet ingested
- Civics
- —
Market trends
- HPI YoY
- ▼ -180.54%
- Current HPI
- 245.3636
- Rent YoY
- ▲ 5.09%
- Metro
- Kansas City, MO-KS
- State GDP YoY
- ▲ 1.84%
- F500 in state
- 20
Industry mix (Fortune 500 HQ in MO)
| Industry | F500 HQs | Revenue |
|---|---|---|
| Healthcare | 1 | $163B |
|
||
| Insurance | 1 | $21B |
|
||
| Industrial Technology | 1 | $17B |
|
||
| Retail | 1 | $16B |
|
||
| Industrial Distribution | 1 | $10B |
|
||
| Utilities | 1 | $9B |
|
||
Price history
+50.2% since first listed6 events — show timeline
- 2026-05-15 Pending — Heartland MLS as Distributed by MLS Grid
- 2026-05-14 Listed $120,000 Heartland MLS as Distributed by MLS Grid
- 1999-10-25 Sold (Public Records) — Public Records
- 1999-10-22 Sold (MLS) — Heartland MLS as Distributed by MLS Grid
- 1999-06-17 Listed $79,900 Heartland MLS as Distributed by MLS Grid
- 1989-04-13 Sold (Public Records) — Public Records
Property tax history
+1.3%/yrLatest (2025): $1,437 · +0.1% YoY. Source: county tax records.
Cash-flow waterfall
monthlySold comps — $/sqft
last 12 mo · ≤1 miLoading sold comps…