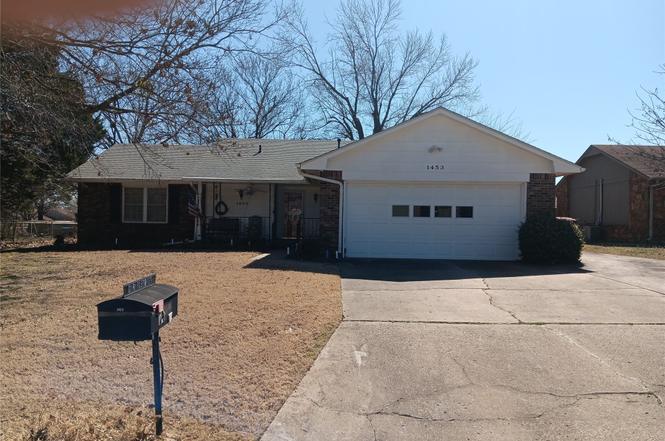
1453 E Paradise Park St · Claremore, OK
Flood risk 1/10 · Minimal
- FEMA flood zone
- X (unshaded)
- Chance of flooding over 30 yrs
- 0.0%
- Est. flood insurance / yr
- $507 – $1,088
Fire risk 4/10 · Minor
- Est. fire insurance / yr
- $2,463 – $4,575
Heat risk 7/10 · Major
- Hot days now (above 110°F)
- 7 days/yr
- Hot days in 30 yrs
- 19 days/yr
Wind risk 2/10 · Minimal
- Chance of severe wind over 30 yrs
- 4.0%
Air-quality risk 2/10 · Minimal
- Unhealthy air days now
- 1 days/yr
- Unhealthy air days in 30 yrs
- 1 days/yr
Risk factors via First Street. Map © Google.
Why this score? — see what drove the D grade
The composite is a weighted blend of 9 inputs, each scored 0–100. Each bar is that input's sub-score; the figure is the points it added to the 100-point composite (weight × sub-score).
- Cash flow +13.8/30.0
- ARV discount +9.4/15.0
- DSCR +4.2/10.0
- Livability +3.7/5.0
- Rent growth +3.2/5.0
- 1% rule +2.7/10.0
- Condition / age +2.5/5.0
- Schools +2.1/10.0
- Appreciation +0.0/10.0
$215,000
🖨 Deal sheet 📄 Offer letter ✓ Due diligence
Listing remarks MLS
ROOF REPLACED IN 97,NEW THERMAL WINDOWS, TOTALLY UPDATED NEW CARPET & VINYL, NEW PAINTED WALLPAPER, F/P, SPRINKLER SYSTEM CH RECORD ON SQ FT IS INCORRECT.
Key facts
- 0.24 acre lot
- 2 garage spots
- Built 1978
Property features AI
Exterior
- Parking: 2-car garage; Garage faces side
- Security: Smoke detector(s); No safety shelter
- Utilities: Cable available; Electricity available; Public water; Public sewer
- Home design: Single-story home; Faces north; Slab foundation; Brick and wood frame construction; Asphalt/fiberglass roof
- Construction: Built as listed in public records; Brick exterior; Wood frame; Asphalt and fiberglass roofing; Slab foundation
- Exterior features: Enclosed porch; Porch; Storage structure; Chain link fencing; Corner lot; No other exterior features listed
Interior
- Kitchen: Country-style kitchen; Built-in range; Range; Oven; Refrigerator
- Bedrooms: All bedrooms on the first floor; One bedroom with a private bath; Two bedrooms without a bath; Master with full bath
- Flooring: Carpet; Laminate
- Bathrooms: One full bathroom; One half bathroom; Master full bathroom
- Heating & cooling: Central heating (electric); Central air conditioning
- Interior features: Ceiling fan(s); Laminate counters; Other interior features; Aluminum window frames
- Laundry & utility: Utility room inside on the first floor; Electric dryer hookup; Electric water heater
Neighborhood map
What this means for you Summary
Snapshot
- This is a 3-bed/2.0-bath single-family listed at $215k.
Deal economics
- At list price, monthly cash flow is $21 ($247/yr) — positive.
- The deal already cash-flows at list — no discount required.
- To meet the 1% rule (rent ≥ 1% of price), the offer needs to be $165k (23.3% below list).
- Recommended offer: $165k (23.3% below list) — sets the bar for 1% rule.
- Cap rate 6.4% vs local median 4.1% in Claremore — top-decile yield for the area; either an underpriced asset or a hidden risk that comps aren't pricing in. Stress-test before assuming the spread holds.
Location & tenants
- Location reads 73/100 on livability (#20 in OK) — a middle-class / working-renter tenant base. Strengths: cost of living A+, housing A+, health & safety A; Watch: schools D, amenities F, commute F.
- Claremore (town): math 24% / reading 25% proficiency, ranked #111 of 270 in OK (top 41%) — low school quality limits family demand, transient renter base, plan for 1-2y turnover.
- Market conditions: Rents rising (+2.6%/yr); 181 active listings in the ZIP; 4 comparable units currently listed for rent nearby; rentals leasing fast (median 11d on market — plan ~1-2 weeks tenant-placement turnaround); 608 units permitted in Rogers County in 2024 (7 in 5+ unit buildings).
- This rent runs 30% of the median local income ($65k/yr) — at the standard rent-burdened threshold; future hikes will face affordability resistance.
Forward outlook
- Local home prices are declining (-3.0%/yr); year-one equity from $1k of loan paydown is wiped out by about $6k of value loss. Plan a longer hold.
- Rogers County population projected at +16% by 2050 — long-run rental-demand tailwind backs the buy-and-hold thesis.
Negotiation context
- It's been on market 109 days — a 9% lower offer ($196k) is reasonable based on typical stale-listing flexibility.
- 3 sale attempts since 29y ago with the ask held roughly flat each time — persistent listings suggest the price (not the market) is what's stuck; bring a comps-based counter.
- Current owner paid $86k; list at $215k implies a 149% gain — meaningful room to come down on a strong offer.
Risks & watch-outs
- Climate carrying-cost: extreme-heat days projected 7→19/yr by 2055 (HVAC capex compounding) — expect insurance premiums to compound above CPI over the hold.
Questions for the listing agent
- It's been on market 109 days. Have you received any prior offers? Is the seller open to a 23% concession, seller financing, or rate buy-down credit?
- Built in 1978 — when were the roof, HVAC, electrical panel, plumbing, and water heater last replaced?
- Why hasn't it sold? Are there any deal-killer items the seller is aware of (foundation, flood, title, zoning, code violations)?
- Is there a deadline driving the sale (1031 exchange, divorce, estate, relocation)? That informs how much negotiation room exists.
- Schools are D-rated, which usually means shorter tenancies and higher turnover. Who's the typical renter profile here, and what's been the actual vacancy rate?
- The area grade is low — what's the realistic commute time and amenity access for the typical tenant pool here? Any planned neighborhood developments (good or bad) we should know about?
- What's the average days-on-market for RENTAL listings here right now (not sales)? A rising rental-DOM trend means longer vacancies and softer asking-rent achievability than the comps imply.
- What's the recent tenant-quality profile in this submarket — average credit score on applications, eviction rate, late-payment / NSF rate, and stable-employment percentage? A property-management company in the area should have these aggregated.
- How much new for-sale + rental construction is in the pipeline within 1–3 miles? Heavy new supply typically softens prices + rents 12–24 months out; constrained supply supports both.
Investment metrics
- 1% rule
- 0.77% ✗
- Cap rate
- 6.41%
- Cash-on-cash
- 0.41%
- DSCR
- 1.02
- GRM
- 10.9
CMA / ARV
- ARV (on-the-fly)
- $224,298
- Comps found
- 12
Show comp detail 12 sales within ~0.75 mi
| Address | Dist | Beds/Ba | Sqft | Sold | Price | $/sf | Match |
|---|---|---|---|---|---|---|---|
| 1429 W Evergreen Ln | 0.28mi | 2/2.0 (-1) | 1,435 (-2%) | 4mo | $206,560 | $144 | 75 |
| 1112 W 20th St | 0.37mi | 3/2.0 | 1,536 (+5%) | 4mo | $240,000 | $156 | 71 |
| 1001 W 22nd St | 0.51mi | 3/2.0 | 1,426 (-3%) | 3mo | $195,000 | $137 | 69 |
| 1906 Valley View Dr | 0.34mi | 3/2.0 | 1,566 (+7%) | 7mo | $224,500 | $143 | 67 |
| 2002 N Chambers Ter | 0.55mi | 3/2.0 | 1,392 (-5%) | 1mo | $215,000 | $154 | 65 |
| 1005 W 23rd St | 0.53mi | 3/2.0 | 1,359 (-7%) | 0mo | $240,000 | $177 | 63 |
| 2001 N Chambers Ave | 0.41mi | 3/2.0 | 1,317 (-10%) | 2mo | $206,000 | $156 | 62 |
| 1303 W School St | 0.31mi | 3/1.5 | 1,265 (-14%) | 1mo | $194,000 | $153 | 60 |
| 817 W 24th St | 0.70mi | 3/2.0 | 1,344 (-8%) | 5mo | $185,000 | $138 | 50 |
| 1110 W 24th St | 0.59mi | 3/2.0 | 1,285 (-12%) | 4mo | $193,500 | $151 | 49 |
| 1002 W 24th St | 0.64mi | 3/2.0 | 1,287 (-12%) | 8mo | $215,000 | $167 | 43 |
| 902 W 8th St | 0.66mi | 3/1.5 | 1,280 (-13%) | 6mo | $167,000 | $130 | 41 |
Match score weights: distance 35% · size 25% · config 20% · recency 20%. Top-matched comps best support the ARV.
Projected returns pro-forma
-3.0% appreciation · 2.62% rent growth · sell at horizon
- IRR
- -16.1%
- Equity multiple
- 0.43×
- Total profit
- $-34,257
- Equity at exit
- $32,057
- IRR
- -8.4%
- Equity multiple
- 0.48×
- Total profit
- $-31,108
- Equity at exit
- $18,589
Cash invested: $60,200 (down + closing). Projections, not guarantees.
Landlord ↔ Tenant lean methodology
- Overall (STATE)
- 83 Strongly Landlord-Friendly
- State Oklahoma
- 83 Strongly Landlord-Friendly · R+20
- County
- — inherits STATE
- City
- — inherits STATE
ZIP-level market 74017
- Home prices YoY
- -20.1%
- Rents YoY
- 2.6%
- Active inventory
- 181
- Price-to-rent
- 10.9×
Monthly cashflow live
- Estimated rent
- $1,649 medium interval (Pro) →
- Mortgage (P&I)
- −$1,127
- Tax from tax record
- −$65 /mo · $784/yr
- Insurance
- −$90
- HOA
- −$0
- Vacancy / Maint / Mgmt
- −$346
- Net cashflow
- $21
Break-even live
UW: 25.0% down · 7.5% · 30yr · 1.5% tax · 5.0% vac · 8.0% maint · 8.0% mgmt
Financing live
Cash to close
- Down payment
- $53,750
- Closing costs
- $6,450
- Reserves months
- —
- Total cash needed
- —
Loan-product check · same deal, 3 products live
Conventional
25% down · 7.5% · 30yr
- Down + closing
- —
- Monthly P&I
- —
- Monthly cashflow
- —
- DSCR
- —
- Eligible?
- —
Personal DTI + credit; lowest rate.
DSCR
20% down · 8.5% · 30yr
- Down + closing
- —
- Monthly P&I
- —
- Monthly cashflow
- —
- DSCR
- —
- Eligible?
- —
No personal income docs; deal must DSCR.
Hard money
10% down · 12.0% · 12mo
- Down + closing
- —
- Monthly P&I
- —
- Monthly cashflow
- —
- DSCR
- —
- Eligible?
- —
Short-term bridge; refi at stabilization.
Rent comps 4 comps
| Address | Beds | Baths | Sqft | Rent | $/sqft | DOM | Units | Dist |
|---|---|---|---|---|---|---|---|---|
| 1308 Sunstone St Claremore, OK | 4.0 | 2.0 | 1796 | $2,200 | $1.22 | 2d | 1 | 0.78mi |
| 644 Earthside Dr Apt B Claremore, OK | 2.0 | 1.5 | 950 | $900 | $0.95 | 10d | 1 | 1.18mi |
| 2808 Ridgeview Pl Unit A Claremore, OK | 3.0 | 2.0 | 1288 | $1,500 | $1.16 | 2d | 1 | 1.43mi |
| 2805 Trailwood Dr Unit B Claremore, OK | 3.0 | 2.0 | 1288 | $1,500 | $1.16 | 10d | 1 | 1.47mi |
Listing history 21 events
-
2026-06-18days on market $215,000 Active 109 DOM
-
2026-06-17days on market $215,000 Active 108 DOM
-
2026-06-16days on market $215,000 Active 107 DOM
-
2026-06-15days on market $215,000 Active 106 DOM
-
2026-06-13days on market $215,000 Active 104 DOM
-
2026-06-10pricedays on market $215,000 Active 101 DOM
-
2026-06-09days on market $220,000 Active 100 DOM
-
2026-06-08days on market $220,000 Active 99 DOM
-
2026-06-07days on market $220,000 Active 98 DOM
-
2026-06-05days on market $220,000 Active 95 DOM
-
2026-06-03days on market $220,000 Active 94 DOM
-
2026-06-02days on market $220,000 Active 93 DOM
-
2026-06-01days on market $220,000 Active 92 DOM
-
2026-05-31days on market $220,000 Active 91 DOM
-
2026-03-01$220,000 Active
-
1997-12-23soldstatus $86,500 160-char remark
Show marketing remark (160 chars)
ROOF REPLACED IN 97,NEW THERMAL WINDOWS, TOTALLY UPDATED NEW CARPET & VINYL, NEW PAINTED WALLPAPER, F/P, SPRINKLER SYSTEM CH RECORD ON SQ FT IS INCORRECT.
-
1997-12-08historical 160-char remark
Show marketing remark (160 chars)
ROOF REPLACED IN 97,NEW THERMAL WINDOWS, TOTALLY UPDATED NEW CARPET & VINYL, NEW PAINTED WALLPAPER, F/P, SPRINKLER SYSTEM CH RECORD ON SQ FT IS INCORRECT.
-
1997-12-01soldstatus $86,500
-
1997-11-11$88,000 160-char remark
Show marketing remark (160 chars)
ROOF REPLACED IN 97,NEW THERMAL WINDOWS, TOTALLY UPDATED NEW CARPET & VINYL, NEW PAINTED WALLPAPER, F/P, SPRINKLER SYSTEM CH RECORD ON SQ FT IS INCORRECT.
-
1997-11-05historical
-
1997-10-02$92,500
ⓘ Source: listings_history table (triggers on properties + properties_extension) + one-shot
backfill from property_details.listing_events for pre-trigger history.
Tax reassessment forecast OK · Resets to sale price
- Current annual tax
- $784 · $65/mo
- Projected year-2 tax
- $1,935 · $161/mo
- Expected delta
- +$1,151/yr (+$96/mo · 146.8%)
ⓘ Screening estimate from a state-policy table — verify with the county assessor before closing.
Climate risk First Street
- Flood 1/10 Low FEMA zone X (unshaded) · 0% chance over 30 yrs
- Wildfire 4/10 Moderate
- Heat 7/10 Severe 7 d/yr ≥110°F today · 19 d/yr by 30 yrs out
- Wind 2/10 Low 4% chance of damaging wind over 30 yrs
- Air quality 2/10 Low 1 unhealthy d/yr today · 1 by 30 yrs out
Nearby sold comps map
Loading sold comps map…
Walkable amenities ~0.75 mi
Loading nearby amenities…
Taxation est. · year 1
- Rental income
- $19,792
- − Mortgage interest
- −$12,043
- − Property taxes
- −$784
- − Insurance
- −$1,075
- − Repairs & maintenance
- −$1,583
- − Management
- −$1,583
- − Depreciation
- −$6,255
- Taxable loss
- −$3,532
- Est. tax savings @ 24.0%
- +$848
- After-tax cash flow
- $1,095/yr
For passive investors: Depreciation is non-cash, so a rental often shows a tax loss while cash-flowing — sheltering income. Rental losses are passive: they offset passive income freely, and up to $25,000/yr can offset ordinary (W-2) income if you actively participate and your MAGI is under $100k (phasing out to $0 by $150k); unused losses carry forward. On sale, claimed depreciation is recaptured at up to 25%, and gains may owe capital-gains tax (a 1031 exchange can defer both). Figures are a year-1 estimate at your 24.0% rate — not tax advice; consult a CPA.
Schools (NCES district)
- District
- Claremore
- NCES district ID
- 4007740
- Math proficiency
- 24% ▼ -12.00%
- Reading proficiency
- 25% ▼ -11.00%
- Median HH income
- $44,946
- Composite
- 21.16/100
- National rank
- #8426
- State rank
- #111 of 270 in OK
Livability — Claremore
- Score
- 73/100
- State rank
- #20
- US rank
- #5616
Category grades
Schools grade is shown separately in the Schools card above.
Census & demographics
- Census place
- Claremore, OK
- County
- Rogers County · 50,229 people
- City population
- 50,229
- Metro
- Tulsa, OK
- Population (ZIP)
- 29,206
- Household income
- $65,368
- Rent vs Own
- Severe rent burden
- 603.0
Population outlook (Rogers County) Hauer SSP2
- Today (2025)
- 100,211 people
- By 2030
- 104,381 · +4.2%
- By 2040
- 111,567 · +11.3%
- By 2050
- 116,791 · +16.5%
- By 2075
- 129,134 · +28.9%
- By 2100
- 132,326 · +32.0%
Race, ethnicity, and origin ACS 2023
- Neighborhood character
- Diverse neighborhood (Simpson 0.55)
- Race & ethnicity
- White 67% Native American 15% Two or more races 12% Hispanic / Latino 7% Black 1%
- Hispanic origin (detail)
- Mexican 5%
- Common ancestry
- Slovak 2% Lithuanian 1% Portuguese 1%
- Foreign-born
- 3% · Canada
- Languages at home
- 94% English-only · Spanish 4%
Political lean MEDSL · Rogers
- 2024 margin
- Solid R (+55.0) · D 21.6% · R 76.6% · Other 1.7%
- 2008→2024 swing
- -10.9pp toward R · 2008: -44.1pp · 2024: -55.0pp
- All cycles
- 2024: R+55.0 2020: R+54.9 2016: R+56.3 2012: R+50.1 2008: R+44.1
Not yet ingested
- Civics
- —
Market trends
- HPI YoY
- ▼ -57.22%
- Current HPI
- 227.0657
- Rent YoY
- ▲ 2.62%
- Metro
- Tulsa, OK
- State GDP YoY
- ▲ 1.55%
- F500 in state
- 6
Industry mix (Fortune 500 HQ in OK)
| Industry | F500 HQs | Revenue |
|---|---|---|
| Energy | 3 | $48B |
|
||
Price history
+137.8% since first listed7 events — show timeline
- 2026-03-01 Listed $220,000 MLS Technology, Inc.
- 1997-12-23 Sold (MLS) $86,500 MLS Technology, Inc.
- 1997-12-08 Listing Removed — MLS Technology, Inc.
- 1997-12-01 Sold (Public Records) $86,500 Public Records
- 1997-11-11 Listed $88,000 MLS Technology, Inc.
- 1997-11-05 Listing Removed — MLS Technology, Inc.
- 1997-10-02 Listed $92,500 MLS Technology, Inc.
Property tax history
+0.1%/yrLatest (2025): $784 · +0.0% YoY. Source: county tax records.
Cash-flow waterfall
monthlySold comps — $/sqft
last 12 mo · ≤1 miLoading sold comps…