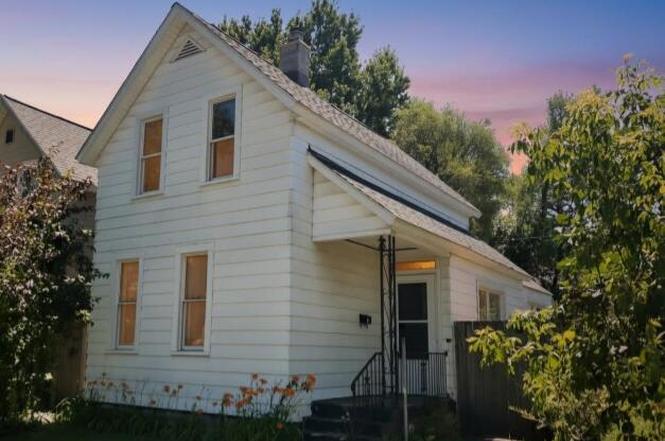
1006 Baldwin St SE · Grand Rapids, MI
Flood risk 1/10 · Minimal
- FEMA flood zone
- X (unshaded)
- Chance of flooding over 30 yrs
- 0.0%
- Est. flood insurance / yr
- $473 – $860
Fire risk 1/10 · Minimal
- Est. fire insurance / yr
- $784 – $1,456
Heat risk 2/10 · Minimal
- Hot days now (above 96°F)
- 7 days/yr
- Hot days in 30 yrs
- 16 days/yr
Wind risk 2/10 · Minimal
- Chance of severe wind over 30 yrs
- —
Air-quality risk 3/10 · Minor
- Unhealthy air days now
- 2 days/yr
- Unhealthy air days in 30 yrs
- 3 days/yr
Risk factors via First Street. Map © Google.
Why this score? — see what drove the D+ grade
The composite is a weighted blend of 9 inputs, each scored 0–100. Each bar is that input's sub-score; the figure is the points it added to the 100-point composite (weight × sub-score).
- Cash flow +16.3/30.0
- ARV discount +7.5/15.0
- DSCR +5.1/10.0
- Rent growth +4.2/5.0
- Livability +4.2/5.0
- 1% rule +3.5/10.0
- Condition / age +2.5/5.0
- Schools +1.9/10.0
- Appreciation +0.0/10.0
$215,000
🖨 Deal sheet (PDF) 📄 Offer letter ✓ Due diligence
Listing remarks MLS
Completely remodeled and unlike anything else on the market, this East Hills investment opportunity combines historic charm with modern updates in one of Grand Rapids' most desirable neighborhoods. Originally built in 1870, the home has been renovated top to bottom, creating a turnkey opportunity for investors or future owner-occupants alike. Features include 3 bedrooms, 1 full bath, central air, replacement windows, and low-maintenance ownership. Located minutes from downtown Grand Rapids, restaurants, shopping, parks, and entertainment, the property benefits from strong rental demand. Currently tenant-occupied, it offers immediate income potential. A City of Grand Rapids rental certification is already in place through 2030, providing added peace of mind. A rare blend of character, location, and long-term value.
Key facts
- Strong rental demand
- Modern updates
- Historic charm
Tags
Property features AI
Exterior
- Utilities: Public water; Natural gas connected; Natural gas water heater
- Home design: Single-family residence; Other architectural style; Built in 1870; Residential property
- Construction: Aluminum siding; Composition roof
- Exterior features: Paved road access; 0.07-acre lot
Interior
- Kitchen: Oven; Range; Refrigerator
- Bedrooms: Total of 7 rooms (bedroom count not specified)
- Bathrooms: 1 full bathroom
- Heating & cooling: Forced air heating; Has cooling
- Interior features: Eat-in kitchen; Replacement windows; Michigan-style basement
Neighborhood map
What this means for you Summary
Snapshot
- This is a 3-bed/1.0-bath single-family listed at $215k.
Deal economics
- At list price, monthly cash flow is $119 ($1k/yr) — positive.
- The deal already cash-flows at list — no discount required.
- To meet the 1% rule (rent ≥ 1% of price), the offer needs to be $183k (14.7% below list).
- Recommended offer: $183k (14.7% below list) — sets the bar for 1% rule.
- Cap rate 7.0% vs local median 4.5% in Grand Rapids — top-decile yield for the area; either an underpriced asset or a hidden risk that comps aren't pricing in. Stress-test before assuming the spread holds.
Location & tenants
- Location reads 83/100 on livability (#44 in MI, #939 nationally) — a professional / high-income tenant draw. Strengths: amenities A+, commute A+, cost of living A+; Watch: employment C-, crime F.
- Grand Rapids Public Schools (urban): math 15% / reading 29% proficiency, ranked #451 of 540 in MI (top 84%) — low school quality limits family demand, transient renter base, plan for 1-2y turnover; 80% free/reduced lunch — lower-income household profile, screen leases tightly.
- Zoned schools: Congress Elementary (math 44% / reading 54%, grade D, #382 of 1,397 statewide, top 30%, 191 students, 67% FRL); Alger Middle School (math 2% / reading 12%, grade F, #481 of 493 statewide, top 98%, 342 students, 95% FRL); City Middlehigh (math 65% / reading 88%, grade A-, #16 of 713 statewide, top 2%, 908 students, 40% FRL).
- Zoned-school proficiency averages 44% at this address vs 22% district-wide (+22 pts) — the actual schools serving this property are materially stronger than the Grand Rapids Public Schools average implies; a family-tenant draw the district grade alone would hide.
- Market conditions: Rents rising fast (+6.9%/yr); 210 active listings in the ZIP; 28 comparable units currently listed for rent nearby; rentals lingering (median 46d on market — plan ~5-8 weeks vacancy on turnover, expect pricing pressure); 82% of comp listings sitting > 30 days — soft ceiling on asking rent; high-income renter base; 2,253 units permitted in Kent County in 2024 (969 in 5+ unit buildings).
Forward outlook
- Local home prices are declining (-3.0%/yr); year-one equity from $1k of loan paydown is wiped out by about $6k of value loss. Plan a longer hold.
- Kent County population projected at +22% by 2050 — long-run rental-demand tailwind backs the buy-and-hold thesis.
Negotiation context
- Only 11 days on market — expect competitive offers; lowballing is unlikely to land.
- 5 sale attempts since 12y ago with the ask held roughly flat each time — persistent listings suggest the price (not the market) is what's stuck; bring a comps-based counter.
- Current owner paid $55k; list at $215k implies a 291% gain — meaningful room to come down on a strong offer.
Risks & watch-outs
- Watch-outs: built in 1870 — expect roof / HVAC / electrical / plumbing capex.
Questions for the listing agent
- Built in 1870 — when were the roof, HVAC, electrical panel, plumbing, and water heater last replaced?
- Is there a deadline driving the sale (1031 exchange, divorce, estate, relocation)? That informs how much negotiation room exists.
- Crime grade is F in this area — have there been break-ins, vandalism, or insurance claims at this property in the last 3 years? What carrier currently insures it and at what premium?
- The area grade is low — what's the realistic commute time and amenity access for the typical tenant pool here? Any planned neighborhood developments (good or bad) we should know about?
- What's the average days-on-market for RENTAL listings here right now (not sales)? A rising rental-DOM trend means longer vacancies and softer asking-rent achievability than the comps imply.
- What's the recent tenant-quality profile in this submarket — average credit score on applications, eviction rate, late-payment / NSF rate, and stable-employment percentage? A property-management company in the area should have these aggregated.
- How much new for-sale + rental construction is in the pipeline within 1–3 miles? Heavy new supply typically softens prices + rents 12–24 months out; constrained supply supports both.
Investment metrics
- 1% rule
- 0.85% ✗
- Cap rate
- 6.96%
- Cash-on-cash
- 2.37%
- DSCR
- 1.11
- GRM
- 9.8
CMA / ARV
No comps found within radius.
Projected returns pro-forma
-3.0% appreciation · 6.92% rent growth · sell at horizon
- IRR
- -8.7%
- Equity multiple
- 0.67×
- Total profit
- $-19,801
- Equity at exit
- $32,057
- IRR
- 5.0%
- Equity multiple
- 1.43×
- Total profit
- $25,711
- Equity at exit
- $18,589
Cash invested: $60,200 (down + closing). Projections, not guarantees.
Landlord ↔ Tenant lean methodology
- Overall (STATE)
- 62 Landlord-Friendly
- State Michigan
- 62 Landlord-Friendly · EVEN
- County
- — inherits STATE
- City
- — inherits STATE
ZIP-level market 49506
- Rents YoY
- 6.9%
- Active inventory
- 210
- Price-to-rent
- 9.8×
Monthly cashflow live
- Estimated rent
- $1,835 high interval (Pro) →
- Mortgage (P&I)
- −$1,127
- Tax from tax record
- −$113 /mo · $1,359/yr
- Insurance
- −$90
- HOA
- −$0
- Vacancy / Maint / Mgmt
- −$385
- Net cashflow
- $119
Break-even live
Sensitivity live
| Price | -10% $241 | -5% $180 | +0% $119 | +5% $58 | +10% $-3 |
|---|---|---|---|---|---|
| Rent | -10% $-26 | -5% $47 | +0% $119 | +5% $192 | +10% $264 |
| Rate | -1.0pp $227 | -0.5pp $174 | base $119 | +0.5pp $63 | +1.0pp $7 |
UW: 25.0% down · 7.5% · 30yr · 1.5% tax · 5.0% vac · 8.0% maint · 8.0% mgmt
Financing live
Cash to close
- Down payment
- $53,750
- Closing costs
- $6,450
- Reserves months
- —
- Total cash needed
- —
Loan-product check · same deal, 3 products live
Conventional
25% down · 7.5% · 30yr
- Down + closing
- —
- Monthly P&I
- —
- Monthly cashflow
- —
- DSCR
- —
- Eligible?
- —
Personal DTI + credit; lowest rate.
DSCR
20% down · 8.5% · 30yr
- Down + closing
- —
- Monthly P&I
- —
- Monthly cashflow
- —
- DSCR
- —
- Eligible?
- —
No personal income docs; deal must DSCR.
Hard money
10% down · 12.0% · 12mo
- Down + closing
- —
- Monthly P&I
- —
- Monthly cashflow
- —
- DSCR
- —
- Eligible?
- —
Short-term bridge; refi at stabilization.
Rent comps 28 comps
| Address | Beds | Baths | Sqft | Rent | $/sqft | DOM | Units | Dist |
|---|---|---|---|---|---|---|---|---|
| 11 Fuller Ave SE Apt 204 Grand Rapids, MI | 2.0 | 1.5 | 880 | $1,850 | $2.10 | 45d | 1 | 0.20mi |
| 547 Cherry St SE Grand Rapids, MI | 2.0 | 1.0 | 521 | $1,250 | $2.40 | 45d | 1 | 0.56mi |
| 1333 Wealthy St SE Unit 2 Grand Rapids, MI | 2.0 | 1.0 | 1113 | $1,900 | $1.71 | 45d | 1 | 0.60mi |
| 855 Michigan St NE Unit 205 Grand Rapids, MI | 2.0 | 1.0 | 813 | $1,575 | $1.94 | 45d | 1 | 0.62mi |
| 638 Wealthy St SE Unit A Grand Rapids, MI | 2.0 | 2.0 | 1000 | $2,100 | $2.10 | 45d | 1 | 0.63mi |
| 1400 Wealthy St SE Grand Rapids, MI | 2.0 | 1.0 | 907 | $1,925 | $2.12 | 5d | 1 | 0.67mi |
| 507 Eastern Ave NE #2 Grand Rapids, MI | 2.0 | 1.0 | 710 | $1,495 | $2.11 | 45d | 1 | 0.72mi |
| 414 Benson Ave NE Grand Rapids, MI | 1.0–3.0 | 1.0–2.0 | 1110 | $2,673 | $2.41 | 45d | 14 | 0.78mi |
| 1114 Dunham St SE Unit 1 Grand Rapids, MI | 2.0 | 1.0 | 894 | $1,300 | $1.45 | 45d | 1 | 0.79mi |
| 345 State St SE Grand Rapids, MI | 2.0 | 2.0 | 1107 | $1,280 | $1.16 | 45d | 2 | 0.82mi |
| 1542 Michigan St NE Grand Rapids, MI | 3.0 | 1.0–2.0 | 836 | $1,895 | $2.27 | 5d | 6 | 0.84mi |
| 357 Madison Ave SE Grand Rapids, MI | 1.0–2.0 | 1.0–2.0 | 692 | $1,595 | $2.30 | 45d | 4 | 0.89mi |
| 216 Lafayette Ave SE Grand Rapids, MI | 2.0 | 1.5 | 1000 | $1,395 | $1.40 | 45d | 1 | 0.89mi |
| 17 Lafayette Ave SE Grand Rapids, MI | 2.0 | 1.0–2.0 | 720 | $2,125 | $2.95 | 45d | 7 | 0.92mi |
| 138 Fulton St E Unit 2 Grand Rapids, MI | 2.0 | 1.0 | 800 | $1,800 | $2.25 | 45d | 1 | 1.06mi |
| 818 Grand Ave NE Apt D Grand Rapids, MI | 2.0 | 1.0 | 850 | $1,400 | $1.65 | 45d | 1 | 1.13mi |
| 27 Library St NE #501 Grand Rapids, MI | 2.0 | 2.0 | 1109 | $2,925 | $2.64 | 45d | 1 | 1.17mi |
| 90 Wealthy St SE Grand Rapids, MI | 2.0 | 1.0–2.0 | 602 | $1,850 | $3.07 | 5d | 10 | 1.22mi |
| 434 Worden St SE Unit 2 Grand Rapids, MI | 2.0 | 1.0 | 900 | $1,495 | $1.66 | 45d | 1 | 1.22mi |
| 209 Division Ave S Grand Rapids, MI | 1.0–3.0 | 1.0–2.0 | 1180 | $1,495 | $1.27 | 23d | 2 | 1.24mi |
| 26 Cherry St SW Grand Rapids, MI | 1.0–2.0 | 1.0–2.0 | 878 | $1,275 | $1.45 | 45d | 2 | 1.26mi |
| 200 Ionia Ave NW Grand Rapids, MI | 1.0–2.0 | 1.0 | 500 | $1,246 | $2.49 | 45d | 3 | 1.31mi |
| 240 Ionia Ave SW Grand Rapids, MI | 1.0–2.0 | 1.0–2.0 | 922 | $1,280 | $1.39 | 45d | 2 | 1.33mi |
| 840 Lafayette Ave SE Unit 2 Grand Rapids, MI | 3.0 | 1.0 | 950 | $1,600 | $1.68 | 45d | 1 | 1.33mi |
| 350 Ionia Ave SW Grand Rapids, MI | 2.0–3.0 | 2.0–3.0 | 1400 | $1,350 | $0.96 | 13d | 2 | 1.36mi |
| 711 Clancy Ave NE Grand Rapids, MI | 2.0 | 1.0 | 837 | $1,345 | $1.61 | 45d | 1 | 1.36mi |
| 139 Pearl St NW Unit 201 Grand Rapids, MI | 2.0 | 1.0 | 769 | $1,650 | $2.15 | 45d | 1 | 1.44mi |
| 733 Livingston Ave NE Grand Rapids, MI | 2.0 | 1.0 | 900 | $1,245 | $1.38 | 45d | 1 | 1.50mi |
Listing history 8 events
-
2026-06-21days on market $215,000 Active 11 DOM
-
2026-06-18days on market $215,000 Active 8 DOM
-
2026-06-17days on market $215,000 Active 7 DOM
-
2026-06-16days on market $215,000 Active 6 DOM
-
2026-06-15days on market $215,000 Active 5 DOM
-
2026-06-14days on market $215,000 Active 3 DOM
-
2026-06-13remarks 699-char remark
-
2026-06-13$215,000 Active 2 DOM
ⓘ Source: listings_history table (triggers on properties + properties_extension) + one-shot
backfill from property_details.listing_events for pre-trigger history.
Tax reassessment forecast MI · Partial reset (capped growth)
- Current annual tax
- $1,359 · $113/mo
- Projected year-2 tax
- $2,335 · $195/mo
- Expected delta
- +$976/yr (+$81/mo · 71.9%)
ⓘ Screening estimate from a state-policy table — verify with the county assessor before closing.
Climate risk First Street
- Flood 1/10 Low FEMA zone X (unshaded) · 0% chance over 30 yrs
- Wildfire 1/10 Low
- Heat 2/10 Low 7 d/yr ≥96°F today · 16 d/yr by 30 yrs out
- Wind 2/10 Low
- Air quality 3/10 Moderate 2 unhealthy d/yr today · 3 by 30 yrs out
Nearby sold comps map
Loading sold comps map…
Walkable amenities ~0.75 mi
Loading nearby amenities…
Taxation est. · year 1
- Rental income
- $22,016
- − Mortgage interest
- −$12,043
- − Property taxes
- −$1,359
- − Insurance
- −$1,075
- − Repairs & maintenance
- −$1,761
- − Management
- −$1,761
- − Depreciation
- −$6,255
- Taxable loss
- −$2,238
- Est. tax savings @ 24.0%
- +$537
- After-tax cash flow
- $1,966/yr
For passive investors: Depreciation is non-cash, so a rental often shows a tax loss while cash-flowing — sheltering income. Rental losses are passive: they offset passive income freely, and up to $25,000/yr can offset ordinary (W-2) income if you actively participate and your MAGI is under $100k (phasing out to $0 by $150k); unused losses carry forward. On sale, claimed depreciation is recaptured at up to 25%, and gains may owe capital-gains tax (a 1031 exchange can defer both). Figures are a year-1 estimate at your 24.0% rate — not tax advice; consult a CPA.
Schools (NCES district)
- District
- Grand Rapids Public Schools
- NCES district ID
- 2616440
- Math proficiency
- 15% ▼ -5.00%
- Reading proficiency
- 29% ▼ -1.00%
- Median HH income
- $40,612
- Composite
- 18.62/100
- National rank
- #8899
- State rank
- #451 of 540 in MI
Livability — Grand Rapids
- Score
- 83/100
- State rank
- #44
- US rank
- #939
Category grades
Schools grade is shown separately in the Schools card above.
Census & demographics
- Census place
- Grand Rapids, MI
- County
- Kent County · 533,805 people
- City population
- 181,325
- Metro
- Grand Rapids-Kentwood, MI
- Population (ZIP)
- 34,673
- Household income
- $118,131
- Rent vs Own
- Severe rent burden
- 544.0
Population outlook (Kent County) Hauer SSP2
- Today (2025)
- 712,484 people
- By 2030
- 748,618 · +5.1%
- By 2040
- 814,777 · +14.4%
- By 2050
- 868,556 · +21.9%
- By 2075
- 966,487 · +35.7%
- By 2100
- 967,975 · +35.9%
Race, ethnicity, and origin ACS 2023
- Neighborhood character
- Predominantly White (76%)
- Race & ethnicity
- White 76% Black 11% Two or more races 7% Hispanic / Latino 4% Asian 2%
- Common ancestry
- Iranian 16% Romanian 6% Italian 3%
- Foreign-born
- 6% · Canada, China
- Languages at home
- 93% English-only · Spanish 3% Other Indo-European 1% Russian/Polish/Slavic 1%
Political lean MEDSL · Kent
- 2024 margin
- Lean D (+5.4) · D 51.8% · R 46.5% · Other 1.7%
- 2008→2024 swing
- +4.8pp toward D · 2008: 0.5pp · 2024: 5.4pp
- All cycles
- 2024: D+5.4 2020: D+6.1 2016: R+3.1 2012: R+7.9 2008: D+0.5
Not yet ingested
- Civics
- —
Market trends
- HPI YoY
- ▼ -367.25%
- Current HPI
- 316.2553
- Rent YoY
- ▲ 6.92%
- Metro
- Grand Rapids-Kentwood, MI
- State GDP YoY
- ▲ 1.37%
- F500 in state
- 28
Industry mix (Fortune 500 HQ in MI)
| Industry | F500 HQs | Revenue |
|---|---|---|
| Automotive Parts | 3 | $48B |
|
||
| Automotive | 2 | $372B |
|
||
| Chemicals | 1 | $45B |
|
||
| Automotive Retail | 1 | $29B |
|
||
| Healthcare / Medical Devices | 1 | $23B |
|
||
| Automotive Technology | 1 | $20B |
|
||
Price history
+555.8% since first listed9 events — show timeline
- 2026-06-10 Listed $215,000 REALCOMP
- 2026-06-10 Listed $215,000 MiRealSource-MiMLS
- 2026-06-10 Listed $215,000 SW Michigan MLS
- 2014-10-30 Sold (Public Records) $55,000 Public Records
- 2014-09-29 Sold (MLS) $55,000 REALCOMP
- 2014-09-29 Sold (MLS) $55,000 SW Michigan MLS
- 2014-06-17 Listed $55,000 REALCOMP
- 2014-06-17 Listed $55,000 SW Michigan MLS
- 2005-01-28 Sold (Public Records) $32,786 Public Records
Property tax history
+4.6%/yrLatest (2025): $1,359 · +58.1% YoY. Source: county tax records.
Cash-flow waterfall
monthlySold comps — $/sqft
last 12 mo · ≤1 miLoading sold comps…