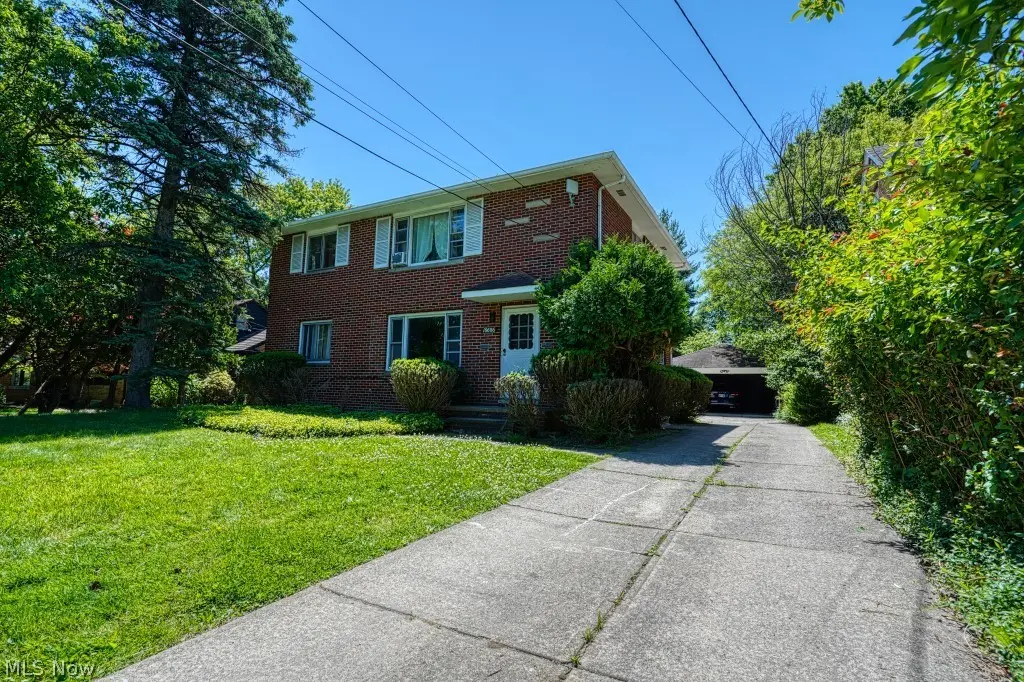
 Duplex
16684 Libby Rd · Maple Heights, OH
Flood risk 1/10 · Minimal
- FEMA flood zone
- X (unshaded)
- Chance of flooding over 30 yrs
- 0.0%
- Est. flood insurance / yr
- $473 – $860
Fire risk 1/10 · Minimal
- Est. fire insurance / yr
- $713 – $1,323
Heat risk 2/10 · Minimal
- Hot days now (above 95°F)
- 7 days/yr
- Hot days in 30 yrs
- 16 days/yr
Wind risk 1/10 · Minimal
- Chance of severe wind over 30 yrs
- —
Air-quality risk 3/10 · Minor
- Unhealthy air days now
- 2 days/yr
- Unhealthy air days in 30 yrs
- 3 days/yr
Risk factors via First Street. Map © Google.
Why this score? — see what drove the C+ grade
The composite is a weighted blend of 9 inputs, each scored 0–100. Each bar is that input's sub-score; the figure is the points it added to the 100-point composite (weight × sub-score).
- Cash flow +30.0/30.0
- 1% rule +10.0/10.0
- DSCR +10.0/10.0
- Rent growth +5.0/5.0
- Livability +3.5/5.0
- Condition / age +2.5/5.0
- Schools +1.6/10.0
- ARV discount +0.0/15.0
- Appreciation +0.0/10.0
$189,000
🖨 Deal sheet (PDF) 📄 Offer letter ✓ Due diligence
Multi-family units
County records classify this as Multi-Family (2-4 Unit). Listing-text estimate: 2 units. confirmed
Listing remarks MLS
BANK OWNED . .. . 2 Family . .. . Brick Exterior . .. . 2 Bedrooms In Each Unit . .. . Full Basement . .. . 2 Car Garage . .. . Deep Lot . .. . . 76 Acres . .. . Handyman's Special . .. .
Key facts
- Ample cabinetry
- Large backyard
- Brick front duplex
Tags
Property features AI
Finance
- Financial info: Gross income reported as $1,979
Exterior
- Parking: Detached paved garage; 2 garage spaces
- Utilities: Public water; Public sewer
- Home design: 2-story brick property; Faces north
- Construction: Built according to public records; Brick construction; Asphalt/fiberglass roof
- Exterior features: Wooded lot
Interior
- Kitchen: Range; Refrigerator; Dishwasher
- Bedrooms: Total of 8 rooms (includes bedrooms and living spaces)
- Bathrooms: 2 full bathrooms
- Heating & cooling: Forced air heating (gas)
- Interior features: Unfinished common basement; Has view
- Laundry & utility: Washer; Dryer; Forced air gas heating
Neighborhood map
What this means for you Summary
Snapshot
- This is a 2 × 2-bed/1.0-bath units multifamily listed at $189k.
Deal economics
- At list price, monthly cash flow is $892 ($11k/yr) — positive. Per door: $446/mo.
- The deal already cash-flows at list — no discount required.
- Meets the 1% rule at list price ($3k rent vs $189k).
- Cap rate 12.0% vs local median 7.7% in Maple Heights — top-decile yield for the area; either an underpriced asset or a hidden risk that comps aren't pricing in. Stress-test before assuming the spread holds.
Location & tenants
- Location reads 70/100 on livability (#470 in OH) — a middle-class / working-renter tenant base. Strengths: cost of living A+, housing A, health & safety A-; Watch: crime D, employment D, amenities F.
- Maple Heights City (suburban): math 14% / reading 25% proficiency, ranked #630 of 656 in OH (top 96%) — low school quality limits family demand, transient renter base, plan for 1-2y turnover; 78% free/reduced lunch — lower-income household profile, screen leases tightly.
- Zoned schools: Abraham Lincoln School (479 students, 0% FRL); Milkovich Middle School (math 14% / reading 24%, grade F, #614 of 654 statewide, top 94%, 733 students, 0% FRL); Maple Heights High School (math 7% / reading 39%, grade F, #669 of 781 statewide, top 86%, 1,017 students, 0% FRL) — zoned schools average 0% FRL vs 78% district-wide (78 pts lower); this property's tenant base skews higher-income than the district average.
- Market conditions: Rents rising fast (+14.8%/yr); 86 active listings in the ZIP; 13 comparable units currently listed for rent nearby; rentals leasing fast (median 6d on market — plan ~1-2 weeks tenant-placement turnaround); 1,441 units permitted in Cuyahoga County in 2024 (700 in 5+ unit buildings).
- At $2,950/mo this rent would consume 66% of the median local household income ($54k/yr) (locally 971% of renters already pay >50% of income on rent) — very limited rent-growth headroom before tenants either downsize or default.
Forward outlook
- Local home prices are declining (-3.0%/yr); year-one equity from $1k of loan paydown is wiped out by about $6k of value loss. Plan a longer hold.
- Cuyahoga County population projected to shrink 8% by 2050 — rents likely to lag national; underwrite the cash flow, not the appreciation.
- At projected returns (-3.0% appreciation + 8.0% rent growth), your $53k cash investment doubles in ~5 years — after that, you're playing with house money.
Negotiation context
- Only 12 days on market — expect competitive offers; lowballing is unlikely to land.
- 8 sale attempts since 26y ago with the ask held roughly flat each time — persistent listings suggest the price (not the market) is what's stuck; bring a comps-based counter.
- Current owner paid $22k; list at $189k implies a 759% gain — meaningful room to come down on a strong offer.
Questions for the listing agent
- Can we see the unit-by-unit rent roll, current vacancy, and any below-market leases? What's the average tenancy length?
- What capital expenditures (roof, boiler, parking lot, exteriors) have been made in the last 5 years, and what's planned in the next 2?
- Built in 1965 — when were the roof, HVAC, electrical panel, plumbing, and water heater last replaced?
- Is there a deadline driving the sale (1031 exchange, divorce, estate, relocation)? That informs how much negotiation room exists.
- Schools are D-rated, which usually means shorter tenancies and higher turnover. Who's the typical renter profile here, and what's been the actual vacancy rate?
- Crime grade is D in this area — have there been break-ins, vandalism, or insurance claims at this property in the last 3 years? What carrier currently insures it and at what premium?
- What's the average days-on-market for RENTAL listings here right now (not sales)? A rising rental-DOM trend means longer vacancies and softer asking-rent achievability than the comps imply.
- What's the recent tenant-quality profile in this submarket — average credit score on applications, eviction rate, late-payment / NSF rate, and stable-employment percentage? A property-management company in the area should have these aggregated.
- How much new apartment / multifamily construction is in the pipeline within 1–3 miles? Heavy new supply (>2% of stock underway) typically softens rents 12–24 months out; light construction supports rent growth.
Investment metrics
- 1% rule
- 1.56% ✓
- Cap rate
- 11.96%
- Cash-on-cash
- 20.24%
- DSCR
- 1.90
- GRM
- 5.3
CMA / ARV
- ARV (on-the-fly)
- $144,130
- Comps found
- 1
Show comp detail 1 sale within ~0.75 mi
| Address | Dist | Beds/Ba | Sqft | Sold | Price | $/sf | Match |
|---|---|---|---|---|---|---|---|
| 5650 Lafayette Ave | 0.55mi | 4/2.0 | 2,052 (+1%) | 4mo | $145,000 | $71 | 69 |
Match score weights: distance 35% · size 25% · config 20% · recency 20%. Top-matched comps best support the ARV.
Projected returns pro-forma
-3.0% appreciation · 8.0% rent growth · sell at horizon
- IRR
- 18.3%
- Equity multiple
- 1.79×
- Total profit
- $41,931
- Equity at exit
- $28,181
- IRR
- 30.2%
- Equity multiple
- 4.42×
- Total profit
- $181,173
- Equity at exit
- $16,341
Cash invested: $52,920 (down + closing). Projections, not guarantees.
Landlord ↔ Tenant lean methodology
- Overall (STATE)
- 73 Landlord-Friendly
- State Ohio
- 73 Landlord-Friendly · R+6
- County
- — inherits STATE
- City
- — inherits STATE
ZIP-level market 44137
- Home prices YoY
- -34.7%
- Rents YoY
- 14.8%
- Active inventory
- 86
- Price-to-rent
- 10.7×
Monthly cashflow live
- Estimated rent
- $2,950 high interval (Pro) →
- Mortgage (P&I)
- −$991
- Tax from tax record
- −$368 /mo · $4,418/yr
- Insurance
- −$79
- HOA
- −$0
- Vacancy / Maint / Mgmt
- −$620
- Net cashflow
- $892
Break-even live
Sensitivity live
| Price | -10% $999 | -5% $946 | +0% $892 | +5% $839 | +10% $785 |
|---|---|---|---|---|---|
| Rent | -10% $659 | -5% $776 | +0% $892 | +5% $1,009 | +10% $1,126 |
| Rate | -1.0pp $988 | -0.5pp $941 | base $892 | +0.5pp $843 | +1.0pp $794 |
2-unit breakdown (identical units grouped — click to expand)
| Units | Beds | Baths | Est. rent |
|---|---|---|---|
| 2× units | 2 | 1 | $2,950 |
| #1 | 2 | 1 | $1,475 |
| #2 | 2 | 1 | $1,475 |
| Total (2 units) | $2,950 | ||
UW: 25.0% down · 7.5% · 30yr · 1.5% tax · 5.0% vac · 8.0% maint · 8.0% mgmt
Financing live
Cash to close
- Down payment
- $47,250
- Closing costs
- $5,670
- Reserves months
- —
- Total cash needed
- —
Loan-product check · same deal, 3 products live
Conventional
25% down · 7.5% · 30yr
- Down + closing
- —
- Monthly P&I
- —
- Monthly cashflow
- —
- DSCR
- —
- Eligible?
- —
Personal DTI + credit; lowest rate.
DSCR
20% down · 8.5% · 30yr
- Down + closing
- —
- Monthly P&I
- —
- Monthly cashflow
- —
- DSCR
- —
- Eligible?
- —
No personal income docs; deal must DSCR.
Hard money
10% down · 12.0% · 12mo
- Down + closing
- —
- Monthly P&I
- —
- Monthly cashflow
- —
- DSCR
- —
- Eligible?
- —
Short-term bridge; refi at stabilization.
Rent comps 13 comps
| Address | Beds | Baths | Sqft | Rent | $/sqft | DOM | Units | Dist |
|---|---|---|---|---|---|---|---|---|
| 5225 Theodore St Maple Heights, OH | 3.0 | 1.0 | 1785 | $1,450 | $0.81 | 6d | 1 | 0.11mi |
| 5508 Grasmere Ave Maple Heights, OH | 3.0 | 2.0 | 1834 | $1,710 | $0.93 | 45d | 1 | 0.39mi |
| 5153 Cato St Maple Heights, OH | 4.0 | 2.0 | 1560 | $1,850 | $1.19 | 25d | 1 | 0.48mi |
| 15913 Grant Ave Maple Heights, OH | 3.0 | 1.5 | 1400 | $1,390 | $0.99 | 18d | 1 | 0.50mi |
| 5435 Beechwood Ave Maple Heights, OH | 3.0 | 2.0 | 1664 | $2,000 | $1.20 | 4d | 1 | 0.73mi |
| 18505 Raymond St Maple Heights, OH | 3.0 | 2.0 | 1957 | $1,400 | $0.72 | 45d | 1 | 0.75mi |
| 5713 South Blvd Maple Heights, OH | 3.0 | 1.0 | 1700 | $2,300 | $1.35 | 3d | 1 | 0.82mi |
| 18990 Raymond St Maple Heights, OH | 4.0 | 1.5 | 1480 | $1,750 | $1.18 | 3d | 1 | 0.89mi |
| 5270 Beech Ave Maple Heights, OH | 3.0 | 1.0 | 1401 | $1,350 | $0.96 | 18d | 1 | 0.99mi |
| 19313 Longview Ave Maple Heights, OH | 4.0 | 2.0 | 1796 | $1,970 | $1.10 | 5d | 1 | 1.07mi |
| 14509 Rockside Rd Maple Heights, OH | 3.0 | 2.0 | 1430 | $2,300 | $1.61 | 3d | 1 | 1.34mi |
| 13319 McCracken Rd Cleveland, OH | 3.0 | 1.0 | 1664 | $2,000 | $1.20 | 5d | 1 | 1.44mi |
| 20609 Hillgrove Ave Maple Heights, OH | 4.0 | 2.0 | 1776 | $1,497 | $0.84 | 18d | 1 | 1.44mi |
Listing history 9 events
-
2026-06-17status $189,000 Pending 12 DOM
-
2026-06-17days on market $189,000 Active 12 DOM
-
2026-06-16days on market $189,000 Active 11 DOM
-
2026-06-15days on market $189,000 Active 10 DOM
-
2026-06-13days on market $189,000 Active 8 DOM
-
2026-06-09days on market $189,000 Active 4 DOM
-
2026-06-08days on market $189,000 Active 3 DOM
-
2026-06-07remarks 699-char remark
-
2026-06-07$189,000 Active 2 DOM
ⓘ Source: listings_history table (triggers on properties + properties_extension) + one-shot
backfill from property_details.listing_events for pre-trigger history.
Tax reassessment forecast OH · Partial reset (capped growth)
- Current annual tax
- $4,418 · $368/mo
- Projected year-2 tax
- $4,418 · $368/mo
- Expected delta
- $0/yr ($0/mo · 0.0%)
ⓘ Screening estimate from a state-policy table — verify with the county assessor before closing.
Climate risk First Street
- Flood 1/10 Low FEMA zone X (unshaded) · 0% chance over 30 yrs
- Wildfire 1/10 Low
- Heat 2/10 Low 7 d/yr ≥95°F today · 16 d/yr by 30 yrs out
- Wind 1/10 Low
- Air quality 3/10 Moderate 2 unhealthy d/yr today · 3 by 30 yrs out
Nearby sold comps map
Loading sold comps map…
Walkable amenities ~0.75 mi
Loading nearby amenities…
Taxation est. · year 1
- Rental income
- $35,400
- − Mortgage interest
- −$10,587
- − Property taxes
- −$4,418
- − Insurance
- −$945
- − Repairs & maintenance
- −$2,832
- − Management
- −$2,832
- − Depreciation
- −$5,498
- Taxable income
- $8,288
- Est. tax owed @ 24.0%
- −$1,989
- After-tax cash flow
- $8,720/yr
For passive investors: Depreciation is non-cash, so a rental often shows a tax loss while cash-flowing — sheltering income. Rental losses are passive: they offset passive income freely, and up to $25,000/yr can offset ordinary (W-2) income if you actively participate and your MAGI is under $100k (phasing out to $0 by $150k); unused losses carry forward. On sale, claimed depreciation is recaptured at up to 25%, and gains may owe capital-gains tax (a 1031 exchange can defer both). Figures are a year-1 estimate at your 24.0% rate — not tax advice; consult a CPA.
Schools (NCES district)
- District
- Maple Heights City
- NCES district ID
- 3904430
- Math proficiency
- 14% ▼ -22.00%
- Reading proficiency
- 25% ▼ -11.00%
- Median HH income
- $38,856
- Composite
- 16.39/100
- National rank
- #9197
- State rank
- #630 of 656 in OH
Livability — Maple Heights
- Score
- 70/100
- State rank
- #470
- US rank
- #7818
Category grades
Schools grade is shown separately in the Schools card above.
Census & demographics
- Census place
- Maple Heights, OH
- County
- Cuyahoga County · 1,090,369 people
- City population
- 23,285
- Metro
- Cleveland-Elyria, OH
- Population (ZIP)
- 23,285
- Household income
- $53,918
- Rent vs Own
- Severe rent burden
- 971.0
Population outlook (Cuyahoga County) Hauer SSP2
- Today (2025)
- 1,244,621 people
- By 2030
- 1,230,093 · -1.2%
- By 2040
- 1,189,108 · -4.5%
- By 2050
- 1,145,706 · -7.9%
- By 2075
- 1,076,557 · -13.5%
- By 2100
- 978,987 · -21.3%
Race, ethnicity, and origin ACS 2023
- Neighborhood character
- Predominantly Black (74%)
- Race & ethnicity
- Black 74% White 20% Two or more races 4% Hispanic / Latino 2%
- Common ancestry
- Romanian 3% Scotch-Irish 2%
- Foreign-born
- 2% · Canada, China
- Languages at home
- 98% English-only · Spanish 1%
Political lean MEDSL · Cuyahoga
- 2024 margin
- Solid D (+31.5) · D 65.4% · R 33.9%
- 2008→2024 swing
- -7.4pp toward R · 2008: 38.9pp · 2024: 31.5pp
- All cycles
- 2024: D+31.5 2020: D+34.1 2016: D+35.0 2012: D+38.7 2008: D+38.9
Not yet ingested
- Civics
- —
Market trends
- HPI YoY
- ▼ -87.37%
- Current HPI
- 164.4326
- Rent YoY
- ▲ 14.82%
- Metro
- Cleveland-Elyria, OH
- State GDP YoY
- ▲ 1.98%
- F500 in state
- 48
Industry mix (Fortune 500 HQ in OH)
| Industry | F500 HQs | Revenue |
|---|---|---|
| Insurance | 3 | $145B |
|
||
| Industrial Machinery | 3 | $49B |
|
||
| Financial Services | 3 | $24B |
|
||
| Consumer Goods | 2 | $93B |
|
||
| Aerospace / Defense | 2 | $47B |
|
||
| Utilities | 2 | $33B |
|
||
Price history
+19.7% since first listed17 events — show timeline
- 2026-06-05 Listed $189,000 MLSNOW
- 2015-03-11 Sold (MLS) $22,000 MLSNOW
- 2015-01-12 Listing Removed — MLSNOW
- 2014-12-31 Listed $19,900 MLSNOW
- 2014-11-19 Listing Removed — MLSNOW
- 2014-03-31 Listed $59,000 MLSNOW
- 2013-04-26 Listing Removed — MLSNOW
- 2013-03-16 Listed $94,000 MLSNOW
- 2008-04-28 Sold (Public Records) $135,000 Public Records
- 2008-04-28 Sold (MLS) $135,000 MLSNOW
- 2007-11-14 Listed $149,900 MLSNOW
- 2007-11-10 Listing Removed — MLSNOW
- 2007-11-10 Listing Removed — MLSNOW
- 2007-08-18 Listed $168,000 MLSNOW
- 2007-08-18 Listed $168,000 MLSNOW
- 2000-08-12 Listing Removed — MLSNOW
- 2000-02-12 Listed $157,900 MLSNOW
Property tax history
+1.6%/yrLatest (2025): $4,418 · -9.8% YoY. Source: county tax records.
Cash-flow waterfall
monthlySold comps — $/sqft
last 12 mo · ≤1 miLoading sold comps…