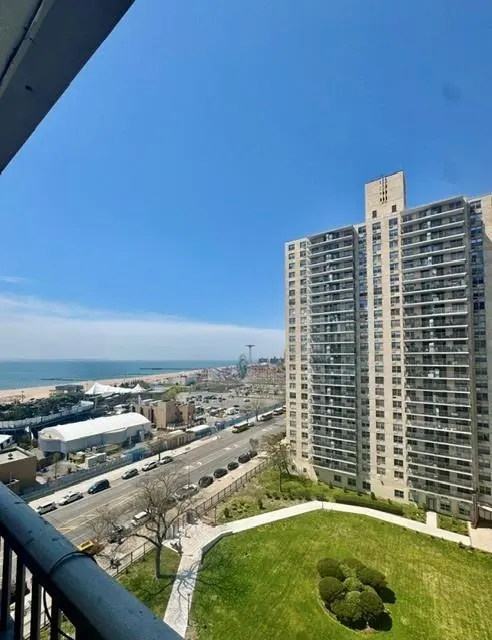
501 Surf Ave Unit 11M · New York, NY
Flood risk 7/10 · Major
- FEMA flood zone
- X (shaded)
- Chance of flooding over 30 yrs
- 0.87%
- Est. flood insurance / yr
- $507 – $1,088
Fire risk 1/10 · Minimal
- Est. fire insurance / yr
- $691 – $1,283
Heat risk 6/10 · Moderate
- Hot days now (above 97°F)
- 6 days/yr
- Hot days in 30 yrs
- 14 days/yr
Wind risk 8/10 · Major
- Chance of severe wind over 30 yrs
- 80.0%
Air-quality risk 4/10 · Minor
- Unhealthy air days now
- 5 days/yr
- Unhealthy air days in 30 yrs
- 7 days/yr
Risk factors via First Street. Map © Google.
Why this score? — see what drove the D- grade
The composite is a weighted blend of 9 inputs, each scored 0–100. Each bar is that input's sub-score; the figure is the points it added to the 100-point composite (weight × sub-score).
- ARV discount +7.5/15.0
- Appreciation +7.5/10.0
- Cash flow +5.2/30.0
- Schools +5.0/10.0
- Rent growth +4.3/5.0
- Livability +3.8/5.0
- Condition / age +2.5/5.0
- 1% rule +1.8/10.0
- DSCR +0.0/10.0
$569,000
🖨 Deal sheet (PDF) 📄 Offer letter ✓ Due diligence
Listing remarks
NOTE: Great deeded parking spot near the 501 building must be purchased with the unit for $69,000 Brightwater Towers Condo– Brighton Beach Area Live steps from the beach in this great 2-bedroom, 1-bath home offering breathtaking ocean views from a large private balcony. Updated kitchen and bathroom, plus plenty of closets throughout. Maint includes all major utilities and low yearly taxes. Located in a full-service luxury building with 24-hour security, heated outdoor pool, children’s pool, fitness center, and package room. Perfectly positioned near the New York Aquarium, Luna Park, restaurants, shopping, and transportation—offering the ultimate beachside lifestyle wit
Key facts
- Parking spot
- 24-hour security
- Updated kitchen
Tags
Property features AI
Finance
- Other: Building amenities include exercise room and storage rooms
- Financial info: Parking carries an additional fee included in condo fees
- HOA & community: Monthly maintenance/ common fee; Building managed by Brightwater Towers Condo; Pets allowed (cats and dogs); Handicap accessible
Exterior
- Parking: Deeded parking space (1 space) in parking area; additional parking available for a fee
- Security: Secure lobby; Card-operated door; Full-time doorman; Security patrol; Resident superintendent
- Utilities: Electric service; Gas service; Heat; Water
- Home design: Residential unit in a detached building; Located on the 11th floor
- Construction: Detached building; Storage rooms available in building
- Exterior features: Waterfront present; Balcony/terrace
Interior
- Kitchen: Includes stove, refrigerator, dishwasher, microwave
- Bedrooms: Two bedrooms on the first floor
- Flooring: Laminate floors
- Bathrooms: One full bathroom on the first floor
- Heating & cooling: Heat (building utilities include heat); Electric and gas service available
- Interior features: Central A/C with two units; Dishwasher; Elevator access; Microwave; Pool; Refrigerator; Stove; Terrace; Laundry area
- Laundry & utility: Laundry area (card-operated laundry available in building)
Neighborhood map
What this means for you Summary
Snapshot
- This is a 2-bed/1.0-bath condo listed at $569k.
Deal economics
- At list price, monthly cash flow is $-1k ($-16k/yr) — negative.
- To cash-flow at today's rent, offer at most $491k (13.7% below list).
- To meet the 1% rule (rent ≥ 1% of price), the offer needs to be $387k (32.0% below list).
- Recommended offer: $387k (32.0% below list) — sets the bar for 1% rule.
- Cap rate 3.6% vs local median 2.6% in New York — top-decile yield for the area; either an underpriced asset or a hidden risk that comps aren't pricing in. Stress-test before assuming the spread holds.
Location & tenants
- Location reads 75/100 on livability (#268 in NY, #4,188 nationally) — a middle-class / working-renter tenant base. Strengths: amenities A+, commute A+, health & safety A; Watch: crime F, cost of living F.
- Zoned schools: Elm Tree Elementary School (math 27% / reading 52%, grade F, #1,444 of 2,108 statewide, top 71%, 806 students, 94% FRL); Is 98 Bay Academy (math 96% / reading 96%, grade A+, #2 of 729 statewide, top 0%, 1,488 students, 63% FRL); Midwood High School (math 94% / reading 96%, grade A+, #83 of 1,100 statewide, top 8%, 4,062 students, 73% FRL).
- Market conditions: Rents rising fast (+7.0%/yr); 114 active listings in the ZIP; 10 comparable units currently listed for rent nearby; rentals at typical pace (median 27d on market — plan ~3-4 weeks tenant-placement turnaround); lower-income renter base — watch delinquency; 10,063 units permitted in Kings County in 2024 (9,789 in 5+ unit buildings).
- At $3,871/mo this rent would consume 106% of the median local household income ($44k/yr) (locally 4426% of renters already pay >50% of income on rent) — very limited rent-growth headroom before tenants either downsize or default.
Forward outlook
- In year one you build about $32k of equity ($4k loan paydown + $28k appreciation (5.0% local appreciation)).
- Kings County population projected at +13% by 2050 — modest demand growth; plan on rents tracking national, not racing it.
- By year 2, paydown + projected appreciation supports a ~$52k cash-out refi (75% LTV) — recoverable capital for the next deal without selling this one.
Negotiation context
- It's been on market 49 days — a 3% lower offer ($552k) is reasonable based on typical stale-listing flexibility.
Risks & watch-outs
- Watch-outs: flood insurance adds $66/mo; HOA is 24% of rent.
- Climate carrying-cost: major flood risk; severe wind risk, 80% chance of damaging wind over 30y; extreme-heat days projected 6→14/yr by 2055 (HVAC capex compounding) — expect insurance premiums to compound above CPI over the hold.
Questions for the listing agent
- What do current leases actually rent for vs. the listed asking? Can we see a recent rent roll and the last 12 months of T-12 income?
- It's been on market 49 days. Have you received any prior offers? Is the seller open to a 32% concession, seller financing, or rate buy-down credit?
- Built in 1964 — when were the roof, HVAC, electrical panel, plumbing, and water heater last replaced?
- What's the actual annual flood-insurance premium (NFIP or private), and is the property in a SFHA with mandatory coverage?
- What does the HOA fee cover, when was the last increase, and are there any pending special assessments or reserve-fund shortfalls?
- Any open or pending special assessments — roof, HVAC, plumbing, elevator, façade? What's the per-unit balance and payoff schedule, and is the seller paying it off at close or rolling it to the buyer?
- Is there a deadline driving the sale (1031 exchange, divorce, estate, relocation)? That informs how much negotiation room exists.
- Schools are B-rated — typically a magnet for longer-tenancy family renters. What's the average tenant stay here, and is there a school-zone premium baked into asking?
- Crime grade is F in this area — have there been break-ins, vandalism, or insurance claims at this property in the last 3 years? What carrier currently insures it and at what premium?
- The area grade is low — what's the realistic commute time and amenity access for the typical tenant pool here? Any planned neighborhood developments (good or bad) we should know about?
- What's the average days-on-market for RENTAL listings here right now (not sales)? A rising rental-DOM trend means longer vacancies and softer asking-rent achievability than the comps imply.
- What's the recent tenant-quality profile in this submarket — average credit score on applications, eviction rate, late-payment / NSF rate, and stable-employment percentage? A property-management company in the area should have these aggregated.
- How much new apartment / multifamily construction is in the pipeline within 1–3 miles? Heavy new supply (>2% of stock underway) typically softens rents 12–24 months out; light construction supports rent growth.
Investment metrics
- 1% rule
- 0.68% ✗
- Cap rate
- 3.58%
- Cash-on-cash
- -9.68%
- DSCR
- 0.57
- GRM
- 12.2
CMA / ARV
No comps found within radius.
Projected returns pro-forma
4.98% appreciation · 7.03% rent growth · sell at horizon
- IRR
- 5.9%
- Equity multiple
- 1.38×
- Total profit
- $61,173
- Equity at exit
- $321,823
- IRR
- 9.6%
- Equity multiple
- 2.87×
- Total profit
- $298,087
- Equity at exit
- $554,909
Cash invested: $159,320 (down + closing). Projections, not guarantees.
Landlord ↔ Tenant lean methodology
- Overall (CITY)
- 0 Strongly Tenant-Friendly
- State New York
- 15 Strongly Tenant-Friendly · D+10
- County
- — inherits STATE
- City New York
- 0 Strongly Tenant-Friendly · D+34
ZIP-level market 11224
- Home prices YoY
- 1.0%
- Rents YoY
- 7.0%
- Active inventory
- 114
- Price-to-rent
- 12.2×
Monthly cashflow live
- Estimated rent
- $3,871 high interval (Pro) →
- Mortgage (P&I)
- −$2,984
- Tax from tax record
- −$212 /mo · $2,546/yr
- Insurance
- −$237
- Flood insurance flood zone
- −$66 /mo · $798/yr
- HOA est. from 1 same-building comp
- −$910
- Vacancy / Maint / Mgmt
- −$813
- Net cashflow
- $-1,351
Break-even live
Sensitivity live
| Price | -10% $-1,029 | -5% $-1,190 | +0% $-1,351 | +5% $-1,512 | +10% $-1,674 |
|---|---|---|---|---|---|
| Rent | -10% $-1,657 | -5% $-1,504 | +0% $-1,351 | +5% $-1,199 | +10% $-1,046 |
| Rate | -1.0pp $-1,065 | -0.5pp $-1,207 | base $-1,351 | +0.5pp $-1,499 | +1.0pp $-1,649 |
UW: 25.0% down · 7.5% · 30yr · 1.5% tax · 5.0% vac · 8.0% maint · 8.0% mgmt
Financing live
Cash to close
- Down payment
- $142,250
- Closing costs
- $17,070
- Reserves months
- —
- Total cash needed
- —
Loan-product check · same deal, 3 products live
Conventional
25% down · 7.5% · 30yr
- Down + closing
- —
- Monthly P&I
- —
- Monthly cashflow
- —
- DSCR
- —
- Eligible?
- —
Personal DTI + credit; lowest rate.
DSCR
20% down · 8.5% · 30yr
- Down + closing
- —
- Monthly P&I
- —
- Monthly cashflow
- —
- DSCR
- —
- Eligible?
- —
No personal income docs; deal must DSCR.
Hard money
10% down · 12.0% · 12mo
- Down + closing
- —
- Monthly P&I
- —
- Monthly cashflow
- —
- DSCR
- —
- Eligible?
- —
Short-term bridge; refi at stabilization.
Rent comps 10 comps
| Address | Beds | Baths | Sqft | Rent | $/sqft | DOM | Units | Dist |
|---|---|---|---|---|---|---|---|---|
| 532 Neptune Ave Brooklyn, NY | 1.0–3.0 | 1.0–2.0 | 948 | $4,550 | $4.80 | 1d | 8 | 0.23mi |
| 2971 Shell Rd Unit 720 Brooklyn, NY | 2.0 | 2.0 | 920 | $4,100 | $4.46 | 26d | 1 | 0.31mi |
| 2971 Shell Rd Unit 704 Brooklyn, NY | 2.0 | 1.0 | 826 | $3,950 | $4.78 | 26d | 1 | 0.31mi |
| 2971 Shell Rd Unit 711 Brooklyn, NY | 2.0 | 2.0 | 907 | $4,200 | $4.63 | 26d | 1 | 0.31mi |
| 2971 Shell Rd Unit 612 Brooklyn, NY | 2.0 | 2.0 | 907 | $4,150 | $4.58 | 26d | 1 | 0.31mi |
| 2971 Shell Rd Unit 508 Brooklyn, NY | 2.0 | 2.0 | 930 | $4,099 | $4.41 | 26d | 1 | 0.31mi |
| 2971 Shell Rd Unit 406 Brooklyn, NY | 2.0 | 2.0 | 920 | $3,550 | $3.86 | 26d | 1 | 0.31mi |
| 1515 Surf Ave Brooklyn, NY | 1.0–2.0 | 1.0 | 706 | $5,195 | $7.35 | 0d | 16 | 0.47mi |
| 2538 E 2nd St Unit 2 Brooklyn, NY | 3.0 | 1.0 | 1100 | $2,600 | $2.36 | 26d | 1 | 0.86mi |
| 2483 W 16th St Brooklyn, NY | 1.0 | 1.0 | 800 | $1,800 | $2.25 | 22d | 1 | 0.94mi |
HOA detail condo
- Monthly dues
- $0 · $0/yr
- Likely covers
- waterpoolgymsecurity
- Assessments
- None detected in remarks — confirm with the listing agent.
Listing history 14 events
-
2026-06-21days on market $569,000 Active 49 DOM
-
2026-06-18days on market $569,000 Active 46 DOM
-
2026-06-17days on market $569,000 Active 45 DOM
-
2026-06-16days on market $569,000 Active 44 DOM
-
2026-06-15days on market $569,000 Active 43 DOM
-
2026-06-13pricedays on market $569,000 Active 41 DOM
-
2026-06-10days on market $595,000 Active 37 DOM
-
2026-06-08days on market $595,000 Active 36 DOM
-
2026-06-08days on market $595,000 Active 35 DOM
-
2026-06-04days on market $595,000 Active 32 DOM
-
2026-06-03days on market $595,000 Active 31 DOM
-
2026-06-01days on market $595,000 Active 29 DOM
-
2026-05-31days on market $595,000 Active 28 DOM
-
2026-05-03$689,000 Active
ⓘ Source: listings_history table (triggers on properties + properties_extension) + one-shot
backfill from property_details.listing_events for pre-trigger history.
Tax reassessment forecast NY · Partial reset (capped growth)
- Current annual tax
- $2,546 · $212/mo
- Projected year-2 tax
- $6,081 · $507/mo
- Expected delta
- +$3,535/yr (+$295/mo · 138.9%)
ⓘ Screening estimate from a state-policy table — verify with the county assessor before closing.
Climate risk First Street
- Flood 7/10 Severe FEMA zone X (shaded) · 87% chance over 30 yrs
- Wildfire 1/10 Low
- Heat 6/10 Major 6 d/yr ≥97°F today · 14 d/yr by 30 yrs out
- Wind 8/10 Severe 80% chance of damaging wind over 30 yrs
- Air quality 4/10 Moderate 5 unhealthy d/yr today · 7 by 30 yrs out
Nearby sold comps map
Loading sold comps map…
Walkable amenities ~0.75 mi
Loading nearby amenities…
Taxation est. · year 1
- Rental income
- $46,453
- − Mortgage interest
- −$31,873
- − Property taxes
- −$2,546
- − Insurance
- −$3,642
- − Repairs & maintenance
- −$3,716
- − Management
- −$3,716
- − HOA
- −$10,920
- − Depreciation
- −$16,553
- Taxable loss
- −$26,513
- Est. tax savings @ 24.0%
- +$6,363
- After-tax cash flow
- $-9,854/yr
For passive investors: Depreciation is non-cash, so a rental often shows a tax loss while cash-flowing — sheltering income. Rental losses are passive: they offset passive income freely, and up to $25,000/yr can offset ordinary (W-2) income if you actively participate and your MAGI is under $100k (phasing out to $0 by $150k); unused losses carry forward. On sale, claimed depreciation is recaptured at up to 25%, and gains may owe capital-gains tax (a 1031 exchange can defer both). Figures are a year-1 estimate at your 24.0% rate — not tax advice; consult a CPA.
Schools (NCES district)
No district data.
Livability — New York
- Score
- 75/100
- State rank
- #268
- US rank
- #4188
Category grades
Schools grade is shown separately in the Schools card above.
Census & demographics
- Census place
- New York, NY
- County
- Kings County · 2,614,986 people
- City population
- 7,731,280
- Metro
- New York-Newark-Jersey City, NY-NJ-PA
- Population (ZIP)
- 50,822
- Household income
- $43,648
- Rent vs Own
- Severe rent burden
- 4426.0
Population outlook (Kings County) Hauer SSP2
- Today (2025)
- 2,847,441 people
- By 2030
- 2,937,006 · +3.1%
- By 2040
- 3,095,491 · +8.7%
- By 2050
- 3,228,968 · +13.4%
- By 2075
- 3,321,723 · +16.7%
- By 2100
- 3,111,387 · +9.3%
Race, ethnicity, and origin ACS 2023
- Neighborhood character
- Diverse neighborhood (Simpson 0.68)
- Race & ethnicity
- White 48% Black 22% Hispanic / Latino 19% Asian 8% Two or more races 7%
- Hispanic origin (detail)
- Mexican 5% Puerto Rican 8% Dominican 2%
- Common ancestry
- Scotch-Irish 10% Subsaharan African 7% Romanian 1%
- Foreign-born
- 48% · Canada, China
- Languages at home
- 42% English-only · Russian/Polish/Slavic 32% Spanish 11% Chinese 5%
Political lean MEDSL · Kings
- 2024 margin
- Solid D (+44.0) · D 72.0% · R 28.0%
- 2008→2024 swing
- -15.5pp toward R · 2008: 59.4pp · 2024: 44.0pp
- All cycles
- 2024: D+44.0 2020: D+54.8 2016: D+61.8 2012: D+63.9 2008: D+59.4
Not yet ingested
- Civics
- —
Market trends
- HPI YoY
- ▲ 4.98%
- Current HPI
- 505.1405
- Rent YoY
- ▲ 7.03%
- Metro
- New York-Newark-Jersey City, NY-NJ-PA
- State GDP YoY
- ▲ 2.60%
- F500 in state
- 92
Industry mix (Fortune 500 HQ in NY)
| Industry | F500 HQs | Revenue |
|---|---|---|
| Financial Services | 10 | $950B |
|
||
| Consumer Goods | 9 | $162B |
|
||
| Insurance | 4 | $225B |
|
||
| Telecommunications | 2 | $144B |
|
||
| Pharmaceuticals | 2 | $112B |
|
||
| Media / Entertainment | 2 | $69B |
|
||
Price history
1 event — show timeline
- 2026-05-03 Listed $689,000 BNYMLS
Property tax history
+8.9%/yrLatest (2025): $2,546 · +55.8% YoY. Source: county tax records.
Cash-flow waterfall
monthlySold comps — $/sqft
last 12 mo · ≤1 miLoading sold comps…